Sunspots Abruptly Disappear

After 4 years of non-stop sunspot activity, the face of the sun is suddenly blank–no sunspots. The first spotless days since 2022 herald the distant approach of a new Solar Minimum.

From Watts Up With That?

Via Spaceweather.com

After 4 years of non-stop sunspot activity, the face of the sun is suddenly blank–no sunspots. The first spotless days since 2022 herald the distant approach of a new Solar Minimum.

Click on this image to magnify it and take a careful look around the solar disk. Can you find any sunspots? 

This week has brought the first “spotless days” since 2022. So far, Feb. 22nd, Feb. 23rd, and Feb 24th have had completely blank suns. This breaks an uninterrupted 4 years of non-stop sunspot activity.

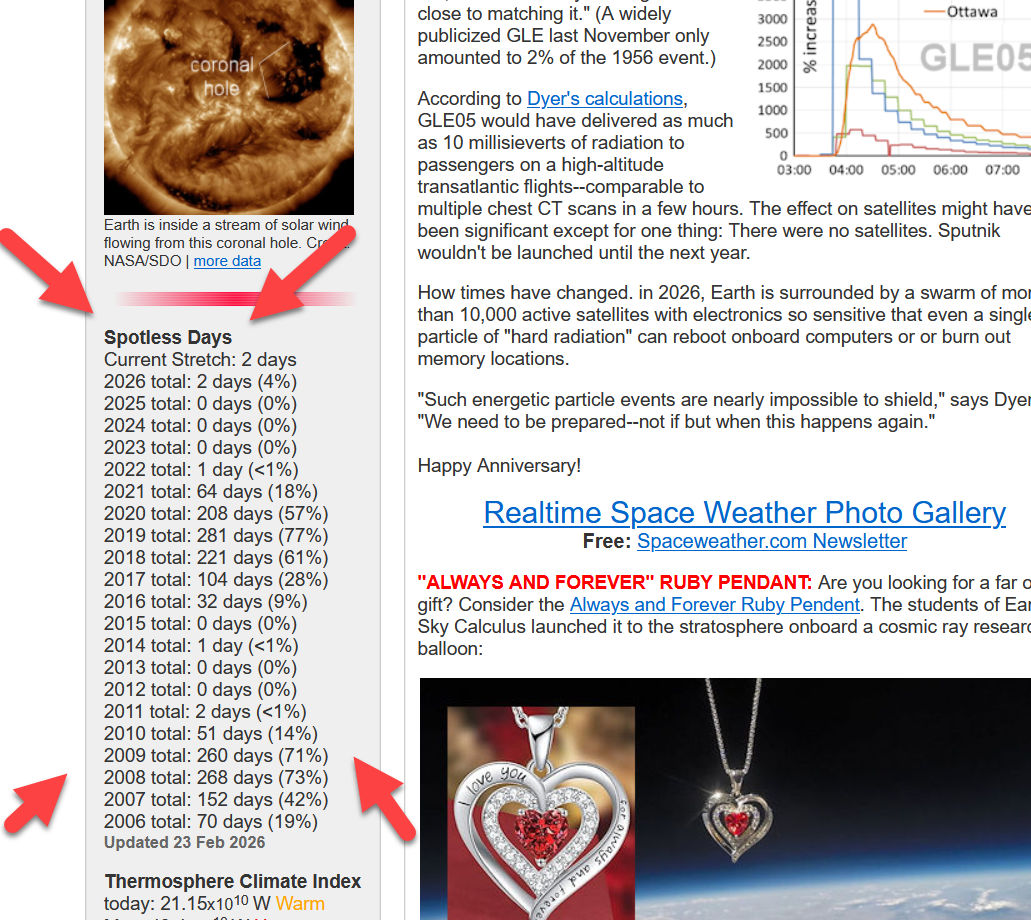
What does this mean? It’s an early warning of Solar Minimum, the low point of the 11-year solar cycle. During years around Solar Minimum, whole months can go by without a single sunspot, racking up dozens of spotless days in a row. Between 2018 and 2020 (the last Solar Minimum) there were more than 700 spotless days in total. You can find the daily counts right here on Spaceweather.com. The Current Spotless Stretch is 3 days.

Solar Cycle 25 still has years of life left in it. However, these spotless days tell us that the current cycle is waning. Sunspots will be back–probably tomorrow–but this week is a preview of things to come.

Solar Cycles in 150 Years of Global Sea Surface Temperature Data?

Signals of warming during solar maximum and cooling during solar minimum years are found in the global SST over the 14 cycles from 1854–2007.

A map showing the CMD-derived spatial pattern of solar sea surface temperature (SST) response in degrees Celsius, with regions of warming and cooling indicated by color gradients.

From Watts Up With That?

From Anthony Watts

Note: we’ve looked at solar to temperature correlations many times on WUWT, and our resident stats guru Willis Eschenbach has always found some flaw in the solar cycles to temperature analysis done by others. They say this in the paper:

It is often thought that the response to solar cycle is too weak at the surface to be detectable, and that even if a signal is claimed to have been found its statistical significance cannot be established. Using 150 yr of sea surface temperature data from 1854 to 2007 and an objective method, we found a robust signal of warming over solar max and cooling over solar min, with high statistical significance in the time domain.

We’ll see if this one pans out -Anthony

Scientific article titled 'Solar Cycles in 150 Years of Global Sea Surface Temperature Data' by Jiansong Zhou and Ka-Kit Tung, featuring the abstract and methodology regarding solar cycle impacts on sea surface temperature.

This paper demonstrates that a solar cycle response exists in global sea surface temperatures (SST). The abstract says, “The signal is robust provided that the years near the Second World War are excluded, during which transitions from British ships to U.S. ships introduced warm bias in the SST.”

Signals of warming during solar maximum and cooling during solar minimum years are found in the global SST over the 14 cycles from 1854–2007.

The magnitude of the solar cycle response averaged over the oceans between 60°S and 60°N is about 0.1°C of warming for each W/m2 variation of the total solar irradiance. This value was determined after excluding suspected bad data. The multidecadal trend of response to solar forcing is found to account for about a quarter of the observed warming in SST during the past 150 yr.

Some figures from the paper:

A map showing the spatial pattern of sea surface temperature (SST) response to solar cycles from 1854 to 2007, with color gradations indicating temperature changes in degrees Celsius, along with a graph displaying the time series of total solar irradiance (TSI) and SST response over the same period.
Map showing the CMD-derived spatial pattern of the solar sea surface temperature (SST) response in degrees Celsius, with a color gradient representing variations; includes a graph of total solar irradiance (TSI) and sea surface temperature response over the years 1880 to 2007.

Data Reveal That US Heat Wave Index, Japan Drought Coincide With Solar Activity

In 1962, Japanese meteorologist Hirohide Saito found the instability of summer temperature of Hokkaido (northern part of Japan) during the solar minimum.
In 1967 Japanese meteorologist Junkichi Nemoto published the following graph, below, showing that drought in Japan occurs at the solar minimum as well as at the solar maximum.

From NoTricksZone

By P Gosselin

Jet Stream Blocking and U.S. Heat Wave Index

By Kyoji Kimoto

In 1962, Japanese meteorologist Hirohide Saito found the instability of summer temperature of Hokkaido (northern part of Japan) during the solar minimum as follows:

Fig.1 Instability of summer temperature (white circle) of Hokkaido

In 1967 Japanese meteorologist Junkichi Nemoto published the following graph, below, showing that drought in Japan occurs at the solar minimum as well as at the solar maximum. Further Nemoto showed the drought occurs with the crop failure due to the low temperature in the northern part of Japan at the solar minimum. This is coincident with Saito’s finding above showing the instability of summer temperature at the solar minimum in Hokkaido.

Fig.2 Drought at the solar minimum (A series) and at the solar maximum (B series); black bar (drought) , black dot (rice crop failure due to low temperature in the northern part of Japan)

In 1988, based on the meteorological studies above, Japanese climatologist Kunihiko Kodera published the following graph showing the jet stream blocking frequency is higher at the sunspot minimum and the aa index minimum. The graph shows the highest frequency of the jet stream blocking during 1931-1936, which is coincident with the highest U.S. heat wave index and the highest burned forest area below.

Fig.3 Relation between the frequency of blocking days and solar activity; a is the inverse of proxy for blocking days frequency; b is geomagnetic aa index of solar activity; c is sunspot data.

(References)

Junkichi Nemoto, “Drought at the western area of Japan during summer to autumn in 1967 (in Japanese) “, Tenki (Weather in Japanese), Vol. 14, No.12, 1-7 (Dec.1967).

Kunihiko Kodera, “ Summer temperature at Sapporo area and solar activity (in Japanese) “, Tenki (Weather in Japanese), Vol. 35, No.5, 33-35 (May, 1988).