Solar Cycles in 150 Years of Global Sea Surface Temperature Data?

Signals of warming during solar maximum and cooling during solar minimum years are found in the global SST over the 14 cycles from 1854–2007.

A map showing the CMD-derived spatial pattern of solar sea surface temperature (SST) response in degrees Celsius, with regions of warming and cooling indicated by color gradients.

From Watts Up With That?

From Anthony Watts

Note: we’ve looked at solar to temperature correlations many times on WUWT, and our resident stats guru Willis Eschenbach has always found some flaw in the solar cycles to temperature analysis done by others. They say this in the paper:

It is often thought that the response to solar cycle is too weak at the surface to be detectable, and that even if a signal is claimed to have been found its statistical significance cannot be established. Using 150 yr of sea surface temperature data from 1854 to 2007 and an objective method, we found a robust signal of warming over solar max and cooling over solar min, with high statistical significance in the time domain.

We’ll see if this one pans out -Anthony

Scientific article titled 'Solar Cycles in 150 Years of Global Sea Surface Temperature Data' by Jiansong Zhou and Ka-Kit Tung, featuring the abstract and methodology regarding solar cycle impacts on sea surface temperature.

This paper demonstrates that a solar cycle response exists in global sea surface temperatures (SST). The abstract says, “The signal is robust provided that the years near the Second World War are excluded, during which transitions from British ships to U.S. ships introduced warm bias in the SST.”

Signals of warming during solar maximum and cooling during solar minimum years are found in the global SST over the 14 cycles from 1854–2007.

The magnitude of the solar cycle response averaged over the oceans between 60°S and 60°N is about 0.1°C of warming for each W/m2 variation of the total solar irradiance. This value was determined after excluding suspected bad data. The multidecadal trend of response to solar forcing is found to account for about a quarter of the observed warming in SST during the past 150 yr.

Some figures from the paper:

A map showing the spatial pattern of sea surface temperature (SST) response to solar cycles from 1854 to 2007, with color gradations indicating temperature changes in degrees Celsius, along with a graph displaying the time series of total solar irradiance (TSI) and SST response over the same period.
Map showing the CMD-derived spatial pattern of the solar sea surface temperature (SST) response in degrees Celsius, with a color gradient representing variations; includes a graph of total solar irradiance (TSI) and sea surface temperature response over the years 1880 to 2007.

Solar Max Might Arrive Early

Solar Maximum is coming–maybe this year. New research by a leading group of solar physicists predicts maximum sunspot activity in late 2023 or early 2024, a full year earlier than other forecasts.

From Spaceweather.com

By DR.TONY PHILLIPS

April 13: 2023: Solar Maximum is coming–maybe this year. New research by a leading group of solar physicists predicts maximum sunspot activity in late 2023 or early 2024, a full year earlier than other forecasts.

“This is based on our work with the Termination Event,” explains Scott McIntosh, lead author of a paper describing the prediction, published in the January 2023 edition of Frontiers in Astronomy and Space Sciences.

Above: The red curve shows McIntosh et al’s new prediction of an early Solar Max. 

The „Termination Event“ is a relatively new concept in solar physics. It is a period of time on the sun as short as one month when magnetic fields from one solar cycle abruptly die (they are „terminated“) allowing magnetic fields from the next solar cycle to take over. After a Termination Event, the new solar cycle skyrockets.

McIntosh and colleagues have studied termination events for many solar cycles, and they have discovered that its timing can predict the future. „Our latest work pinpoints the Termination Event between Solar Cycle 24 and Solar Cycle 25 at mid-Dec. 2021,“ explains McIntosh. „This tells us about the size and date of the next solar maximum.“

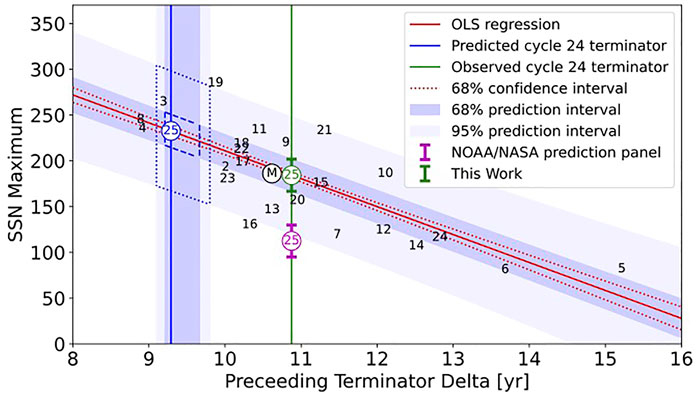
According to their paper, Solar Max is coming between late 2023 and mid 2024, with a peak total monthly sunspot number of 184±63 (95% confidence). This means Solar Cycle 25 could be twice as strong as old Solar Cycle 24, which peaked back in 2014. 

Above: The sun’s polar magnetic field (red=N, blue=S) is weakening and will soon flip

Their forecast jibes with another big event now underway. The sun’s global magnetic field is about to flip. This happens near the peak of every solar cycle. Magnetic fields near the sun’s poles weaken, change sign, and start growing again in the opposite direction. It’s like taking a bar magnet from your refrigerator and flipping it upside down–except this bar magnet is as big as a star.

Measurements from Stanford’s Wilcox Solar Observatory (pictured above) confirm that the weakening is underway now, with polar magnetic fields probably crossing zero in no more than a few months. „Historically the zero crossing precedes actual sunspot number maximum by 6 to 12 months,“ says McIntosh, „so this is in accord with our prediction of an early Solar Max.“

This forecast is about to be tested, with confirmation as little as 6 to 12 months away. Stay tuned for Solar Max.

This story was brought to you by Spaceweather.com