The 2023 climate event revealed the greatest failure of climate science

We have been fortunate to witness the largest climate event to occur on the planet since the advent of global satellite records, and possibly the largest event since the eruption of Mount Tambora in 1815. It is clearly a naturally occurring, externally forced climate event. However, mainstream climate scientists are not treating it appropriately. This is because climate science does not function like other sciences and is subject to strong confirmation bias. The first step to learning from the 2023 event is accepting its exceptional nature, which many fail to do.

Graph depicting global low cloud cover anomalies from 2015 to 2023, highlighting the impact of El Niño events and the Hunga Tonga eruption.

From Climate Etc.

By Javier Vinos

We have been fortunate to witness the largest climate event to occur on the planet since the advent of global satellite records, and possibly the largest event since the eruption of Mount Tambora in 1815. It is clearly a naturally occurring, externally forced climate event. However, mainstream climate scientists are not treating it appropriately. This is because climate science does not function like other sciences and is subject to strong confirmation bias. The first step to learning from the 2023 event is accepting its exceptional nature, which many fail to do.

  1. An externally forced extraordinary event

If you are still not convinced of the extremely anomalous nature of the climatic event of 2023, let’s review some of the events of 2023-24. Taken together, they make it clear. The following list is incomplete and comes from my notes:

  • Extraordinary ocean warming that models can’t explain.[1]
  • Record-low Antarctic sea ice.[2]
  • A record-breaking Amazon drought in 2023.[3]
  • 31 atmospheric river events in the western US from November 2022 to March 2023. Nine made landfall in California marking the record in the 70-year database.[4]
  • The snowiest season in 71 years occurred in California after a 1-in-54-year event.[5]
  • NYC had the least snowy season on record, breaking a 50-year record on latest first snow.[6]
  • Cyclone Freddy in the Indian Ocean was the longest-lasting tropical cyclone ever.[7]
  • ITCZ displacement and unusual rains in the Sahara in 2024.[8]
  • The first half of the 2024 hurricane season was surprisingly quiet, and models can’t explain it.[9]
  • In 2023, 42% of the globe experienced heat exceeding two standard deviations. Louisiana, for example, had its hottest summer in 129 years of records.[10]
  • 2023 was the warmest year on record, and 2024 was even warmer.
  • In October 2024, the North Polar Vortex was the weakest in 40 years. The three sudden stratospheric warming events that occurred in the same season are a one-in-250-year event according to models.[11]
  • The biggest global low cloud cover anomaly ever recorded occurred in 2023.[12]
Line graph showing changes in low cloud cover from 2015 to 2023, indicating periods of El Niño and marked by events such as the Hunga Tonga eruption.
Figure 1. ERA5 Zonal-mean anomaly in low cloud cover suggests that 2023 planetary albedo may have been the lowest since at least 1940.12

No one seems to be connecting the dots indicating that a series of extraordinary atmospheric events took place in 2023–24. These events suggest that an external factor significantly impacted atmospheric circulation. Climate science focuses heavily on a relatively uninformative and uncertain parameter called surface temperature anomaly, which is the variation in the average of the daily maximum and minimum temperatures across widely disparate areas. Nevertheless, even this inadequate parameter reflects the unusual nature of the 2023 event.

Graph showing sea surface temperature anomaly in degrees Celsius from 2022 to 2026, with a marked eruption point and fluctuations over the years.
Figure 2. The 2023 climate event can be seen most clearly in the global sea surface temperature anomaly (NOAA, 60°N–60°S, baseline 2021). It began in December 2022. By November 2025, 90% of the warming from the 2023 event has disappeared.

Many 2023 temperatures were not only record temperatures, but they also broke the previous records by the largest margin in the datasets, as I pointed in the article, I wrote for Climate Etc. in July 2024 “Hunga Tonga volcano: impact on record warming”. Rantanen and Laaksonen (2024) selected September 2023 in ERA5 reanalysis as the 2023 record warming month by the largest margin and, using the CMIP6 ensemble for the likely transient climate response, as recommended, found only a 0.2 % probability that it could be due to the unforced internal variability and the forced greenhouse gas-induced trend.10 They conclude that an external forcing is required and point to the Hunga Tonga eruption and the removal of sulfur pollution from ships as possibilities.

  1. Rounding up the usual suspects in an unusual crime

One might think that the lack of precedents for such an unusual event would make scientists skeptical of the factors affecting the climate over the last hundred years, since nothing similar appears in the records. However, to publish another paper, scientists must explain what happened, and the models are incapable of providing explanations outside their programming. This programming obviously does not include extraordinary events of which we had no prior knowledge.

Therefore, it has been argued that El Niño in 2023 may have been one of the main causes. However, in my article of 2024 I presented two compelling reasons why the 2023 El Niño cannot be held responsible. First, the warming of the globe oceans occurred simultaneously with El Niño, rather than subsequently, as was the case in previous Niños. Second, unlike all other Niños except the one caused by the eruption of Mount Pinatubo in 1992, the PDO was in a negative state during the 2023 El Niño.

Despite supporting ENSO’s involvement in what happened, Minobe et al. (2025) provide further arguments.[13] First, they demonstrate that the extraordinary warming event of 2023 started in the Southern Ocean in November 2022, which was four months prior to the tropical Pacific’s warming and the onset of El Niño. A consequence cannot precede its cause. Second, they demonstrate that the Earth’s energy imbalance anomaly between 2022 and 2023 was over 75% larger than during the onset of similar recent El Niño events. This unprecedented event first impacted the top of the atmosphere and began in 2022. Furthermore, the set of atmospheric and oceanic indicators included in the multivariate El Niño index (MEI) suggests that the 2023 El Niño event was not particularly intense. An El Niño event like many others cannot cause an unprecedented event.

Graph depicting shortwave and longwave radiation alongside the Multivariate El Niño Index (MEI) from 2006 to 2024, with temperature anomalies for the Southern Ocean and Tropical Pacific shown in two subplots.
Figure 3. a) Global top of the atmosphere anomalies of shortwave (downward) and longwave (downward) radiation and Multivariate ENSO Index (MEI). A strong increase in shortwave radiation started in 2022. Global warming caused a strong increase in upward longwave radiation in 2023 in advance of an average intensity El Niño. b) Monthly anomaly time series of sea surface temperature in selected regions of the Southern Ocean and the Tropical Pacific. The anomaly started around November 2022 in the Southern Ocean, about 4 months before El Niño started in the Pacific.13

Those who believe ENSO played a significant role in the 2023 event point to the three years of La Niña preceding it. They claim this overloaded the heat system, causing it to explode with the 2023 El Niño event. However, there are precedents for three consecutive Niñas in the records, in 1974-1976 and 1999-2001, yet nothing like the 2023 event occurred. While explanations can be sought as to why the three Niñas produced such a different result this time, given that things never repeat exactly the same way, these explanations are still ad hoc with no evidence to back them up.

More surprising is the argument that the event was caused by anthropogenic factors. Anthropogenic forcing is small and constant, and can only produce noticeable changes over long periods of time, decades or centuries. Interannual changes, by definition, are due to natural factors or internal variability. As an example, after 50 years of global warming, it is still unclear what changes we can expect in the ENSO system if the warming continues for another 50 years.

One exception to this long-term anthropogenic forcing is the reduction in sulfur emissions due to the maritime fuel regulations that came into force in 2020, and was therefore abrupt. However, we can rule this out as a cause of the 2023 event because the reduction is permanent, whereas the ocean warming that occurred in 2023 was essentially reversed in 2024 and 2025 (see Figure 2).

  1. Most scientists are ignoring the cooling that has taken place since the 2023 event.

The truth is that climate scientists have much more difficulty explaining cooling than warming when CO2 levels increase. This inherent bias embedded in the models probably indicates that there are fundamental aspects of the climate that are not well understood. This may explain why the 2023 warming generated a multitude of headlines and articles, while the 2024 and 2025 cooling is characterized by scientists’ silence in the face of something equally spectacular.

For example, the annual scientific reports titled “10 New Insights in Climate Science” by the Future Earth organization, publisher of the journal Anthropocene, are worth highlighting.[14] Two of the ten insights in each of the 2023, 2024, and 2025 reports refer to abrupt warming. However, despite cooling beginning in early 2024, no article refers to it.

It is difficult to find any mention of ocean cooling. In 2024, New Scientist magazine reported that a part of the Atlantic Ocean was cooling at a record speed:

“Over the past three months, temperatures in that part of the Atlantic cooled off more rapidly than at any time in records extending back to 1982. This sudden shift is perplexing because the strong trade winds that normally drive such cooling have not developed, says Franz Philip Tuchen at the University of Miami in Florida. ‘We’ve gone through the list of possible mechanisms, and nothing checks the box so far.’”[15]

We can add ocean cooling as another anomaly that remains unexplained in terms of its magnitude, speed, and cause.

When an El Niño event transitions to a La Niña event, the equatorial Pacific usually cools rapidly. However, the cooling in 2024 was global. Although La Niña conditions occurred in the winter of 2024–2025, they were not intense enough and long enough to qualify as an actual La Niña event. In other words, the tremendous cooling of the planet’s oceans has included the equatorial Pacific, but the equatorial Pacific has not induced it.

  1. The only known extraordinary factor is the eruption of Hunga Tonga.

According to Occam’s razor, a climatic event of unparalleled magnitude in modern records requires an exceptional cause. The factors responsible for normal climate variability are insufficient. The only extraordinary factor preceding the 2023 event was the explosion of the Hunga Tonga underwater volcano. The 150 megatons of water vapor that it released into the stratosphere are without precedent in our records. We do not know all the effects this may have had on the climate. Eruptions that reach the stratosphere have radiative, chemical, and dynamic effects. However, only the first two are well known.

There are several aspects of the Tambora eruption in April 1815 that scientists have not yet explained satisfactorily. First, the effects were delayed, as the anomalies that led to the year without a summer in 1816 did not begin until 15 months after the eruption. The usual explanation is that atmospheric dynamics delayed the radiative effects in the Northern Hemisphere. However, this explanation conflicts with the second unexplained aspect: the climatic effect on the Northern Hemisphere was much greater than on the Southern Hemisphere. The cause of this inequality between the hemispheres is unknown since volcanic aerosols and their radiative effects are distributed across both hemispheres in a tropical eruption.

Graph comparing extreme temperature periods in the Northern and Southern Hemispheres, highlighting the impact of the Tambora eruption in 1815, and showing volcanic and solar forcing over time.
Figure 4. The inability of models to reproduce the climatic effects of large volcanic eruptions calls into question the reliability of their diagnosis that the Hunga Tonga eruption had little effect on the surface climate. a) All models reproduce a cooling effect in the southern hemisphere as a result of the 1815 Tambora eruption, but this effect is not supported by evidence.[16] b) The models greatly exaggerate the cooling of sea temperatures that occurred as a result of the 1815 Tambora eruption and a previous one in 1809. The observations (in black) show a much smaller cooling.[17]

Climate models do not adequately reproduce the effects of the 1815 Tambora eruption, suggesting that dynamic atmospheric changes caused by stratospheric eruptions or other factors have a much greater impact on climate than previously thought. It is striking that the evolution of the ocean temperature anomaly generally coincides with the evolution of water vapor anomalies in extratropical middle-stratospheric latitudes in the Northern Hemisphere but not in the entire stratosphere.

Graph showing sea surface temperature anomaly in degrees Celsius from 2022 to 2025 at 45 degrees North, indicating a peak in 2023 due to an eruption.
Figure 5. The global sea surface temperature anomaly (NOAA, 60°N–60°S, baseline 2021) is shown in red over a background image of the water vapor anomaly in the stratosphere at 45°N.

Because models cannot adequately incorporate the effects of stratospheric eruptions on atmospheric circulation dynamics, the conclusion that the Hunga Tonga eruption had minimal effects on the surface climate is not convincing.[18] This conclusion is based primarily on knowledge of the radiative properties of water vapor. Studies support a relationship between these eruptions and changes in global atmospheric circulation, the polar vortex, El Niño–Southern Oscillation, evaporation, and cloud cover.

Without a doubt, we know that the climatic event of 2023 was caused by a drastic decrease in global cloud cover, the largest in at least 40 years (see Figure 1). This reduction caused the planet to absorb more solar energy and warm up. However, we do not know what controls changes in clouds. It’s astonishing that we claim to understand the cause of recent climate change yet remain ignorant of such a fundamental aspect.

Clouds cannot form without evaporation. In their recent work, Fajber et al. (2023) present compelling evidence that the evaporation gradient between the tropics and the poles controls the amount of heat transported through the atmosphere.[19] However, they made the common mistake of assuming that evaporation is controlled by temperature via the Clausius–Clapeyron relation. This error stems from the assumption that wind is constant at the global level. The Clausius–Clapeyron relation is accurate at the microscopic level, at the interface between water and air. However, at the macroscopic level, wind speed has a greater impact on evaporation than temperature or humidity. In a cold, humid environment, clothes hung out to dry will dry if there is enough wind. However, few climate scientists have experience hanging clothes out to dry in the wind. Furthermore, wind speed is not constant; rather, it exhibits significant changes and opposing trends over oceans and land. These changes lead to important changes in evaporation, cloud formation, and their transport and distribution.[20]

If changes in the clouds caused the temperature changes, then we cannot use the temperature changes as the cause of the cloud changes. The most likely cause is the change in atmospheric circulation, which occurred due to the atmospheric anomalies that have taken place since the end of 2022, as discussed in Section 1.

For anyone who is not committed to the explanation of climate change due to the radiative properties of greenhouse gases, the Hunga Tonga eruption is currently the best explanation for the 2023 climate event. In July 2025, I analyzed that “if Hunga Tonga is responsible for the 2023-24 warming event, a clear prediction is that we should observe most of this warming disappear in 3-5 years.“[21] This projection does not arise from any of the other considered causes. By December 2025, four years after the eruption, this prediction had come true: the ocean temperature anomaly in November was only 0.05°C higher than in November 2021, before the eruption. 90 % of the ocean warming from the 2023 climate event has disappeared.

  1. The greatest failure of climate science

Climate science has failed the test of an externally forced natural climate event. Most scientists who have published studies on the 2023 climate event have not recognized its nature. Any climatological manifestations of the event that do not align with the dominant consensus have been treated as either natural variability or rare events whose probability has increased due to anthropogenic climate change. No studies have addressed the climatic event in all its manifestations or analyzed its possible causes without relying on models clearly not designed to shed light on something we did not know was possible.

Rather than trying to determine the causes of the event, scientists have attempted to fit it into the dominant theory using models. In light of evidence of major natural climate change, this approach reveals its greatest flaw: the theory relies on an excessive focus on greenhouse gases and aerosols as the cause and temperature changes as the effect.

Personal note:

2026 will mark the tenth anniversary of my first post on Judith Curry’s Climate Etc. blog. Believe it or not, I began researching climate change in 2015 because I was concerned about its potential impact on our society. As a scientist from a different field entirely, I trusted my fellow scientists, learned societies, and scientific journal editors to evaluate the risk. As an avid reader of scientific literature from many disciplines, I immersed myself in hundreds and then thousands of papers, convinced that evidence of dramatic human-caused climate change was there. However, I came away empty-handed and profoundly skeptical of everything I had been told without ever being shown the evidence. I realized natural climate change is greatly misunderstood and insufficient effort is being done to correct that. Over these past 10 years, I’ve spent a lot of time trying to straighten out the science of climate, and I will spend 10 more years doing so if necessary. If you would like to hear more often from me, you can find me on 𝕏 @JVinos_Climate

[1] Schmidt G (2024). “Climate models can’t explain 2023’s huge heat anomaly — we could be in uncharted territory” Nature, 627, 467.

[2] Gilbert E & Holmes C (2024). “2023’s Antarctic sea ice extent is the lowest on record” Weather, 79, 2, 46-51.

[3] Espinoza JC et al. (2024) “The new record of drought and warmth in the Amazon in 2023 related to regional and global climatic features” Sci Rep 14, 8107.

[4] Kawzenuk B et al. (2023) “Mesoscale analysis of landfalling atmospheric rivers in California during December 2022 and January 2023” Atmospheric River Reconnaissance Workshop 2023.

[5] Marshall AM et al. (2024) “California’s 2023 snow deluge: Contextualizing an extreme snow year against future climate change” PNAS 121, 20, e2320600121.

[6] Silive.com (2024) “2023 least snowiest year in NYC on record, says National Weather Service“.
New York Post (2023) “Snowless NYC breaks 50-year record of longest winter without flurries“.

[7] NOAA (2024) “Australia to Africa in 36 days: Tropical Cyclone Freddy (2023), the longest-lasting tropical cyclone in history“.

[8] Live Science (2024) “Sahara desert hit by extraordinary rainfall event that could mess with this year’s hurricane season“.

[9] Klotzbach PJ et al. (2025) “The Remarkable 2024 North Atlantic Mid-Season Hurricane Lull” Geophys Res Lett, 52, 19, e2025GL116714

[10] Rantanen M & Laaksonen A (2024) “The jump in global temperatures in September 2023 is extremely unlikely due to internal climate variability alone” Clim Atmos Sci 7, 34.
Yale Climate Connections (2023) “Summer 2023 broke dozens of all-time monthly heat records“.

[11] Severe Weather EU (2024) “Unusually weak Polar Vortex is developing in the Stratosphere, linked with the Weather patterns over the United States and Canada“.
Met Office UK (2024) “One in 250-year event underway high in the atmosphere“.

[12] Goessling HF et al. (2024) “Recent global temperature surge intensified by record-low planetary albedo” Science, 387, 6729, 68-73.

[13] Minobe S et al. (2025) “Global and regional drivers for exceptional climate extremes in 2023-2024: beyond the new normal” Clim Atmos Sci, 8, 138.

[14] 10 New Insights in Climate Science.

[15] New Scientist (2024) “Part of the Atlantic is cooling at record speed and nobody knows why“.

[16] Neukom R et al. (2014) “Inter-hemispheric temperature variability over the past millennium” Nature Clim Change, 4, 362–367.

[17] Brohan P (2012) “Constraining the temperature history of the past millennium using early instrumental observations” Clim. Past, 8, 1551–1563.

[18] APARC (2025) “Hunga Eruption Atmospheric Impacts Report” APARC Report No. 11, WCRP Report No. 10/2025.

[19] Fajber R et al. (2023) “Atmospheric heat transport is governed by meridional gradients in surface evaporation in modern-day earth-like climates” PNAS, 120, 25, e2217202120.

[20] Yu L (2007) “Global Variations in Oceanic Evaporation (1958–2005): The Role of the Changing Wind Speed” J Climate, 20, 21, 5376–5390.

[21] Vinós J (2025) https://x.com/JVinos_Climate/status/1941827393368281431

Junk Temperature Measuring Network Means the Met Office Cannot Prove There’s Been a “Dramatic Increase” in Temperature

Earlier this month, the Met Office claimed that climate change was causing a “dramatic increase in the frequency of temperature extremes and number of temperature records in the U.K.”. Given what we now know from recent freedom of information (FOI) revelations about the state of its ‘junk’ nationwide temperature measuring network, it is difficult to see how the Met Office can publish such a statement and keep a straight face.

From The Daily Sceptic

By Chris Morrison

Earlier this month, the Met Office claimed that climate change was causing a “dramatic increase in the frequency of temperature extremes and number of temperature records in the U.K.”. Given what we now know from recent freedom of information (FOI) revelations about the state of its ‘junk’ nationwide temperature measuring network, it is difficult to see how the Met Office can publish such a statement and keep a straight face.

The claims were the headline findings in the operation’s latest state of the U.K. climate report and are said to be based on “observations from the U.K.’s network of weather stations, using data extending back to the 19th Century to provide long term context”. That would be the network where nearly eight out of 10 stations are deemed by the World Meteorological Organisation (WMO) to have ‘uncertainties’ – i.e., potential errors – between 2-5°C. The same junk stations that provide ‘record’ daily temperatures often in the same places, such as the urban heat furnace that is Heathrow airport. The same junk measurements that the Met Office uses to claim collated measurements down to one hundredth of a degree centigrade.

The WMO rates weather stations by the degree of nearby unnatural or natural temperature corruption. Classes 4 and 5 have possible corruptions of 2°C and 5°C respectively and these account for the vast majority of the Met Office sites. The WMO suggests that Class 5 should not be used to provide an accurate measurement of nearby air temperatures, yet nearly a third of the Met Office sites are classified in this super-junk category. Only classes 1 and 2 have no uncertainties attached and only these should be used for serious scientific observational work. But, inexplicably, the Met Office has very few such uncorrupted sites. Even more worryingly, it seems to show no sign of significantly increasing the paltry number of pristine sites.

Human-caused and urban heat encroachment are the problems, with extreme cases found at airports, which can add many degrees of warming to the overall record. But this has been known for some time, and it is a mystery why the Met Office has not done anything about it. Recent FOI disclosures reveal that over eight in 10 of the 113 stations opened in the last 30 years are in junk classes 4 and 5. Worse, 81% of stations started in the last 10 years are junk, as are eight of the 13 new sites in the last five years.

It’s almost as if the Met Office is actively seeking higher readings to feed into its constant catastrophisation of weather in the interests of Net Zero promotion. Whatever the reason – incompetence or political messaging – serious science would appear to be the loser. As currently set up, the Met Office network is incapable of providing a realistic guide to natural air temperatures across the U.K. Using the data to help calculate global temperatures is equally problematic.

Of course, the Met Office can rely on its helpful messengers in the mainstream media not to breath a word about this growing scientific scandal. The central plank of Net Zero fear-mongering is rising temperatures and claims that ‘extreme’ weather is increasing as a result. Temperatures have risen a bit over the last 200 years since the lifting of the mini ice age, the clue to the pleasant bounce being obvious to all. But this is not enough to force the insanity of Net Zero on humanity, so fanciful climate models and bloated temperature databases are also required. The compliant media are uninterested, but the cynicism and outright derision over the Met Office’s temperature antics are growing. The Met Office regularly posts on X and it cannot be unaware that a growing number of replies are less than complimentary. Last week, it announced the “warmest day of the year” based on measurements taken at Heathrow. The following are a few of the more polite comments it received:

What is it about LHR that could make it hotter than surrounding areas? I will give you a clue – concrete and hot jet exhausts maybe?

Real temperatures should be taken out in the open away from London.

…manipulating temperatures to fit the climate agenda.

Might as well measure inside an oven.

It’s all made up to fit your agenda.

I have a brighter red highlight in my fonts that I can lend you if you think the one you choose does not does not push the propaganda enough!

Remind us where you were taking temperature recordings in the last century, because it wasn’t on the roasting tarmac of airports.

Urban heat islands should not count and you know it but the grift continues.

In its recent annual report, the Met Office claimed that “our new analysis of these observations really shines a light on the fastest changing aspects of our weather as a consequence of climate change”. It is not just temperature data that is brought to the Net Zero table, but rainfall as well. The indefatigable investigative journalist Paul Homewood took a look at how the Met Office spun precipitation in a recent article in the Daily Sceptic. He agreed with the Met Office’s claim that rainfall has risen since 1961, but asked why that year was chosen to start the timeline. The graph below shows why.

England and Wales are rainy countries, but their island position in the North Atlantic leads to regular seasonal, yearly and longer-term decadal variations. The year 1961 fell within a drier interlude, and current totals are similar to those around the 1930s, 1880s and 1780s.

Helped by the widespread availability of satellite images and measurements, the Met Office does an excellent job in forecasting short-term weather and is of great benefit to shipping, the military, agriculture and the general population. But the state body funded by over £100 million a year is clearly riddled with green activists who, on the evidence that a number of sceptical journalists have presented, are using unreliable figures, carefully-curated statistics and inaccurate measurements to promote their own attachment to the insanity of hydrocarbon elimination.

Chris Morrison is the Daily Sceptic’s Environment Editor

Collapsing El Niño Spells End to Year-Long Bout of Climate Hysteria

To be serious, the current strong and natural El Niño event is starting to dramatically collapse with critical ocean temperatures in the central tropical Pacific ocean falling from 2.1°C above normal in late November to 1.3°C. The collapse in temperatures is even more dramatic at the sub-surface 300 metre level. In the western tropical Pacific, the temperature has plummeted by nearly 1.5°C, and the water is now cooler than normal.

BY CHRIS MORRISON

From The Daily Sceptic

Lawks-a-mercy, the oceans have stopped boiling. Cancel the slots on cable news for rising media stars and noted climate hysterics Jim Dale and Donnachadh McCarthy, and loosen the protective clothing for the unhinged UN Secretary-General Antonio ‘Boiling’ Guterres.

To be serious, the current strong and natural El Niño event is starting to dramatically collapse with critical ocean temperatures in the central tropical Pacific ocean falling from 2.1°C above normal in late November to 1.3°C. The collapse in temperatures is even more dramatic at the sub-surface 300 metre level. In the western tropical Pacific, the temperature has plummeted by nearly 1.5°C, and the water is now cooler than normal.

Apart from damaging a few budding media careers, what does this mean? 

El Niño is a natural transfer of heat between the oceans and the atmosphere that starts in the Pacific regions.

The effects of an El Niño are far from completely understood but they are essentially large heat transfers from the tropics to the northern hemisphere. We have experienced three strong El Niños in the last 25 years – 1998, 2016 and 2023 – and in each case they have disrupted weather patterns around the world. This leads to sudden spikes in ocean temperatures and unusual weather events. Over the last year, these events have been ruthlessly catastrophised by activist scientists, politicians and journalists seeking to nudge citizens to accept the collectivist Net Zero agenda.

One of the main indicators of the progress of El Niño, and its related La Niña oscillation, is the temperature of the water at the surface and near surface. The graph below shows the very rapid recent drop in the sub-surface temperatures for the western tropical Pacific down to much cooler levels.

Atmospheric scientist Professor Cliff Mass of Washington University observes that the entire character of the northern winter has been characterised by a strong El Niño. He notes that in America the impacts have included low snowpack over Washington State, huge snowpack and heavy rain over California and warm temperatures over the Upper Plains States.

Of course, similar unusual weather patterns have been recorded over many parts of the planet, along with the ubiquitous pseudoscientific claim that the climate is collapsing and it is all the fault of humans and their wicked ways.

The El Niño effects were largely behind the reports that last year was the hottest 12 months in at least 125,000 years. This was despite scientific evidence pointing to periods of much higher past temperatures, notably between 10,000 to 5,000 years ago when ice disappeared across vast swathes of the northern hemisphere.

In fact it transpired that last year’s hottest ever claim in the modern era did not apply to large areas of the world including Asia, Europe, North America, Oceania, East N. Pacific, Hawaiian region, Arctic and Antarctica.

Investigative science writer Larry Hamlin consulted the figures published by the U.S. weather service NOAA and found that the much hyped hottest ever averaged temperature anomaly did not apply to 58% of the Earth’s land surface where 73% of the world’s population live.

Apart from the rapidly cooling oceans, there is more bad news for alarmists since it appears a La Niña cooling oscillation could be on its way by the middle of the year. There is an historical tendency for a strong El Niño to be followed by La Niña.

For global heating enthusiasts the news could hardly be worse. The strong El Niño in 1998 was followed by a temperature pause that lasted 13-14 years, while the 2016 event ushered in a near nine year hiatus. Indeed without the El Niño boosts, it appears that global temperatures have barely risen over the last 25 years, and have certainly plateaued from the lively two-decade spike at the end of the 20th century.

As regular readers will recall, the Met Office abolished the 2000-2014 pause by adding a retrospective 30% extra heating to its HadCRUT global database. Last month the Daily Sceptic obtained a list of the Met Office’s 380 U.K. temperature recording stations, together with a note of their class rating from the World Meteorological Office. It was found that potential heat corruptions in almost a third of the stations meant there were ‘uncertainties’ of recording up to 5°C. Another 48.7% of the stations came with uncertainties of up to 2°C. The global temperature has been measured accurately by satellites since 1979 and a monthly update is published on the blog of compiler Dr. Roy Spencer of the University of Alabama in Huntsville. The UAH record has accurately represented the El Niño-induced heat over the last year, and has even been mentioned in the mainstream media. Alas, it also shows the two 21st century pauses and this appears to have been its undoing. Dr. Spencer’s temperature blog page was banned in 2022 by Google AdSense on the grounds of “unreliable and harmful claims”.

Chris Morrison is the Daily Sceptic’s Environment Editor.

Met Office Must Account for the ‘Junk’ Temperature Data Propping up Net Zero Insanity

Pressure is likely to grow in the coming days for the U.K. Met Office to make a full public statement about the state of its nationwide temperature measuring stations.

From The Daily Sceptic

BY CHRIS MORRISON

Pressure is likely to grow in the coming days for the U.K. Met Office to make a full public statement about the state of its nationwide temperature measuring stations. This follows sensational revelations in last Friday’s Daily Sceptic that nearly eight out of ten sites had huge scientifically-designated ‘uncertainties’ that essentially disqualified them from providing the accurate data required to promote the collectivist Net Zero agenda. Our report went viral on social media with over 1,300 retweets on X, and it was reposted on a number of sites. The investigative journalist Paul Homewood has covered the Met Office’s temperature claims for many years, and in the light of the new disclosures he noted that if it wanted to continue to use its existing station measurements, it should show a warning that the margin of error is so great “that they have no statistical significance at all”.

Specifically, nearly one in three (29.2%) Met Office sites are rated by the World Meteorological Organisation (WMO) as CIMO Class 5, and this comes with a warning of “estimated uncertainties added by siting of 5C°”. Class 5 can be termed a ‘junk’ rating since the WMO gives no guidance on where it can be located. The next to junk Class 4 comes with uncertainties of 2C°, while Class 3 has a 1C° warning. From information disclosed under a Freedom of Information request, the Daily Sceptic compiled the graph below that shows Class 4 accounted for 48.7% of the Met Office’s 380 recording stations. Only 13.7%, or 52 stations are free of ‘uncertainties’ warnings.

Net Zero promotion requires reasonably precise measurements of both local and global temperatures and these are simply not available. In the run-up to last year’s COP28 meeting, the BBC ran an explanatory article on the significance of the 1.5C° threshold, a rise of the Earth’s temperature based on the ending of the Little Ice Age. “Every tenth of a degree of warming matters, but as you get warmer each increment matters more”, said Myles Allen, Professor of Geosystem Science at the University of Oxford, and a co-ordinating author of the IPCC’s special report on 1.5C° in 2018. It is difficult to see how precision down to 0.1C° can be achieved by consulting current Met Office data, let alone the ability to claim to two decimal points, as the Met Office did, that last year in the U.K. was only 0.06C° cooler than the all-time annual record.

Comments on social media following the Daily Sceptic publication were often damning. On Homewood’s site, ‘YorksChris’ observed, “wow, this is horrendous… some of the locations of the so-called professional stations simply amaze me!”, while ‘magasox’ commented that this was huge, adding, “sceptics should shout it from the rooftops at every opportunity”. Heads, he felt, should roll, “but of course they won’t”. On the Daily Sceptic blog, ‘For a fist full of roubles’ looked forward to mainstream media latching on to this, “and revealing how the powers that be deliberately mislead us”. On the U.S.-based Watts Up With That? site over 300 posts greeted the news, with ‘UK-Weather-Lass’ stating: “It’s about time there was a public inquiry into how rotten and unfit for purpose the Met Office is, and why it is allowed to continue to be so.”

The problems with the Met Office data are mainly caused by increasing urbanisation which has encroached on the space around stations and corrupted measurements with artificial heat. Similar problems have been identified around the world leading to ever-increasing doubts about the accuracy of frequently quoted ‘global’ temperatures. Scientists estimate that heat corruption is likely to be responsible for up to 30% of warming claimed by the meteorological databases. The Met Office adds its figures to global compilations but the increasingly politicised state-funded operation also uses its data to declare almost constant temperature ‘records’. The Daily Sceptic has investigated the heat records declared since 2000 and found that all bar two should be disqualified. Many of them have been set in ‘junk’ Class 5 and most of the rest in Class 4.

Class 5 records include the highest daily maximum temperature in Northern Ireland, declared in 2021 at Castlederg. The highest January monthly temperature was set this year at Achfary and this Class 5 site also holds the record set in December 2019. Three U.K. area records were also set at Class 5 sites including England NW, East Anglia and England SE and Central S. The latter record was provided by St. James’s Park, which was one of five sites that was said to top 40C° on July 19th, 2022. This particular event was lauded at the time by the Met Office as a “milestone in climate history”. Another one of the 40C° sites, Northolt airport, is also Class 5.

According to the WMO, a Class 5 site is one where nearby obstacles “create an inappropriate environment for a meteorological measurement that is intended to be representative of a wide area”. According to a previous FOI request from Paul Homewood, the Met Office noted that Class 5 data, “will be flagged and not quoted in national records”. This does not appear to happen. On July 25th, 2019, the site at the Cambridge Botanic Gardens was credited with an new U.K. temperature record of 38.7C°. The Cambridge Botanic Gardens is a Class 5 site, and it still holds the July record for the region of East Anglia. All these records should be removed, or at least flagged with the large uncertainties set down by the WMO.

Ditto ‘near junk’ Class 4, where the crowd of record holders is higher. Class 4 sites include Charterhall where the highest Scottish temperature was set in 2022, and Hawarden Airport, home to the highest Welsh recording. A monthly U.K. record for August was set in 2003 at Faversham, while no less than five U.K. areas have records attributed to this class that comes with a WMO ‘uncertainty’ of 2C°. The all-time British record was set on July 19th, 2022 at a Class 3 site, which comes with WMO uncertainty of 1C°. Set halfway down the runway at RAF Coningsby, the record stood for just 60 seconds at 3:12pm, and was preceded by a rise and fall of 0.6C° either side of the event. A previous FOI from the Daily Sceptic disclosed that three typhoon fighter jets were landing on the runway at or around the time the record was set. All of these records should also be ditched as well, or given appropriate warnings.

So far as can be seen, no Met Office heat record has been set since 2000 at pristine Class 1 sites, which might not surprise given there are only 24 of them. Only two – the highest U.K. February temperature at 21.2C° and November at 22.4C° – have been set at near pristine Class 2 locations.

Most propagandising for Net Zero revolves around higher temperatures, and without this ammunition the project will quickly wither. It explains why these so-called ‘records’ are rarely out of the mainstream media headlines. The high temperature readings are weaponised at the national level, but local media is also targeted. This can be shown by considering the photograph below from Google Earth.

This is the site of the Sheffield temperature station. On July 19th, 2022, the local Star newspaper reported that the city had smashed the temperature record with over 39C° for the first time. According to the Met Office, the newspaper reported, the record reached 39.4C° on July 18th. The red marker shows where the Sheffield readings are taken, hard by a busy road with a large bus lane, surrounded by either city buildings or heavy vegetation, and located at or near what appears to be a concrete park. It might not surprise to learn that Sheffield is a Class 5 site.

The Met Office’s Chief Scientist and leading Net Zero promoter Professor Stephen Belcher states that “in a climate unaffected by human influence, climate modelling shows that it is virtually impossible for temperatures in the U.K. to reach 40C°”. It is not thought he was referring to the influence of typhoon jets or the 95 bus.

Chris Morrison is the Daily Sceptic’s Environment Editor

A Year of Climate Alarmism: Sliced, Diced, and Factually Impaled

In this new episode #92 of “Climate Change Roundtable,” guest host Anthony Watts leads a thought-provoking discussion with Heartland experts H. Sterling Burnett and Linnea Lueken.

The Heartland Institute

In this new episode #92 of “Climate Change Roundtable,” guest host Anthony Watts leads a thought-provoking discussion with Heartland experts H. Sterling Burnett and Linnea Lueken.

This past year has been an unrelenting one in terms of climate alarmism, yet when you look at what has actually happened compared to what was predicted, there’s a wide gap between the hype and reality. From wildfires to record temperatures, when you examine the data, it isn’t alarming at all.

Plus, we’ll touch on the failures of Net-Zero and wind power, both of which took big hits this year.

And, like always, we’ll have Crazy Climate News of the week.

Join us at Noon Central Time (1 PM ET). Whether you’re a climate enthusiast, a policy expert, or just someone curious about the different facets of climate change discourse, this episode will enlighten you.

Response To Roger Harrabin

Roger Harrabin’s defence of the BBC’s coverage of climate change highlights everything that is wrong with it.

3D illustration of tornado or hurricane’s destruction along its path toward fictitious city with flying debris and collapsing structures. Concept of natural disasters, judgment day, apocalypse.

From NOT A LOT OF PEOPLE KNOW THAT

By Paul Homewood

The Telegraph have published this letter from Roger Harrabin:

I have submitted this to the Telegraph in reply:

Dear Sir

Roger Harrabin’s defence of the BBC’s coverage of climate change highlights everything that is wrong with it. (Letters – 14th August).

He makes claims about wildfires, but omits to mention that they have been declining worldwide in recent years. He talks of record temperatures in America, but forgets to mention that the vast majority of US State records were set before the 1940s.

He talks of catastrophic floods, but offers no evidence that these are anything out of the ordinary. As for the loss of Antarctic sea ice, which so concerns him, he does not mention that it was at a record high extent as recently as 2014.

In contrast to the BBC’s apocalyptic view of climate change, the IPCC regularly finds no evidence that floods, droughts or hurricanes are getting worse.

Meanwhile all of the scare stories promoted by the BBC over the years, such as an ice free Arctic and catastrophic sea level rise, have failed to materialise.

For years the BBC has exaggerated the threat of climate change, failed to report evidence to the contrary and used every bit of bad weather as evidence without ever providing the full context.

Melting Ice Caps and World on Fire vs The Reality

Any actor knows that the time to leave the stage is when the audience starts to laugh at him. With the latest ‘World on Fire’ show collapsing under the weight of fake statistics, crystal ball attributions, scientific deceptions, made-up estimates and Justin Rowlatt airlifted into heat-torn Alicante, it is surely time to pull down the curtain on this increasingly ridiculous show.

From The Daily Sceptic

By CHRIS MORRISON

Any actor knows that the time to leave the stage is when the audience starts to laugh at him. With the latest ‘World on Fire’ show collapsing under the weight of fake statistics, crystal ball attributions, scientific deceptions, made-up estimates and Justin Rowlatt airlifted into heat-torn Alicante, it is surely time to pull down the curtain on this increasingly ridiculous show. When the audience sides start to split as the weather maps turn ‘Cerberus’ black, and heat records soar halfway up the tailpipes of Typhoon jets, it is perhaps dawning on the eco-extremists that they need to lift their game. As last week’s U.K. by-election in Uxbridge showed, a few electoral shifts might be all that is needed to wipe out their vision of a collectivist, all-controlling Net Zero Hades.

Running through all the hysterical reporting has been the outrageous use of fake estimates and statistics. Mainstream media were full of reports last week that temperatures would hit 48°C in southern Europe, a steer that seems to have come from the European Space Agency (ESA). It said that many countries were facing a major heatwave including Germany and Poland, while air temperatures were expected to climb to 48°C in Sicily and Sardinia – “potentially the hottest temperature ever recorded in Europe”. The temperature in Sicily never went above 35°C, according to the Time and Date website that reports past weather from around the world.

But it turns out the ESA was pulling a fast one. It was not referring to  the ‘air’ temperature, the standard measurement made two metres above the ground, but the actual temperature on the surface. This latter measurement of course is going to be many degrees higher. The climate science site No Tricks Zone noted: “By the time the ploy was exposed by careful readers, the news had already gone around the world.” Commenting on the affair, German’s Achtung Reichelt is reported to have called it “the most intense climate lie since temperature recording began”. Calling the ESA’s press release “sloppy and manipulative”, it charged that none of it was true.

The climate narrative is now all about individual ‘extreme’ weather, to the despair of many scientists who note climate change is a measurement of long-term trends. But long-term temperature trends do not tell the correct political story since little global warming has been evident for over two decades.

Meanwhile, Arctic surface sea ice waxes and wanes on a decadal basis, but the recent general recovery has been quietly dropped from the Net Zero-inspired narrative. While Europe and the United States explode with fire and brimstone heat, and the fish are sous-vide in the boiling oceans, sea ice in the Arctic continues with what appears to be a small cyclical recovery. According to the U.S.-based National Snow and Ice Data Centre (NSIDC), the latest summer daily melt was similar to the  1981-2010 average. At July 17th, the ice extent was the 12th lowest in the 44-year satellite record.

The climate investigator Tony Heller recently lifted the lid on the deceptions surrounding Arctic sea ice. “They bury all the older data [pre-1979] and pretend they don’t notice sea ice is increasing again,” he charged. A linear decrease in the end-summer ice extent since 1979 is widely promoted, but Heller points out the minimum is actually higher now than 10 and 15 years ago. Plotting the trend as a moving average shows that the decline in summer sea ice stopped a decade ago.

The Australian climate journalist Jo Nova recently referred to lies that were told by omission, suggesting that the whole climate movement was built on this “active deception”. Last year’s big omission was coral reefs, that have shown spectacular growth on the Great Barrier Reef of late. This year’s missing scare story is the Greenland ice sheet, where a significant, unreported recovery is in progress.

Almost halfway through the short summer, the accumulation of surface ice on Greenland is more than the 1981-2010 average and a big improvement on a decade ago. But the current improvement could be seen in a much better light. Why are the Danish Polar Portal compilers of the below graph using a 1981-2010 average, when data can be included up to 2020? The NSIDC uses a similar average comparison in its Arctic ice graphs. The Greenland ice sheet lost 51 gigatonnes a year in the 1980s and 1990s and 166gts in the 2000s. In the 2010s the loss was around 244gts, a fivefold increase since the 1980s. Obviously if a 1990-2020 average was shown – with a 50gts loss replaced by one of 244gts – it would amplify the recent recovery by raising the baseline. Last year, the Greenland ice sheet was reported to have lost just 50gts, an amount well within a margin of error that could suggest a small actual increase in the overall size.

When dealing with any statistics regarding climate change these days, it is good advice to start counting the spoons. It has always been an irritation to extremists that up to 10 times more people die of the cold than the heat. Greenpeace founder Dr. Patrick Moore recently displayed how the Lancet medical journal tried to come to the rescue, with the graph pictured on the left below.

To even up the score, with blue for cold and red for heat, the Lancet used an unequal y-axis – a technique so obviously misleading it is hard to understand how anyone could even think of using it. The graph on the right was produced by the Danish economist Bjørn Lomborg, and it corrects the distorted Lancet image. Dr. Moore tweeted: “This is disgraceful for a supposedly scientific journal.”

It seems that the biggest risk of dying in the current British summer – 19°C and showery at time of writing – is to die laughing.

Chris Morrison is the Daily Sceptic’s Environment Editor.

India’s Heatwave A Year On.

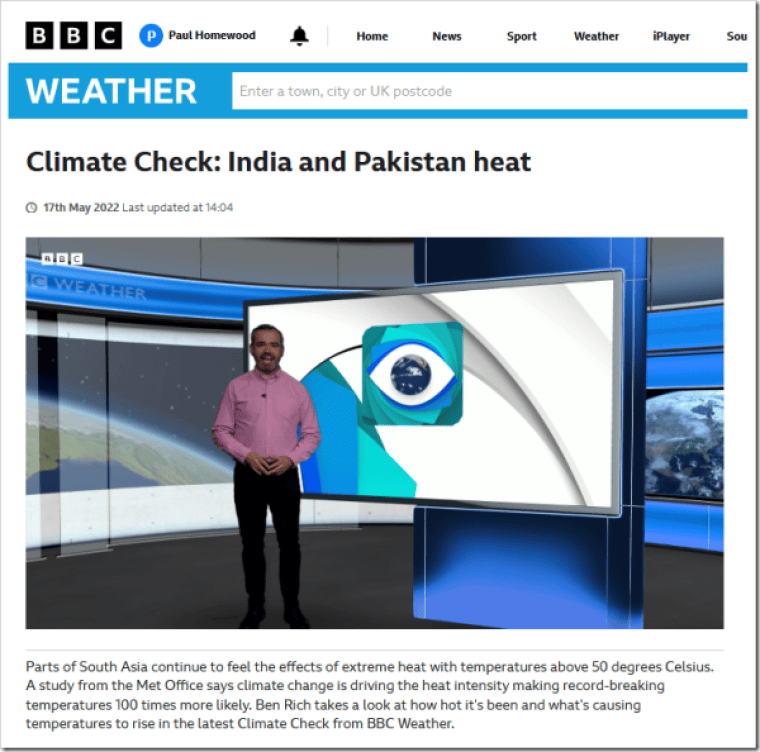
You will recall a heatwave in spring last year in India, with BBC claims of record temperatures in Delhi and Met Office claims that climate change is making such events 100 times more likely.

From NOT A LOT OF PEOPLE KNOW THAT

By Paul Homewood

https://www.bbc.co.uk/weather/av/61483012

You will recall a heatwave in spring last year in India, with BBC claims of record temperatures in Delhi and Met Office claims that climate change is making such events 100 times more likely.

I debunked it at the time, here, here and here.

Now of course we have the full data for spring for last year, and this year too.

Below are the spring mean temperatures at Safdarjan Airport, in New Delhi, which has long running, high quality, is relatively unaffected by UHI, and is listed by the India Met Office as one of their Base Stations:

https://data.giss.nasa.gov/tmp/gistemp/STATIONS/tmp_IN022021900_14_0_1/station.txt

It was certainly how last spring, but not as hot as 1941 and 1943, and this year’s temperatures were actually below average. There is clearly no trend towards hotter springs there.

Fake Analysis by Greg Ayers and Jane Warne – Because End Justifies Means

Instead of journalists Graham Readfearn from the Guardian accusing me of harassment, and more recently Kate Tran from the AFP undertaking a very fake ‘fact check’, someone should actually check my facts.

From Jennifer Marohasy

May 14, 2023 By jennifer

I estimate the Bureau have about 200,000 parallel temperature records. These are handwritten records of temperatures measured at the same place and the same time from a traditional mercury thermometer and the newer resistance probes. I have been very critical of the Bureau for not making this data public, so we can see the extent to which the measurements match. The A8 reports (with both measurements) were the focus of a Freedom of Information request by John Abbot, in which the Bureau initially claimed the reports did not exist, to eventually releasing 1,094 with Brisbane Airport data, representing just three years of the 15 years of data that the Bureau holds for this site. And that was only after Abbot took the Bureau to the Administrative Appeals Tribunal.

Noble cause corruption is a term invented by the police to justify fitting up people they believe to be guilty, but for whom they can’t muster forensic evidence that would satisfy a jury. It is a crime, but it is very difficult to get a conviction when the person on trial is a police officer.

It is like this with the Australian Bureau of Meteorology. They have several methods that falsely suggest catastrophic global warming, but no one seems to want to undertake any sort of investigation.

It is not as though this is without consequence, given the high level of public interest in record temperatures as well as the significant financial stakes involved.

Contrast this with the fisherman who was recently convicted of stuffing fish with lead weights to win thousands of dollars in a fishing tournament. He was arrested by the police, convicted, lost his license and his boat worth US$100,000. He may go to jail.

A week ago, The Guardian reported on the fake experiment by Greg Ayers and Jane Warne published in Journal of Southern Hemisphere Earth Systems Science – except Readfearn didn’t call it fake.

Graham Readfearn writing in The Guardian claimed it as a direct comparison between the Bureau’s method for recording daily maximum temperatures and the method recommended by the World Meteorological Organisation. But the values listed in Table 1 as the maximum temperature for Darwin are not the same values the Bureau has recorded for Darwin.

I call the experiment fake because it is an imitation. It confounds datasets – if not deliberately then, why? I have previously written to Jane Warne about this, but she does not reply.

Instead of listing the highest of the one-second readings taken each day, in Table 1, Ayer and Warner have fudged, and listed the highest of the last one-second spot readings for each minute for that day. The difference is significant, in the case of 6th April 2018 at Darwin – their first listed measurement – is out by a whole one degree Celsius!

In fact, it rather makes my point, that the Bureau’s custom-designed resistant probes are all over the shop.

This is one way of describing the three years of recordings from the probes compared to the mercury for Brisbane Airport. My analysis of the limited data that Abbot was able to secure for Brisbane Airport shows the probe read higher than the mercury 41% of the time, and sometimes by up to 0.7 degrees Celsius. The difference is statistically significant and not randomly distributed. It will produce more record hot days for the same weather.

That the Ayers and Warne paper claims to represent the Bureau’s method but does not is a point of fact easily checked.

Compare the very first value listed as the maximum temperature for Darwin, for the 6th April 2018 in the Bureau’s ADAM data base (click here), with the value listed in Ayer and Warner (click here).

This difference illustrates the point that I have been making for some years: by taking the highest spot reading, and not averaging, the Bureau is over estimating maximum temperatures and by some significant amount. In this case one whole degree Celsius.

This, combined with setting a cold limit, something that I have also written about (click here), means that university researchers relying on Bureau data have been able to falsely claim that ‘record hot days are now 12 times more likely in Australia than days of record-breaking cold’. So wrote Peter Hannam from the Sydney Morning Herald quoting Sophie Lewis and Andrew King from the ARC Centre of Excellence for Climate System Science. This fits the human-caused global warming narrative that is a reliable source of funding for academics, catastrophe stories for mainstream media, and government subsidies that prop-up renewable energy industries.

It is an absolute travesty.

Instead of journalists Graham Readfearn from the Guardian accusing me of harassment, and more recently Kate Tran from the AFP undertaking a very fake ‘fact check’, someone should actually check my facts. My facts are the only ones that will withstand scrutiny. Of course, The Australian Broadcasting Corporation has jumped on Readfearn’s bandwagon but not a single ABC journalists will put their name to the slander that also accuses me of being a conspiracy theorist.

In particular, Ayers and Warner can not compare the last second in each minute with the readings from the mercury thermometer and claim their analysis to be a test of the Bureau’s method, because the Bureau log the highest one-second reading in each minute as the daily maximum. The much cited Ayers and Warner peer-reviewed study is classic ‘bait and switch’.

To understand more about how science and public policy have been corrupted by the noble cause of environmentalism, consider reading an important book by Ansley Kellow published in 2007 by Edward Elgar, click here.

The handwritten temperatures from a probe and also mercury as recorded on 14th October 2020 at Brisbane Airport showing a difference of 0.7C, with the probe recording warmer.

I will continue this story as part of a series I’m calling ‘Jokers, Off-Topic Reviews and Drinking from the Alcohol Thermometer’. I have this post as Part 5. To read some of my previous scribbles:

The Guardian, Temperatures, Misinformation (Part 1) – sets up the query and anticipation.

The Coronation & The Guardian, Temperatures, Misinformation (Part 2) – more information in an expanded context that is global.

Jokers, and Temperature as Radio Chatter, Part 3 – airports in focus.

Joker, Killing Dissent While Calling it Debate, Part 4 – politics in focus.

And before I got to this fake comparison, my good friend Ken Stewart posted something very relevant here: Who’s Laughing Now – malfeasance by omission.
Who’s Laughing Now?

John Abbot and me outside the Administrative Appeals Tribunal on 3rd February 2023.