When Winter Bites Back: What Real Data Says About Climate Hype

The recent harsh winter weather across much of North America (especially the eastern and central U.S. and Canada) in late January through mid-February 2026 has brought record cold, heavy snow, ice storms, and dangerous wind chills.

The recent harsh winter weather across much of North America (especially the eastern and central U.S. and Canada) in late January through mid-February 2026 has brought record cold, heavy snow, ice storms, and dangerous wind chills.

Fernando del Pino Calvo- Sotelo’s article “Cold, rain, snow: climate change?” (originally published in Spanish as “Frío, lluvia, nieve: ¿cambio climático?” on February 9, 2026, on his blog fpcs.es) directly tackles the very question: what do episodes of cold, rain, and snow actually reveal about climate change claims?

_________________________________________________________________________________________________________

From Independence, Freedom and Truth

By Fernando del Pino Calvo Sotelo

Climate propagandists are worried. Indeed, the preferred weather conditions for climate propaganda are heat and drought, and since the end of December we have had cold weather and huge amounts of rain. In fact, in mainland Spain, January has been the rainiest in the last 25 years, and many reservoirs have ended the month at 100% capacity. We have definitely left the drought behind, the beginning and end of which, incidentally, the Spanish Meteorological Agency (AEMET) was unable to predict.

We should learn three lessons from this fact. The first is the unreliability of weather forecasts beyond a time horizon of a few days. A well-kept secret is that science is still in its infancy in its understanding of the climate, a nonlinear, complex, and chaotic system. Therefore, meteorologists have no way of knowing with any degree of certainty what will happen this coming spring, or next year, let alone in 2100. They operate in an environment of enormous uncertainty and base their seasonal forecasts on factors that are only partially explanatory, such as ENSO.

Once again, the AEMET

Hence the probabilistic approximations obtained after laborious calculations—that is, by eye—such as that made by the AEMET when it predicted that there was a 60% chance of a warmer-than-normal winter. Such prediction has earned much criticism, tempered by the fierce defense of the Agency systematically carried out by fact-checkers and the left-wing media (almost all), not surprisingly, since AEMET is the main authority for promoting the climate agenda.

In reality, AEMET’s huge mistake lies in not having been able to predict the enormous volume of rainfall recorded in January. In fact, criticism of its temperature forecast distracts attention from this point and is also premature (and certainly naïf, since AEMET holds the monopoly in calculating Spain’s temperature). Indeed, the average temperature for the meteorological winter in Spain is 6.6ºC, so for it to be a “warmer than normal” winter, it would only need to be a few tenths of a degree above that temperature. If we accept that January temperatures were normal, as the AEMET seems to have suggested, for its winter prediction to be wrong February will have to be colder than normal (below the 40th percentile), which is statistically less likely than the opposite scenario. Hence, the Agency is relying on February’s temperature measurements to restore its reputation, or rather, on the statistical estimates that temperature calculations have become, since, following its recent methodological change, most of the data points do not come from direct thermometer measurements, but from interpolations on small grids using multiple regression models[1].

The second lesson we must remember is that the great climate threat that should concern us is the extreme cold typical of Ice Ages, not the milder temperatures caused by the slight warming we have fortunately been experiencing since the end of the Little Ice Age in the mid-19th century. Heat is synonymous with life, and cold is synonymous with death. That is why birds migrate to warmer areas in winter, and citizens of central and northern Europe come on vacation to Spain, and not the other way around.

The final lesson to be learned is that we must be on guard against the relentless, Soviet-style, climate propaganda bombardment. Indeed, if this early winter had been warm and dry instead of freezing and rainy, climate propaganda would have immediately blamed it on climate change. Well, it is just as ridiculous and unscientific to extrapolate a cold, rainy, and snowy month and link it to supposed global cooling as it is to link every heat wave, every drought, or every particularly warm season to global warming. Please remember this the next time climate activists—starting with the AEMET—turn mere local, temporary, and irrelevant weather phenomena into irrefutable evidence of global climate change.

Prophets of doom

For the prophets of climate doom, the bad news keeps piling up, as Bill Gates now claims that “although climate change will have serious consequences (…), people will be able to live and thrive in most places on Earth for the foreseeable future”[2]. After writing a book a few years ago with the alarming title How to Avoid a Climate Disaster, his change of tone (or opportunistic shift) has coincided with the erosion of apocalyptic projections—discredited time and again by observed data—and, above all, with the political change that has taken place in the US, a country that has decided to abandon, and therefore stop funding, all kinds of environmental organizations, including the UN’s IPCC[3].

We must be aware that effective climate propaganda blames climate change for all kinds of phenomena, even those of an opposite nature.

That is precisely why “global warming” came to be called “climate change,” a less restrictive concept that admits everything under its umbrella. This is why those who make a living from the climate narrative try to explain that global warming is to blame for the heat, but also for the cold; for torrential rain, but also for drought; for total calm, but also for gale-force winds. However, although atmospheric physics is sometimes counterintuitive, I trust that common sense tells you, dear reader, that it is usually difficult for the same factor to cause completely opposite results. If not, be careful the next time you put ice in your drink, lest it heat up, or take an antipyretic, lest it raise your fever instead of lowering it.

Contrary to what the propaganda claims, global warming has not yet caused any increase in climate instability or in the frequency or intensity of extreme weather events, as the IPCC itself acknowledges[4]. But let’s imagine for a moment that it did, as its propagandists claim: should we then conclude that global cooling would bring great climate stability? This does not seem to be the case. In fact, the Little Ice Age (13th-19th centuries) was a period of “great climatic instability” that led to severe grain crop failures and, consequently, famines[5]. On the contrary, increased CO2 and milder temperatures favor plant growth. Thus, cereal crop yields (measured in tons per cultivated hectare) have only grown in recent decades and are now double what they were 60 years ago, which is great news for feeding a growing world population[6]. Bless CO2.

Global drop in temperatures

January’s cold, rain, and snow have not been limited to Spain, but have been a global phenomenon in the northern hemisphere. Anecdotally, it is worth mentioning that on the night of Epiphany, 30 cm of snow fell on the beaches of the French Atlantic coast[7], that in the US the cold and snow storm at the end of January rivaled the record set the previous winter[8], and that on the Kamchatka Peninsula, in the far east of Russia, there was unprecedented snowfall[9].

But beyond the anecdotal nature of experiencing a cold, rainy, and snowy month, the fact is that global temperatures have been falling for two years, which means that the unusual peak observed in 2023-2025—clearly exogenous and circumstantial in nature, due to its extreme and sudden nature—is subsiding in a typical example of reversion to the mean. Do not forget that in 2023, 42% of the planet’s surface experienced temperatures two standard deviations above average. In this regard, the contrast between the countless news reports publicizing the sudden warming of those years and the deathly silence that has accompanied the subsequent cooling, just as sudden but not fitting into the official narrative, is quite telling.

As I wrote at the time, no serious scientist suggested the sudden rise in temperatures in 2023-2025 was due to anthropogenic forcing (unlike the AEMET). Some linked it to a strong El Niño phenomenon; others to a completely unexplained very low global cloud cover, as science still struggles with moist convection and therefore does not know the factors that control the planet’s cloudiness (how could climate models not fail?). Finally, other scientists pointed to the massive eruption of the Hunga-Tonga underwater volcano, which was one of the largest geological phenomena of the last century, releasing 150 Mt of water vapor, the most important greenhouse gas, into the atmosphere at once[10].

Therefore, it is possible that the recent and sudden cooling of the Earth has been associated with La Niña, a phenomenon which, like so many others, is impossible to predict in duration and intensity except with comfortable probability ranges that do not usually stray far from equiprobability (to protect the forecaster’s reputation). But it is also possible that the main factor explaining the recent cooling has been the gradual disappearance of the temporary greenhouse effect caused by the Hunga-Tonga eruption[11]. Who knows?

As you can see in the graph below, since 1979—a particularly cold year, but the first in which there were satellites in space to measure temperature—it is estimated that the average temperature of the planet has increased at an imperceptible rate of 0.15°C per decade (yes, 15 hundredths of a degree per decade)[12]. You will agree with me that it takes a lot of fine-tuning to detect this centesimal increase in the temperature of an entire planet:

You will also notice that the planet’s temperature barely increased in the period 1980-1995 and remained very constant from 1998 to 2015, approximately, despite the constant increase in atmospheric CO2 concentration. This latter episode was called “the hiatus”, although climate propaganda would later deny that such a term had ever been used. Really? In 2013, Nature magazine published an article entitled “The recent hiatus in global warming”[13], and the IPCC itself cited “the hiatus” 53 times in its Fifth Assessment Report (2013) and devoted a special chapter entitled “Climate models and the hiatus in global warming over the last 15 years”[14].

Long graphs

The above graph of satellite data is a very short graph, as climate change is usually measured in centuries or millennia. That is why I like to introduce the long graph that the IPCC included in its First Report, which shows the reconstruction of global temperatures over the last 10,000 and 1,000 years. In it, you can see that temperatures at the end of the 20th century were lower than or similar to those in the days when Fred Flintstone drove his log car, that is, when there was no industrialization or anthropogenic CO2[15]:

Good news

On the other hand, some of my Canadian friends who are concerned about climate change will have been reassured by the recent publication of their country’s summer temperature series since 1900, which shows a gentle cyclicality with no clear trend, equating temperatures at the beginning of the 21st century with those experienced 100 years ago, when CO2 levels were supposedly “normal” (according to climate propaganda nomenclature)[16]:

They will also be reassured to know that poor Greta’s tearful denunciation at the UN of a supposed mass extinction of species because of climate change was the result of hysteria rather than science. In fact, a recent study published by the Royal Society concludes that the rate of species extinction—irrelevant in any case from a relative point of view—has decreased over the last 100 years[17]. Yes, you read that right: there are fewer species extinctions, which means that the biosphere (the system that encompasses all living beings on the planet) is doing wonderfully well with slightly warmer temperatures and a little more CO2, a source of life and food par excellence for plants.

We also have reassuring data regarding rising sea levels. A study published in the Journal of Marine Science and Engineering has compared the increases predicted for 2020 by the IPCC for a multitude of coastal locations around the globe with the actual measurements obtained at those locations. Its conclusion is categorical: “Approximately 95% of locations show no statistically significant acceleration in the rate of sea level rise. Our research suggests that in the remaining 5% of locations, local non-climate phenomena are the plausible cause of accelerated sea level rise.” It concludes: “On average, the IPCC’s projected rate of rise is biased upward by approximately 2 mm per year compared to the observed rate”[18]. Given that the latest IPCC report projects a 4 mm/year increase until 2100 in its most plausible scenario, this means that its flawed models double the actual rise in sea levels. Don’t rush to sell your beach apartment.

Consensus or censorship?

Climate propaganda claims that there is almost complete consensus among the scientific community regarding the anthropogenic origin of global warming and the apocalyptic consequences attributed to it. This is patently false: what has happened is an asymmetrical media treatment of both sides of the debate and an aggressive communist or Orwellian-style censorship that has actively silenced the multitude of scientists who are skeptical and outraged by the political hijacking of science.

Such is the case of an editor of the American Journal of Economics and Sociology, who allowed the publication of an article that would soon become the second most read article in the publication’s 83-year history. The article criticized the IPCC’s alarmism, never corroborated by empirical evidence, that is, it dared to commit blasphemy against the prevailing dogma with commendable clarity. Well, the editor was fired[19]. Please read the conclusions of this article carefully:

“The IPCC claims that extreme weather events are now worse than in the past, but observations do not support this claim. Some extreme weather events, such as the land area affected by extreme droughts, are decreasing rather than increasing (Lomborg, 2020). Globally, the incidence of hurricanes shows no significant trend (IPCC, 2013, p. 216; Lomborg, 2020). Observations also show no increase in damage or danger to humanity today due to extreme weather or global warming (Crok and May, 2023, pp. 140-161; Scafetta, 2024). Therefore, given that the current climate is possibly better than the pre-industrial climate and that we have not observed any increase in mortality from extreme weather events, we conclude that we can plan for adaptation to any future changes. Until a danger is identified, there is no need to eliminate the use of fossil fuels”[20].

Amen.

[1] For a more detailed explanation: HEAT WAVES 2024 – Fernando del Pino Calvo-Sotelo
[2] A new approach for the world’s climate strategy | Bill Gates
[3] Withdrawing the United States from International Organizations, Conventions, and Treaties that Are Contrary to the Interests of the United States – The White House
[4] IPCC AR5, WG 1, Chapter 2.6, p.214-220 and IPCC AR6, WG 1, Chapter 12, p. 1770-1856
[5] A climate of conflict: How the little ice age sparked rebellions and revolutions across Europe – ScienceDirect
[6] Crop yields have increased dramatically in recent decades, but crops like maize would have improved more without climate change – Our World in Data
[7] Snowfall: the Atlantic coast under a white blanket, a rare event that calls for caution
[8] Dangerous winter storm, extreme cold on the way for large portion of U.S | National Oceanic and Atmospheric Administration
[9] Weather tracker: Record snowfall in eastern Russia leaves people stranded | Russia | The Guardian
[10] Failed predictions – Fernando del Pino Calvo-Sotelo
[11] The 2023 climate event revealed the greatest failure of climate science – Climate Etc.
[12] Latest Global Temps « Roy Spencer, PhD
[13] Recent global-warming hiatus tied to equatorial Pacific surface cooling | Nature
[14] IPCC, AR5, WG 1, p. 61.
[15] IPCC, AR1, The IPCC Scientific Assessment, fig. 7.1, p. 202.
[16] Canada Summer Daily High Temperature Trends, 1900-2023 « Roy Spencer, PhD
[17] Unpacking the extinction crisis: rates, patterns and causes of recent extinctions in plants and animals | Proceedings B | The Royal Society
[18] A Global Perspective on Local Sea Level Changes
[19] Orwellian Sacking of Editor for Allowing Debate Over Climate Change – The Daily Sceptic
[20] Carbon dioxide and a warming climate are not problems – May – 2025 – The American Journal of Economics and Sociology – Wiley Online Library

NOAA Criteria Suggest Full-Fledged La Niña Unlikely in 2024 – Even A Single La Niña Threshold Unlikely During the Indian Southwest Monsoon

Concluding from the above analysis, Enso Neutral conditions will prevail for JJA2024 and at the end of August, since only four months will be left in the current year 2024 full-fledged La Nina cannot be established, even if La Nina thresh hold is achieved in any of the four months remaining.

From Watts Up With That?

From Gujarart Weather

Ashok Patel

NOAA Criteria Suggest Full-Fledged La Niña Unlikely in 2024 – Even A Single La Niña Threshold Unlikely During the Indian Southwest Monsoon

Enso Status on 8th August 2024

Ashok Patel’s Analysis & Commentary :

ONI Data has been obtained from CPC – NWS – NOAA available here
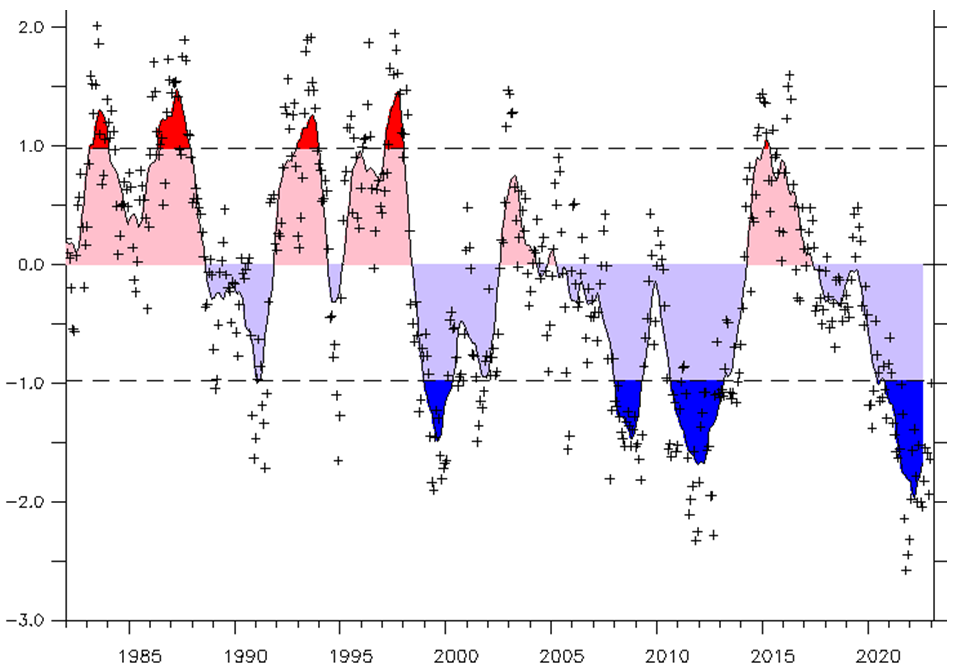
The current data indicates that the Second ENSO Neutral thresh hold has been established at the end of July 2024, thereby Enso Neutral conditions continues. The ONI has dropped to +0.2°C for MJJ2024 season. Nino3.4 SST for June 2024 is 0.18°C and for July 2024 is 0.10°C and so for ONI of JJA2024, the combined total of three months Nino3.4 SST for June, July & August 2024 should at least go down to -1.36°C, so as to get ONI for JJA2024 as -0.5°C by rounding to one decimal.

Since Nino3.4 SST for June is 0.18°C and July is 0.10°C, it would mean that the Nino3.4 SST for August should theoretically go down to -1.64°C, so that the three months total reaches -1.36°C to make JJA2024 ONI -0.5°C to achieve La Nina thresh hold. Observing the Weekly Nino3.4 data, it is highly unlikely that Nino3.4 SST for August 2024 can go down to -1.64°C. Hence, ENSO Neutral condition is expected to continue for JJA2024 season.

Concluding from the above analysis, Enso Neutral conditions will prevail for JJA2024 and at the end of August, since only four months will be left in the current year 2024 full-fledged La Nina cannot be established, even if La Nina thresh hold is achieved in any of the four months remaining.

First conclusion is that La Nina thresh hold will not be achieved during the Indian Southwest Monsoon and Second conclusion is that a Full Fledged La Nina will not materialize during 2024, using the NOAA criteria.

The second conclusion as discussed is that since a La Nina thresh hold for JJA 2024 is not going to be achieved, the earliest La Nina thresh hold if at all it can be achieved is JAS2024, which is when the Indian Summer Monsoon ends.

How ONI is determined:

The ONI is based on SST departures from average in the Niño 3.4 region, and is a principal measure for monitoring, assessing, and predicting ENSO. Defined as the three-month running-mean SST departures in the Niño 3.4 region. Departures are based on a set of further improved homogeneous historical SST analyses (Extended Reconstructed SST – ERSST.v5).

NOAA Operational Definitions for El Niño and La Niña, El Niño: characterized by a positive ONI greater than or equal to +0.5ºC. La Niña: characterized by a negative ONI less than or equal to -0.5ºC. By historical standards, to be classified as a full-fledged El Niño or La Niña episode, these thresholds must be exceeded for a period of at least 5 consecutive overlapping 3-month seasons.

CPC considers El Niño or La Niña conditions to occur when the monthly Niño3.4 OISST departures meet or exceed +/- 0.5ºC along with consistent atmospheric features. These anomalies must also be forecast to persist for 3 consecutive months.

The Climate Prediction Center (CPC) is a United States Federal Agency that is one of the NECP, which are a part of the NOAA

Latest Oceanic Nino Index Graph Shows Enso Neutral
Conditions Prevail  At The End Of July 2024

The Table below shows the monthly SST of Nino3.4 Region and the Climate adjusted normal SST and SST anomaly from February 2023. Climate Base 1991-2020. ERSST.v5

Period    Nino3.4  ClimAdjust 
YR     MON Temp.ºC  Temp.ºC ANOM ºC
2023   2   26.30    26.76    -0.46
2023   3   27.19    27.29    -0.11
2023   4   27.96    27.83     0.14
2023   5   28.40    27.94     0.46
2023   6   28.57    27.73     0.84
2023   7   28.31    27.29     1.02
2023   8   28.21    26.86     1.35
2023   9   28.32    26.72     1.60
2023  10   28.44    26.72     1.72
2023  11   28.72    26.70     2.02
2023  12   28.63    26.60     2.02
2024   1   28.37    26.55     1.82
2024   2   28.28    26.76     1.52
2024   3   28.42    27.29     1.12
2024   4   28.60    27.83     0.78
2024   5   28.17    27.94     0.24
2024   6   27.91    27.73     0.18
2024   7   27.39    27.29     0.10

Indications and analysis of various International Weather/Climate agencies monitoring Enso conditions is depicted hereunder:

Summary by: Climate Prediction Center / NCEP  Dated 8th August 2024

ENSO Alert System Status: La Niña Watch

Synopsis: ENSO-neutral is expected to continue for the next several months, with La Niña favored to emerge during September-November (66% chance) and persist through the Northern Hemisphere winter 2024-25 (74% chance during November-January).
Note: Statements are updated once a month (2nd Thursday of each month) in association with the ENSO Diagnostics Discussion, which can be found by clicking here.

Recent (preliminary) Southern Oscillation Index values as per The Long Paddock – Queensland Government.

30 Days average SOI was -5.83 at the end of July 2024 and was -8.85 on 6th August 2024 as per The Long Paddock – Queensland Government and 90 Days average SOI was -3.06 on 6th August 2024.

As per BOM – Australia 6th August 2024

ENSO is neutral; a possibility of La Niña development during spring (Southern Hemisphere)

The ENSO Outlook is currently at La Niña Watch, meaning there are some signs that a La Niña may form in the Pacific Ocean later in 2024. A La Niña Watch does not guarantee that a La Niña will develop. The La Niña Watch is based on climate model forecasts and current atmospheric and oceanic conditions in the Pacific. Atmospheric and oceanic indicators are currently within ENSO-neutral thresh holds. While ENSO is likely to remain neutral until at least early spring. From October, 3 of 7 climate models suggest the
possibility of SSTs cooling to the La Niña threshold (below −0.8 °C). The remaining models suggest a continuation of ENSO-neutral conditions throughout the forecast period.

Note: All Seasons mentioned by BOM are with respect to Southern Hemisphere.

Walker Circulation study is a damp squib for climate worriers, contradicts models

The paper this article is based on informs us that ‘The Pacific Walker circulation (PWC) has an outsized influence on weather and climate worldwide. Yet the PWC response to external forcings is unclear’.

From Tallbloke’s Talkshop

August 25, 2023 by oldbrew

Walker Circulation – El Niño conditions [image credit: NOAA]

The paper this article is based on informs us that ‘The Pacific Walker circulation (PWC) has an outsized influence on weather and climate worldwide. Yet the PWC response to external forcings is unclear’. Under a headline saying: ‘Greenhouse gases are changing air flow over the Pacific Ocean, raising Australia’s risks of extreme weather’, the article here offers almost nothing to support an argument for any human-caused climate effects ‘in the industrial era’. The paper is somewhat embarrassing for climate models: ‘Most climate models predict that the PWC will ultimately weaken in response to global warming. However, the PWC strengthened from 1992 to 2011, suggesting a significant role for anthropogenic and/or volcanic aerosol forcing, or internal variability’. So that role could be anything or nothing, but the models trended the wrong way anyway. The search for ‘anthropogenic fingerprints’ continues.
– – –
After a rare three-year La Niña event brought heavy rain and flooding to eastern Australia in 2020-22, we’re now bracing for the heat and drought of El Niño at the opposite end of the spectrum, says The Conversation (via Phys.org).

But while the World Meteorological Organization has declared an El Niño event is underway, Australia’s Bureau of Meteorology is yet to make a similar declaration. Instead, the Bureau remains on “El Niño alert.”

The reason for this discrepancy is what’s called the Pacific Walker Circulation. The pattern and strength of air flows over the Pacific Ocean, combined with sea surface temperatures, determines whether Australia experiences El Niño or La Niña events.

In our new research, published in the journal Nature, we asked whether the buildup of greenhouse gases in the atmosphere had affected the Walker Circulation. We found the overall strength hasn’t changed yet, but instead, the year-to-year behavior is different.

Switching between El Niño and La Niña conditions has slowed over the industrial era. That means in the future we could see more of these multi-year La Niña or El Niño type events. So we need to prepare for greater risks of floods, drought and fire. [Talkshop comment – alarmist psychobabble].

An ocean-atmosphere climate system

La Niña and its counterpart El Niño are the two extremes of the El Niño Southern Oscillation—a coupled ocean-atmosphere system that plays a major role in global climate variability.

The Walker Circulation is the atmospheric part. Air rises over the Indo-Pacific Warm Pool (a region of the ocean that stays warm year-round) and flows eastward high in the atmosphere. Then it sinks back to the surface over the eastern equatorial Pacific and flows back to the west along the surface, forming the Pacific trade winds. In short, it loops in an east-west direction across the equatorial Pacific Ocean.

But the Walker Circulation doesn’t always flow with the same intensity—sometimes it is stronger, and sometimes it is weaker.

So far, the Walker Circulation is what’s missing from the current El Niño event developing in the Pacific Ocean: it has not weakened enough for the Bureau to declare an El Niño event.

What’s happening to the Walker Circulation?

The Walker Circulation is a major influence on weather and climate in many places around the world, not just Australia.

A stronger-than-usual Walker Circulation even contributed to the “global warming slowdown” of the early 2000s. This is because a stronger Walker Circulation is often associated with slightly cooler global temperature.

So we need to know how it is going to behave in the future. To do that, we first need to know if—and if so, how—the Walker Circulation’s behavior has changed due to human activities. And to do that, we need information about how the Walker Circulation behaved before humans started affecting the climate system. [Talkshop comment – unsupported assertion].

We reconstructed Walker Circulation variability over the past millennium. We used global data from ice cores, trees, lakes, corals and caves to build a picture of how the Walker Circulation changed over time.

We found that on average, there has not yet been any industrial-era change in the strength of the Walker Circulation.

This was surprising, because computer simulations of Earth’s climate generally suggest global warming will ultimately cause a weaker, or

more El Niño-like, Walker Circulation.

Full article here..
– – –
Research paper: Forced changes in the Pacific Walker circulation over the past millennium (Aug. 2023)

Are ENSO Regime Changes Connected To Major Climate Shifts? Are We Tipping To Cooling?

We’ve had a La Niña for nearly three years. But now it has officially ended, and ENSO has moved into its neutral phase, the “La Nada”.[1] The La Niña event lasted three winters in a row, something that has only occurred twice before in modern times: 1973–1976 and 1998–2001. Both of these followed in response to a very strong El Niño.

From NoTricksZone

By P Gosselin on 19. April 2023

By Gabriel Oxenstierna

We’ve had a La Niña for nearly three years. But now it has officially ended, and ENSO has moved into its neutral phase, the “La Nada”.[1] The La Niña event lasted three winters in a row, something that has only occurred twice before in modern times: 1973–1976 and 1998–2001. Both of these followed in response to a very strong El Niño.

The La Niña that has now ended, on the other hand, came after the more neutral winter of 2019/20.

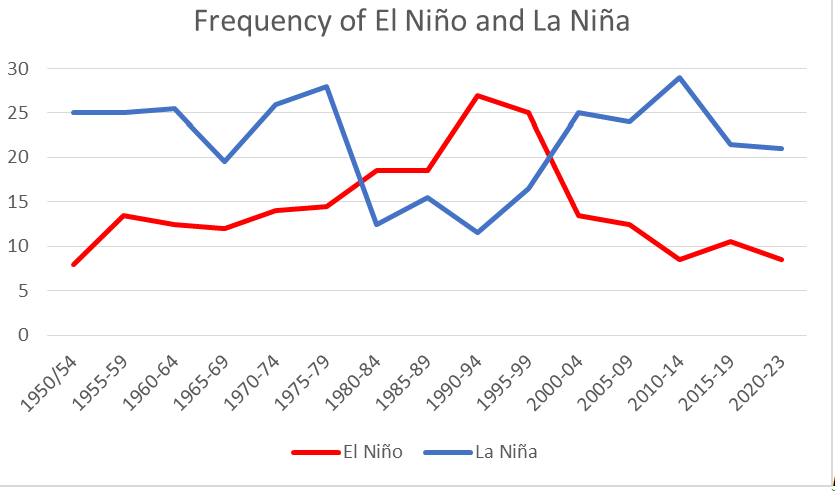
Figure 1. Number of months with each ENSO phase for five-year periods from 1950 – 2023

The number of months that we have had each ENSO phase in the last 74 years is shown in Figure 1. The La Niñas are more frequent than the El Niños. Interestingly, the opposite was true during the rapid warming we had from 1975 – 1999, when El Niños were more common. But then it reverts back again around 1998/99. Is there a pattern here?

It is established in climate science that the climate underwent a profound shift in 1976/77, related to the ocean currents.[2] In IPCC AR4, they write: “The 1976–1977 climate shift in the Pacific, associated with a phase change in the PDO from negative to positive, was associated with significant changes in ENSO evolution.” The Pacific Decadal Oscillation (PDO) shifted from a ‘cold’ to a ‘warm’ phase during these two years.[3] The ENSO also became dominated by the El Niño phase, which is characterized by warmer temperatures.[4] These changes affected the global climate, and a rapid warming began.

But what happened in the years just before 2000? As seen in Figure 1, ENSO reverts to being dominated by the ‘colder’ La Niña at that time.

Figure 2. The PDO index according to NOAA/ESRL.

Interestingly, the PDO also reverts to its cold phase in 1998–1999.

Are we seeing a shift to a colder phase in the climate here?

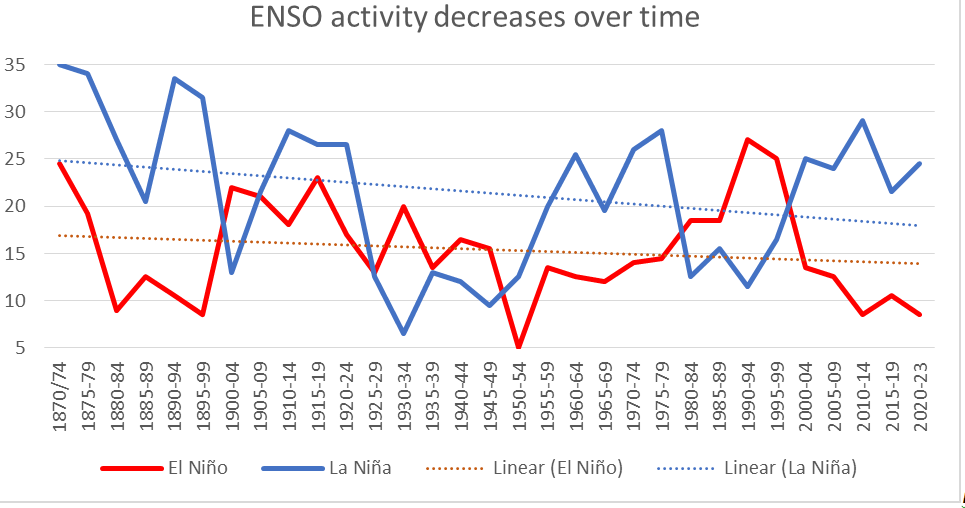
To analyze this confluence, we need to look at longer time series. Luckily, there is monthly ENSO data back to 1871.[5] In Figure 3 I have plotted the number of months of each active ENSO phase, collated in 5-year periods.

Figure 3. Number of months with the respective ENSO phase, and trend lines. Five-year periods from 1871 to 2023.

An oft-repeated forecast is that global warming will lead to more frequent and stronger El Niños, and a generally more active ENSO.[6][7]

However, we see no signs of this in the empirical evidence. On the contrary, the trend is in long-term decline for both ENSO phases.

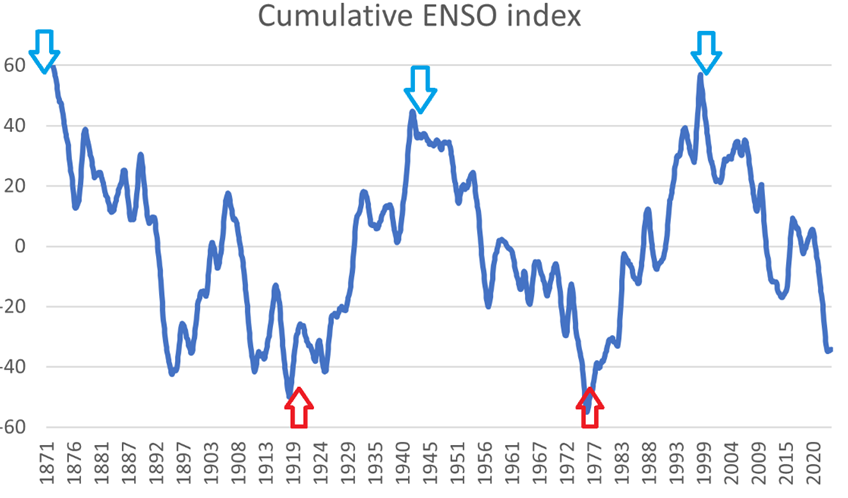
Figure 4. De-trended, cumulative total of the MEI ENSO index from 1871–2023. Approximate turning points of the PDO are marked with arrows.

The longer-term natural variation for ENSO is clearly seen if we look at the cumulative total of the MEI coefficient in Figure 4. MEI varies around zero, it is positive when we have El Niño and negative for La Niña. The cumulative total is what we get when we start with the first value, and then add each succeeding value to the previous total. The advantage of using the cumulative total is that it lays bare the timing of the fundamental shifts in the system.

We see that ENSO has two distinct long-term states: up or down.
Furthermore, the shift from one to the other seems to be threshold-based.

We have a negative cumulative ENSO trend from 1871–1920 since those years saw a strong dominance of La Niña events. During this period, global temperatures were declining.

In contrast, the period 1920–1944 saw a rapid increase in temperatures and is dominated by El Niño events, as seen in Figure 3. Then comes the cold period from 1945–75, dominated by La Niña events and a declining cumulative ENSO index. After that we have a positive trend until 1997/98, with a rapid increase in global temperatures.

Interestingly, these turning points in ENSO coincide with the reversal of the long-term PDO (marked by arrows in the figure).

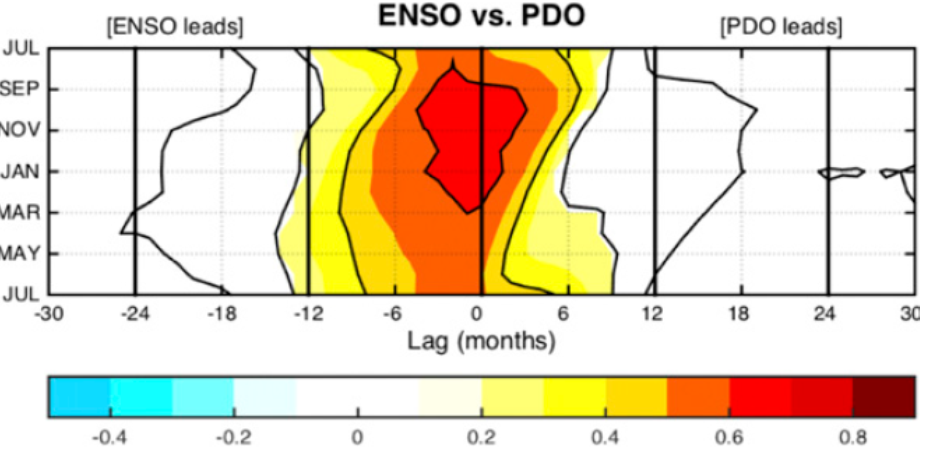
Figure 5. ENSO often leads the PDO, especially in the La Niña phase.

That ENSO and PDO are climatically connected is well known. Usually, it’s the ENSO that leads the shifts in the PDO cycle, see Figure 3d in [4].

The standard explanation for the 1976/77 climate shift is that the period before that was cold due to a lot of aerosols in the atmosphere that reduced the amount of warming solar radiation.[8] But around those years, the warming forcing from CO2 took over the cooling aerosols, the narrative goes.

Cannot be explained by CO2

CO2 has been increasing monotonically throughout the modern era, and aerosols increased monotonically up until about 1980.[9] Thus, it is unreasonable that more than one of the climate shifts in the modern era can be explained by the relationship of CO2 to aerosols.

It is more likely that climate shifts are due to confluences between different natural variations that we can observe in various climate indices. We can see, for example, that also the long-term variations in the AMO and SOI show similar turning points to the cumulative ENSO and the PDO, as in figure 4.[3]

Are we currently in a shift towards a colder climate?

One indication of that, is that we’re still quite far away from the previously observed threshold levels in the cumulative ENSO index.

A note on ENSO indexes

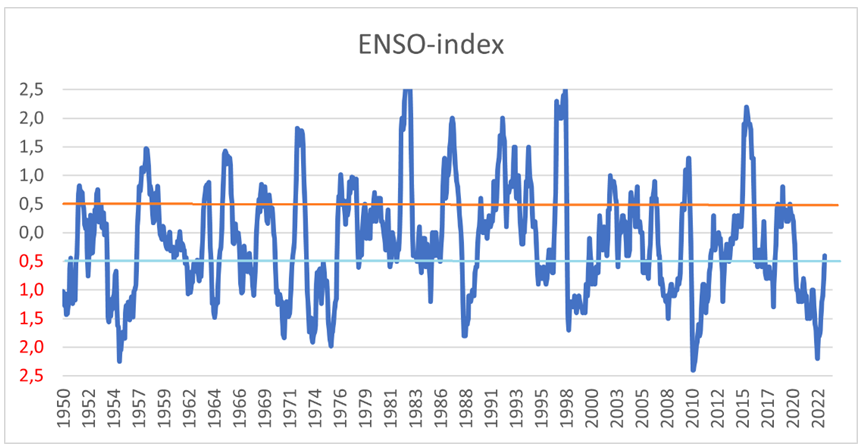
The ENSO variation between La Niña/Neutral/El Niño is defined by different indices. The traditional one is called NINO 3.4, which picks up temperature differences in two regions in the Pacific ocean. If the average value is below -0.5 degrees three months in a row, it is classified as La Niña, above 0.5 it is El Niño, where the numbers refer to the temperature deviation in two areas of the Pacific Ocean.

The MEI.v2, which is used in this article, is an alternative index, which weighs together five different variables: sea surface air pressure, sea surface temperature, zonal and meridional components of the surface wind, and outgoing longwave radiation.

The MEI uses the same numerical scale as for Nino 3.4, but the amplitude differs. MEI.v2 exists from 1979 and the earlier MEI index exists from 1950, and in a reconstruction back to 1871. This is what the raw data looks like for the MEI.v2 index:

References

[1] El Niño and La Niña Alert System, https://www.climate.gov/news-features/blogs/march-2023-enso-update-no-more-la-ni%C3%B1a see also:
https://www.cpc.ncep.noaa.gov/products/analysis_monitoring/enso_advisory/ensodisc.shtml

[2] The 1976-77 Climate Shift of the Pacific Ocean, Miller and 4 co-authors, 1994, Oceanography, https://doi.org/10.5670/oceanog.1994.11

[3] A new dynamical mechanism for major climate shifts, Tsonis and 4 co-authors, https://doi.org/10.1029/2007GL030288

[4] The Pacific Decadal Oscillation, Revisited, Newman and 14 co-authors, Journal of Climate 2016, https://doi.org/10.1175/JCLI-D-15-0508.1

[5] Data from NOAA. https://psl.noaa.gov/enso/mei.ext/table.ext.html
Enso has also been reconstructed for the latter half of the Holocene, about 6000 years back in time: Changes in ENSO Activity During the Last 6,000 Years Modulated by Background Climate State, Soon-Il An and 2 co-authors, https://www.docdroid.net/QmS34GN/101002-at-2017gl076250.pdf

[6] Emergence of climate change in the tropical Pacific, Ying and 6 co-authors, Nature 2022, https://doi.org/10.1038/s41558-022-01301-z

[7] Increased ENSO sea surface temperature variability under four IPCC emission scenarios, Cai and 5 co-authors, Nature 2022, https://doi.org/10.1038/s41558-022-01282-z

[8] See, for example, the article at Skeptical Science, Why did climate cool in the mid-20th Century?, https://skepticalscience.com/global-cooling-mid-20th-century-advanced.htm

[9] Rethinking the Lower Bound on Aerosol Radiative Forcing, B. Stevens, 2015, https://10.1175/JCLI-D-14-00656.1