


From Science Matters
By Ron Clutz

After a recent squabble with a pack of Net Zero zealots, I realized that interested people should have access to a number of CO2 science facts that are hidden from public view and certainly won’t appear in the AI bots programmed to repeat IPCC slogans. Below is a compendium of important contemporary findings everyone needs to know, not to be duped by the climatists. The titles are links to published research papers along with brief highlights of their importance and some pertinent graphics. There are many more skeptical findings, but these show the different analyses revealing numerous holes in IPCC swiss cheese “consensus science.”
World Atmospheric CO2, Its 14C Specific Activity, Non-fossil Component, Anthropogenic Fossil Component, and Emissions (1750–2018)
World Atmospheric CO2, Its 14C Specific Activity, Non-fossil Component, Anthropogenic Fossil Component, and Emissions (1750–2018)— Health Physics, 2022; Skrable et al.
We determined that in 2018, atmospheric anthropogenic fossil CO2 represented 23% of the total emissions since 1750 with the remaining 77% in the exchange reservoirs. Our results show that the percentage of the total CO2 due to the use of fossil fuels from 1750 to 2018 increased from 0% in 1750 to 12% in 2018, much too low to be the cause of global warming. [My snyopsis: On CO2 Sources and Isotopes]

The graph above is produced from Skrable et al. dataset Table 2. World atmospheric CO2, its C‐14 specific activity, anthropogenic‐fossil component, non-fossil component, and emissions (1750 ‐ 2018). The purple line shows reported annual concentrations of atmospheric CO2 from Energy Information Administration (EIA) The starting value in 1750 is 276 ppm and the final value in this study is 406 ppm in 2018, a gain of 130 ppm.
The red line is based on EIA estimates of human fossil fuel CO2 emissions starting from zero in 1750 and the sum slowly accumulating over the first 200 years. The estimate of annual CO2 emitted from FF increases from 0.75 ppm in 1950 up to 4.69 ppm in 2018. The sum of all these annual emissions rises from 29.3 ppm in 1950 (from the previous 200 years) up to 204.9 ppm (from 268 years). These are estimates of historical FF CO2 emitted into the atmosphere, not the amount of FF CO2 found in the air.
Atmospheric CO2 is constantly in two-way fluxes between multiple natural sinks/sources, principally the ocean, soil and biosphere. The annual dilution of carbon 14 proportion is used to calculate the fractions of atmospheric FF CO2 and Natural CO2 remaining in a given year. The blue line shows the FF CO2 fraction rising from 4.03 ppm in 1950 to 46.84 ppm in 2018. The cyan line shows Natural CO2 fraction rising from 307.51 in 1950 to 358.56 in 2018.
Despite an estimated 205 ppm of FF CO2 emitted since 1750, only 46.84 ppm (23%) of FF CO2 remains, while the other 77% is distributed into natural sinks/sources. As of 2018 atmospheric CO2 was 405, of which 12% (47 ppm) originated from FF. And the other 88% (358 ppm) came from natural sources: 276 prior to 1750, and 82 ppm since. Natural CO2 sources/sinks continue to drive rising atmospheric CO2, presently at a rate of 2 to 1 over FF CO2.
Residence Time vs. Adjustment Time of Carbon Dioxide in the Atmosphere
Residence Time vs. Adjustment Time of Carbon Dioxide in the Atmosphere — Entropy, 2023; Peter Stallinga
We study the concepts of residence time vs. adjustment time time for carbon dioxide in the atmosphere. The system is analyzed with a two-box first-order model. Using this model, we reach three important conclusions: (1) The adjustment time is never larger than the residence time and can, thus, not be longer than about 5 years. (2) The idea of the atmosphere being stable at 280 ppm in pre-industrial times is untenable. (3) Nearly 90% of all anthropogenic carbon dioxide has already been removed from the atmosphere. [My synopsis: CO2 Fluxes Not What IPCC Telling You]

In these years, the amount of CO2 in the atmosphere has risen from 280 ppm (2268 Gt) to 420 ppm (3403 Gt), an increment of 1135 Gt. Of these, 202.3 Gt (17.8%) would be attributable to humans and the rest, 932.7 Gt (82.2%), must be from natural sources.
In view of this, curbing carbon emissions seems rather fruitless; even if we destroy the fossil-fuel-based economy (and human wealth with it), we would only delay the inevitable natural scenario by a couple of years.
The Scientific Case Against Net Zero: Falsifying the Greenhouse Gas Hypothesis
The scientific case against net zero: falsifying the greenhouse gas hypothesis — Journal of Sustainable Development, 2024; Michael Simpson
There is a suggestion (IPCC) that the residence time of CO2 in the atmosphere is different for anthropogenic CO2 and naturally occurring CO2. This breaks a fundamental scientific principle, the Principle of Equivalence. That is: if there is equivalence between two things, they have the same use, function, size, or value (Collins English Dictionary, online). Thus, CO2 is CO2 no matter where it comes from, and each molecule will behave physically and react chemically in the same way.

It is well-known that the residence time of CO2 in the atmosphere is approximately 5 years (Boehmer-Christiansen, 2007: 1124; 1137; Kikuchi, 2010). Skrable et al., (2022), show that accumulated human CO2 is 11% of CO2 in air or ~46.84ppmv based on modelling studies. Berry (2020, 2021) uses the Principle of Equivalence (which the IPCC violates by assuming different timescales for the uptake of natural and human CO2) and agrees with Harde (2017a) that human CO2 adds about 18ppmv to the concentration in air. These are physically extremely small concentrations of CO2 which suggest most CO2 arises from natural sources. It can be concluded that the IPCC models are wrong and human CO2 will have little effect on the temperature. [My synopsis: Straight Talk on Climate Science and Net Zero]
Better calculations of the human contribution to atmospheric CO2 concentrations are available and it is small ~18ppmv (Skrable et al., 2022; Berry, 2020; Harde 2017a & 2017b; Harde, 2019; Harde 2014). The phase relation between temperature and CO2 concentration changes are now clearly understood; temperature increases are followed by increases in CO2 likely from outgassing from the ocean and increased biological activity (Davis , 2017; Hodzic and Kennedy, 2019; Humlum, 2013; Salby, 2012; Koutsoyiannis et al, 2023 & 2024).
Decoupling CO2 from Climate Change
Decoupling CO2 from Climate Change— International Journal of Geosciences, 2024; Nelson & Nelson
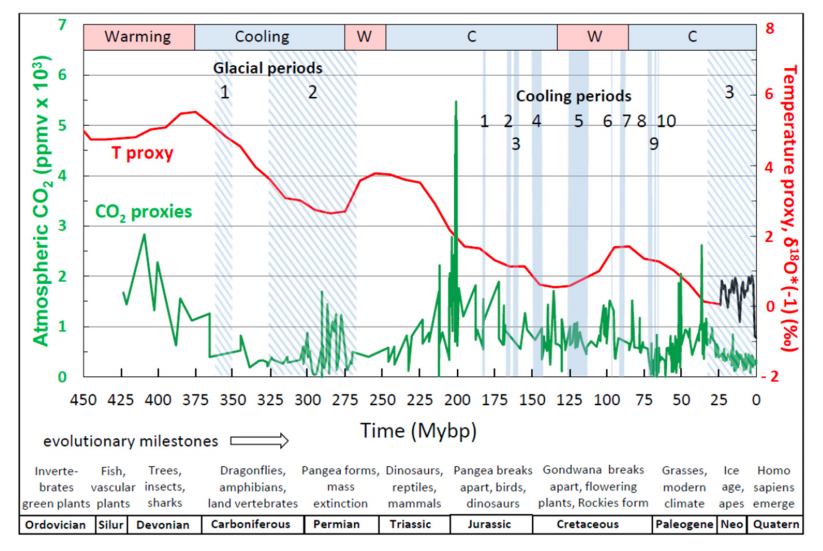
Historical data were reviewed from three different time periods spanning 500 million years. It showed that the curves and trends were too dissimilar to establish a connection. Observations from CO2/temp ratios showed that the CO2 and the temperature moved in opposite directions 42% of the time. Many ratios displayed zero or near zero values, reflecting a lack of response. As much as 87% of the ratios revealed negative or near zero values, which strongly negate a correlation.
The fact that the curves were wildly divergent suggests there were major factors in play that were not considered. Excluding water vapor from the analysis may be one reason, as explained in sections 4 and 5. The list of other contributing factors is extensive. For example, changes in the orbital paths of the sun and planets, as suggested by the Milankovitch Cycles, may have had an effect. Changes in the sun’s radiation intensity may play a role. The Earth’s volcanism, nuclear fission at its core, radioactive decay, or changes in the magnetic fields may have an effect over millions of years. These are only a few possibilities not considered in the hypothesis.

Studies have reported that the rise in the CO2 concentration lagged behind temperature increases by 400 to 1000 years [6]. In 2007 the IPCC stated at page 105 [7] “However, it now appears that the initial climatic change preceded the change in CO2 but was enhanced by it (Section 6.4)” But there was no proof provided in section 6.4 supporting the enhancement theory. They stated on page 442 “it may be the result of increased ocean heat transports due to either an enhanced thermohaline circulation” (citations) “or increased flow of surface ocean currents.” A lagging CO2 concentration after the temperature changes contradicts the Greenhouse-CO2 hypothesis, i.e. a rise in CO2 concentration results in warming.
The Relationship between Atmospheric Carbon Dioxide Concentration and Global Temperature for the Last 425 Million Years
The Relationship between Atmospheric Carbon Dioxide Concentration and Global Temperature for the Last 425 Million Years — Climate, 2017; Davis
“Assessing human impacts on climate and biodiversity requires an understanding of the relationship between the concentration of carbon dioxide (CO2) in the Earth’s atmosphere and global temperature (T). Here I explore this relationship empirically using comprehensive, recently-compiled databases of stable-isotope proxies from the Phanerozoic Eon (~540 to 0 years before the present) and through complementary modeling using the atmospheric absorption/transmittance code MODTRAN. Atmospheric CO2 concentration is correlated weakly but negatively with linearly-detrended T proxies over the last 425 million years. … This study demonstrates that changes in atmospheric CO2 concentration did not cause temperature change in the ancient climate.”

Reconstruction of Atmospheric CO2 Background Levels since 1826 from Direct Measurements near Ground
Reconstruction of Atmospheric CO2 Background Levels since 1826 from Direct Measurements near Ground Ernst-Georg Beck—Science of Climate Change Ernst-Georg Beck (2022)

The data also suggest higher levels in the first half of the 19th century than reconstructed from commonly used ice cores. Using modern MLO CO2 data, we can calculate a centennial average for the 20th century 1901–2000 of 331.38 ppm and of a MBL [Marine Boundary Level samples]in the 19th century (1826–1900) of 322.67. This is a growth rate of +2.6 % in contrast to about 30 % as derived from ice cores and therefore within measurement variability. Analysing the new series of directly measured CO2 MBL levels from 1926 to 2010 suggests a possible cyclic behaviour. The CO2 MBL levels since 1826 to 2008 show a good correlation to the global SST (Kaplan, KNMI; see Figure 26) with a CO2 lag of 1 year after SST from cross correlation (Figure 26a). Kuo et al. (1990) had derived 5 months lag from MLO data alone.

Stomata data confirm the CO2 MBL reconstruction as well as the raw data showing high CO2-levels in the 1930s and 40s at higher temperatures. This is the pre-condition for the inverse stomata/CO2 relation.
About Historical CO2-Data since 1826: Explanation of the Peak around 1940 Hermann Harde
About Historical CO2-Data since 1826: Explanation of the Peak around 1940–Science of Climate Change Hermann Harde, 2023
An extensive compilation of almost 100.000 historical data about CO2 concentration measurements between 1826 and 1960 has been published as post mortem memorial edition of the late Ernst-Georg Beck (Beck 2022). Different to the widely used interpretation of proxy data, Beck’s compilation contains direct measurements of chemically analysed air samples with much higher accuracy and time resolution than available from ice core or tree ring data.
Beck already found a high correlation of the CO2 level data to the global Sea Surface Temperature (SST) series of the Royal Netherlands Meteorological Institute (Kaplan, KNMI). Supported by different observations of CO2 enriched air at the coast (North Sea, Barents Sea, Northern Atlantic) he suggested that warmer ocean currents over the Northern Atlantic are the sources of the enhanced CO2-levels.

In this contribution we compare the temperature sensitivity of oceanic and land emissions and their expected contributions to the atmospheric CO2 mixing ratio. Our simulations with a land-air temperature series (Soon et al. 2015) alone, or in combination with sea surface data (HadSST4, Kennedy et al. 2019) can well reproduce the increased mixing ratio over the 30s to 40s, the consecutive decline over the 50s and the additional rise up to 2010. This stronger variation cannot be explained only by fossil fuel emissions, which show a monotonic increase over the Industrial Era.
Atmospheric CO2: Exploring the Role of Sea Surface Temperatures and the Influence of Anthropogenic CO2 Bernard Robbins
Atmospheric CO2: Exploring the Role of Sea Surface Temperatures and the Influence of Anthropogenic CO2 — Science of Climate Change, 2025; Robbins
“ Using SST and Mauna Loa datasets, three methods of analysis are presented that seek to identify and estimate the anthropogenic and, by default, natural components of recent increases in atmospheric CO2, an assumption being that changes in SSTs coincide with changes in nature’s influence, as a whole, on atmospheric CO2 levels.

The findings of the analyses suggest that an anthropogenic component is likely to be around 20 %, or less, of the total increase since the start of the industrial revolution. The inference is that around 80 % or more of those increases are of natural origin, and indeed the findings suggest that nature is continually working to maintain an atmospheric/surface CO2 balance, which is itself dependent on temperature.”
Multivariate Analysis Rejects the Theory of Human-caused Atmospheric Carbon Dioxide Increase: The Sea Surface Temperature Rules
Multivariate Analysis Rejects the Theory of Human-caused Atmospheric Carbon Dioxide Increase: The Sea Surface Temperature Rules–Science of Climate Change Dai Ato 2024
“The main factor governing the annual increase in atmospheric CO2 concentration is the SST [sea surface temperature] rather than human emissions.” – Ato, 2024
Another day, another new scientific paper has been published reporting efforts to curb anthropogenic CO2 emissions are “meaningless.” In this study multiple linear regression analysis was performed comparing SST versus anthropogenic CO2 emissions as explanatory factors and the annual changes in atmospheric CO2 as the objective variable over the period 1959-2022.
The model using the SSTs (NASA, NOAA, UAH) best explained the annual CO2 change (regression coefficient B = 2.406, P = <0.0002), whereas human emissions were not shown to be an explanatory factor at all in annual CO2 changes (regression coefficient B = 0.0027, P = 0.863). Most impressively, the predicted atmospheric CO2 concentration using the regression equation derived from 1960-2022 SSTs had an extremely high correlation coefficient of r = 0.9995.
Thus, not only is the paradigm that says humans drive atmospheric CO2 changes wrong, but “the theory that global warming and climate change are caused by human-emitted CO2 is also wrong.”
“SST has been the determinant of the annual changes in atmospheric CO2 concentrations and […] anthropogenic emissions have been irrelevant in this process, by head-to-head comparison.”
Revisiting the greenhouse effect – a hydrological perspective
Revisiting the greenhouse effect—a hydrological perspective — Hydrological Sciences Journal, 2023; Koutsoyiannis & Vournas
“As the formulae used for the greenhouse effect quantification were introduced 50-90 years ago, we examine whether these are still representative or not, based on eight sets of observations, distributed in time across a century. We conclude that the observed increase of the atmospheric CO2 concentration has not altered, in a discernible manner, the greenhouse effect, which remains dominated by the quantity of water vapour in the atmosphere, and that the original formulae used in hydrological practice remain valid. Hence, there is no need for adaptation due to increased CO2 concentration.”
Net Isotopic Signature of Atmospheric CO2 Sources and Sinks: No Change since the Little Ice Age
Net Isotopic Signature of Atmospheric CO2 Sources and Sinks: No Change since the Little Ice Age — Sci, 2024; Demetris Koutsoyiannis
This is a follow-on to the paper above, which received more than 1,000 comments on Judith Curry’s blog. He revisits the calculations and claims that the CO2 in the atmosphere today, and the rise during the last 100 years or so, is natural and there is no “signature” from humans.

The results of the analyses in this paper provide negative answers to the research questions posed in the Introduction. Specifically:
♦ From modern instrumental carbon isotopic data of the last 40 years, no signs of human (fossil fuel) CO2 emissions can be discerned;
♦ Proxy data since the Little Ice Age suggest that the modern period of instrumental data does not differ, in terms of the net isotopic signature of atmospheric CO2 sources and sinks, from earlier centuries.
Comment and Declaration on the SEC’s Proposed Rule “The Enhancement and Standardization of Climate-Related Disclosures for Investors”
Comment and Declaration on the SEC’s Proposed Rule— Happer and LIndzen,
The Logarithmic Forcing from CO2 Means that Its Contributions to Global Warming is Heavily Saturated, Instantaneously Doubling CO2 Concentrations from 400 ppm to 800 ppm, a 100% Increase, Would Only Diminish the Thermal Radiation to Space by About 1.1%, and therefore tiny changes of Earth’s surface temperature, on the order of 1° C (about 2° F). Thus Confirming There is No Reliable Scientific Evidence Supporting the Proposed Rule.
This means that from now on our emissions from burning fossil fuels could have little impact on global warming. There is no climate emergency. No threat at all. We could emit as much CO2 as we like, with little warming effect.

Saturation also explains why temperatures were not catastrophically high over the hundreds of millions of years when CO2 levels were 10-20 times higher than they are today.
Further, saturation also provides another reason why reducing the use of fossil fuels to“net zero” by 2050 would have a trivial impact on climate, contradicting the theory there is a climate related risk from fossil fuel and CO2 emissions.
Laws of Physics Define the Insignificant Warming of Earth by CO2
Laws of Physics Define the Insignificant Warming of Earth — Journal of Basic and Applied Sciences, 2023; Lightfoot and Ratzer
The authors use real-world data (not models or simulations) to determine that at the tropics, water vapor does virtually all the work of the greenhouse effect, and at the poles, where it is very dry, carbon dioxide plays no measurable role. They show that almost three-quarters of the atmosphere’s water molecules are in the Tropics, which is where the greenhouse effect takes place. They don’t say this, but the CO2 at the poles can’t cause any heating simply because there is no greenhouse effect at the poles. In fact, CO2 at the poles causes cooling.

Calculating the increase in the heat content of the atmosphere caused by increased CO2 is the method for determining the rise in Earth’s temperature. An increase from 311 ppm to 418 ppm causes a maximum rise of 0.006oC from McMurdo to Taoudenni, Mali, in the Sahara Desert. This value indicates the temperature increase is too small to measure, i.e., negligible [15].
This study is a significant step forward in the science of the Earth’s atmosphere. It provides robust quantitative evidence that the overall warming by CO2 is insignificant, and water vapor is the most significant greenhouse gas.


Footnote: Clashing CO2 Paradigms
For insight into the two conflicting viewpoints regarding CO2 and temperatures, see:




You must be logged in to post a comment.