Wrong, AP and NPR: Europe’s 50,000 Heat Deaths Are a Computer-Model Estimate, Not a Real Body Count

National Public Radio (NPR), reprinted an Associated Press (AP) report from climate reporter Seth Borenstein titled “Europe’s heat claims 50,000 lives. Climate change blamed for two-thirds of deaths,” which claims that summer heat killed 50,391 Europeans in 2026 and that human-caused climate change killed 32,619 of them. This is false.

Modeled numbers are presented by NPR as observed deaths when they are not. The data show that neither number is a count of actual people medically determined to have died from heat or climate change; both are statistical constructs produced by computer models.

Infographic stating that Europe's reported 50,000 heat deaths are based on computer modeling and not actual confirmed mortality counts.
AI generated by Meta

From ClimateRealism

By Anthony Watts

A concerned man with glasses looking directly at the camera with a worried expression, wrapped in a purple blanket. A speech bubble above him reads 'I see dead people.'

National Public Radio (NPR), reprinted an Associated Press (AP) report from climate reporter Seth Borenstein titled “Europe’s heat claims 50,000 lives. Climate change blamed for two-thirds of deaths,” which claims that summer heat killed 50,391 Europeans in 2026 and that human-caused climate change killed 32,619 of them. This is false. Modeled numbers are presented by NPR as observed deaths when they are not. The data show that neither number is a count of actual people medically determined to have died from heat or climate change; both are statistical constructs produced by computer models.

Here is the basis of the false headline:

Researchers modeled heat-related deaths for different age groups in 854 European cities during repeated heat waves in June, July and August and found that 50,391 people died from warmer temperatures, and of those, 32,619 died because of the extra heat caused by the burning of coal, oil and gas, according to a study in an upcoming issue of Nature Health.

The 50,391 “heat deaths” are imaginary in the literal sense that neither AP nor NPR can produce a list of 50,391 people whose deaths were determined to have been caused by heat. The researchers did not count them, they modeled them. NPR eventually admits exactly that: “The scientific team also had to use statistical modeling to come up with the base count of 50,000 heat deaths.” That sentence demolishes the impression created by NPR’s headline.

There is no observed body count of 50,000 and more heat victims. Instead, there are mortality records, temperature records, statistical relationships between temperature and mortality, and a mathematical model that estimates how many deaths might be associated with temperatures above a calculated optimum. The resulting number is merely an estimate. AP and NPR irresponsibly report it as though there is an actual body count.

Then the researchers take that imaginary statistical population of 50,391 heat deaths and run another modeling exercise to determine how many were supposedly caused by climate change. Again, the story admits how this was done: “They ran computer simulations of a world without climate change and compared it to the deaths that happened this summer. The difference is what was caused by global warming.” Except NPR’s wording is misleading even there. The researchers weren’t comparing their imaginary climate with 50,391 individually identified heat deaths that “happened this summer.” The base heat-death number was itself produced statistically.

So, we have a model estimating how many people died from heat, followed by another model estimating what temperatures would have existed in a hypothetical world without human-caused climate change, followed by a calculation estimating how many of the first model’s estimated deaths would not have occurred in the second model’s imaginary world.

Out comes the wonderfully exact number of 32,619 climate-change deaths. Not approximately 30,000 or somewhere around 33,000, but exactly 32,619. That precision is almost comical considering that the people represented by the number were never individually identified as climate-change fatalities in the first place. There are no 32,619 death certificates saying “climate change.” There aren’t even 50,391 death certificates saying “heat.”

That doesn’t mean nobody died during Europe’s heat waves. Of course, people died, and some deaths may well have been caused or hastened by heat. Elderly people and those suffering cardiovascular, respiratory, and other illnesses can be especially vulnerable to extreme temperatures. More than half of NPR’s modeled deaths were among people aged 85 and older. But that is very different from claiming, as NPR’s headline does, that “Europe’s heat claims 50,000 lives.”

This distinction becomes even more important because the calculation depends upon assumptions about how mortality responds to temperature. The researchers used mathematical temperature-mortality relationships for different ages and cities, identifying an “optimal” temperature associated with minimum mortality and calculating additional deaths when temperatures departed from it. It makes sense on the surface, but those relationships are not scientific laws. Humans adapt to make themselves safer, like by simply buying an air conditioning unit. Physicians are better at treating heat stress, buildings improve, work schedules change, and vulnerable elderly residents are checked by relatives and social services.

Adaptation works. A 2024 Nature Medicine study estimated that European heat-related mortality during 2023 would have been 80 percent higher without adaptation since 2000. Among people over age 80, estimated mortality would have been more than twice as high without adaptation. It should be obvious that there is a problem with taking temperature-mortality relationships developed from previous years and treating them as though the conditions remain fixed. The Watts Up With That analysis, “Climate Death Toll: Batteries Not Included,” points directly to this problem. The calculation starts with historical temperature-mortality relationships, extrapolates them to hundreds of European cities, applies them to current temperatures and populations, and then compares the result against an imaginary counterfactual climate. Each stage adds assumptions, yet by the time the number reaches NPR, most of those assumptions have vanished and the model output has become a supposedly real death toll.

There is another glaring omission: cold. A major 2021 study published in The Lancet Planetary Health examined temperature and mortality across 750 locations in 43 countries. It estimated that 8.52 percent of deaths were associated with cold compared with just 0.91 percent associated with heat. By the same sort of statistical reasoning NPR is willing to accept for heat, cold was associated with roughly nine times as many deaths. More importantly, from 2000-2003 to 2016-2019, declining cold-associated mortality more than offset increasing heat-associated mortality. The result was a net decline in temperature-related mortality.

Climate at a Glance discusses the same research and notes that the decline in cold mortality associated with modest warming produced an estimated net reduction of approximately 166,000 premature temperature-related deaths from 2000 through 2019.  Curiously, NPR doesn’t produce a headline saying, “Global Warming Saves Thousands of Lives by Reducing Deadly Cold.” That apparently isn’t considered newsworthy.

The broader historical record is even more devastating to the suggestion that humanity is becoming increasingly helpless against climate. Climate at a Glance reports that deaths from weather-related disasters have declined by more than 99 percent during the past century. Average annual deaths from extreme weather disasters fell from approximately 485,000 during the 1920s to fewer than 8,000 around 2020. That is not what an escalating climate mortality crisis looks like.

Indeed, NPR’s own experts call for heat-warning systems, cooling, and neighborhood programs to check on vulnerable residents. Those are sensible measures that can save actual lives during the next heat wave, and they demonstrate something the climate narrative routinely obscures: people adapt.

There is nothing inherently improper about epidemiologists constructing statistical estimates. Such models can be useful tools for identifying risks, allocating resources, and developing public-health policy. But statistical estimates aren’t observational data.

If NPR wants to report that researchers estimate approximately 50,000 excess deaths statistically associated with summer temperatures, say so. If researchers further estimate, using a counterfactual climate model, that anthropogenic warming contributed to some fraction of that statistical mortality, say that too. But don’t tell readers that Europe’s heat “claims 50,000 lives” and that climate change killed exactly 32,619 people when nobody counted those deaths. A model can calculate an estimate, generate a counterfactual, and assign statistical probabilities, but a computer model cannot examine a body, determine a cause of death, sign a death certificate, or count a dead person.

NPR’s dead Europeans are imaginary people generated by a model, and the 32,619 supposedly killed by climate change are imaginary people generated from the imaginary people. Both AP and NPR act is if they are saying a famous movie line, “I see dead people.”

Wrong, Associated Press, Computer Simulations Don’t Mean Smashed Heat Records Will Occur

The Associated Press (AP) claims in “Think it’s hot now? The next five years will smash records, UN says” that Earth is “overwhelmingly likely” to repeatedly surge past the 1.5°C threshold and experience escalating heatwaves and extreme weather from 2026 to 2030. This is highly misleading if not outright false. The story is built almost entirely on computer model projections, not observed data, and it treats speculative model simulations as though they reflect measured trends.

From ClimateRealism

By Anthony Watts

The Associated Press (AP) claims in “Think it’s hot now? The next five years will smash records, UN says” that Earth is “overwhelmingly likely” to repeatedly surge past the 1.5°C threshold and experience escalating heatwaves and extreme weather from 2026 to 2030. This is highly misleading if not outright false. The story is built almost entirely on computer model projections, not observed data, and it treats speculative model simulations as though they reflect measured trends.

The AP admits that its claims are “based on the averaging of about 200 runs of computer simulations using 13 different climate models.” That is the core of the story. Not thermometers. Not weather station records. Not satellite observations. Computer simulations. Climate model outputs are not data.

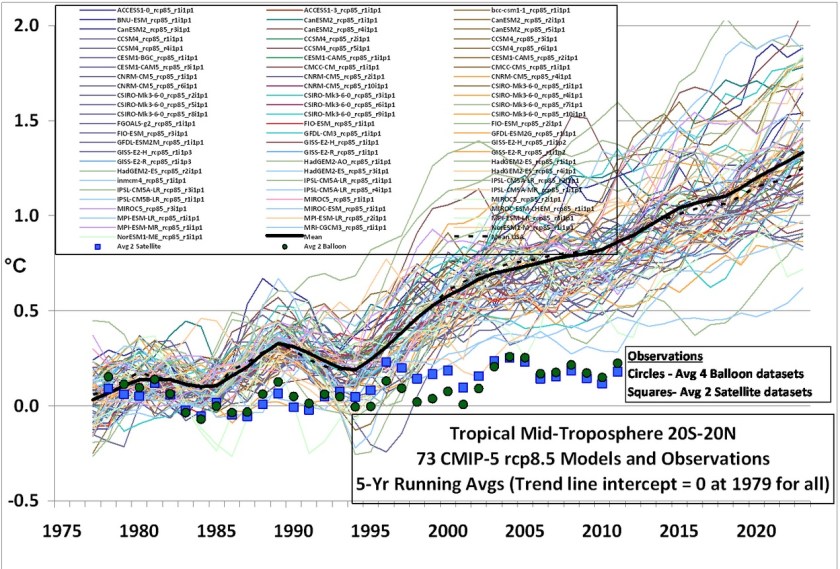
Climate models are tools, consisting of assumptions about greenhouse gas forcing, feedbacks, ocean heat uptake, and cloud behavior, fed into computers. They are useful for exploring scenarios. But they provide no real evidence that specific outcomes will occur. As documented in Climate at a Glance’s analysis of climate models versus measured temperature data, model ensembles have historically projected more warming than satellite and balloon observations show. The divergence between model runs and measured lower troposphere temperatures is not trivial. It is persistent.

The AP story warns of “limit-smashing global warming” and ties that to more extreme heatwaves. But heatwaves are not new, nor are they unprecedented in the historical record. The United States experienced severe, prolonged heatwaves in the 1930s during the Dust Bowl era, long before modern emissions levels. Climate at a Glance’s review of U.S. heatwaves explains that frequency of extreme heatwaves in the United States was higher in the 1930s than in recent decades. That is based on NOAA historical data, not projections.

If heatwaves were strictly “driven” by rising CO2 concentrations, we would expect a clear, monotonic increase in frequency and intensity corresponding to emissions growth. The observational record does not show that. Instead, it shows strong variability influenced by natural factors such as ocean cycles, soil moisture patterns, atmospheric blocking highs, and El Niño events.

The AP article itself acknowledges that “nearly all the shorter-term forecasts call for a strong El Niño.” El Niño is a natural ocean-atmosphere oscillation that temporarily boosts global average temperatures. It has nothing to do with fossil fuels. If 2027 turns out hotter due to a strong El Niño, that would reflect a cyclical Pacific warming phase, not proof of accelerating man-made climate forcing.

AP also emphasizes that there is a “75% chance” that the five-year average will exceed 1.5°C above preindustrial levels. But that 1.5°C threshold was a politically chosen “threshold,” not one identified by science as bringing catastrophe. The 1.5℃ temperature was a 20-year average benchmark under the Paris Agreement. Even the report’s co-author admits it is “not kind of a cliff edge that we’re going to fall off.” Yet the headline language suggests imminent planetary destabilization.

Short-term variability is a defining feature of Earth’s climate system. Volcanic eruptions, solar cycles, ENSO phases, and ocean circulation shifts can all nudge global averages up or down by tenths of a degree. The planet does not warm in a straight line. The idea that five years of elevated readings would constitute some irreversible tipping point is not supported by historical climate behavior. In point of fact, much of the warming of the past few years was likely driven by the Hunga Tonga near sea surface volcanic eruption, which injected enough water vapor into the atmosphere – water vapor being the dominant greenhouse gas – to, in the words of the National Oceanic and Atmospheric Administration, “cause a rapid change in chemistry.” The water vapor added by Hunga Tonga is only slowly diminishing, meaning its lingering effects will add to the expected El Nino. Meaning if the politically determined 1.5℃ threshold is breached, it will be combination of natural factors, not human caused climate change to blame. In either case, there is no real reason to believe dangerous tipping points will flow from it.

Climate at a Glance’s discussion of model fallibility documents multiple instances where model projections overstated warming trends or extreme event changes relative to observations. This fact means confidence in precise five-year forecasts should be restrained.

The broader problem is attribution inflation. When a heatwave occurs, it is immediately cited by an overzealous press (such as AP) as evidence of climate change. But weather is not climate. Heatwaves occurred before the Industrial Revolution. They occurred during the Medieval Warm Period. They occurred during the 1930s Dust Bowl as seen in the figure below.

Heat wave Index. Source: EPA

Specific events are influenced by immediate meteorological dynamics, not by abstract multi-decade averages alone. Climate change is a long-term statistical trend. It does not dictate the formation of a particular blocking heat dome over North America in June 2027. It does not create or prevent El Niño. It does not eliminate natural variability.

The AP story closes with sweeping claims that “every nation is already paying a huge price” from a “global climate crisis.” That alarmist rhetoric goes far beyond what five-year model ensembles can justify and, based on mortality, agricultural, and economic data, is flat false.

Forecasts based on 200 model runs are not measurements. They are scenario outputs, outputs only as good as the assumptions, data, and the accuracy of the modeled interconnections between disparate physical, chemical, and biological phenomena, built into the models. In fact, most of the factors that impact global and regional climates are only poorly understood and accounted for in models, as even the IPCC has admitted. (See the graphic, below)

The models used by the IPCC have a low Level of Scientific Understanding (LOSU) concerning impact of clouds, solar irradiance (that is the impact of the sun), and aerosols on climate change. Note the models don’t even attempt to account for volcanic impacts, or the impacts of changes to large scale ocean currents, changes in vegetation, or the Earth’s wobble and shifts in its tilt. Yet all of these impact climate on a regional or global scale. Thus, treating inadequate model forecasts as inevitabilities is unjustified as a matter of science and science reporting. The AP is choosing to promote an alarming climate narrative over the deep uncertainty that is the fact of the causes and present and future consequences of climate change.

Another “Model-Based” Methane Scare Story: Why It Doesn’t Hold Up to Scrutiny

Once again, the headlines scream “Worse than we thought.” This time, it’s methane—specifically from lakes and reservoirs—that’s being cast as the next great climate villain. According to a new study from Linköping University in Sweden and NASA Ames Research Center, methane emissions from inland waters could “double by the end of the century” and “exacerbate the IPCC’s worst-case climate scenario”. It sounds dire—until you take a closer look.

A scenic landscape featuring green hills and a winding path leading to a stone bridge over a river, with a calm lake visible in the background under a partly cloudy sky.

From Watts Up With That?

By Anthony Watts

Once again, the headlines scream “Worse than we thought.” This time, it’s methane—specifically from lakes and reservoirs—that’s being cast as the next great climate villain. According to a new study from Linköping University in Sweden and NASA Ames Research Center, methane emissions from inland waters could “double by the end of the century” and “exacerbate the IPCC’s worst-case climate scenario”. It sounds dire—until you take a closer look.

First, a little perspective. Methane (CH₄) currently makes up just about 1.9 parts per million of Earth’s atmosphere. That’s less than two-thousandths of a percent—essentially a trace gas. By comparison, carbon dioxide sits above 420 ppm, while water vapor—the dominant greenhouse gas—typically ranges from 10,000 to 40,000 ppm depending on humidity. Yet methane is frequently portrayed in the media as a “super-potent” greenhouse gas, with headlines implying it plays an outsized role in warming. In reality, methane’s total radiative forcing—its contribution to the atmosphere’s energy balance—is small compared to CO₂ and minuscule compared to water vapor. Its concentration has not been rising steadily either; methane levels have gone through periods of stagnation and even decline. Satellite and ice-core data show that from roughly 2000 to 2007, global methane levels were virtually flat. Since then, they’ve increased modestly but not alarmingly. If methane were on an unstoppable trajectory as claimed, we wouldn’t have seen that decade-long pause.

The core of the new study isn’t field observation but modeling. The authors openly describe their work as a “computational simulation” based on IPCC climate scenarios. They built a model using data from 767 sites across various climate zones and extrapolated those results to represent every lake and reservoir on Earth for the next 75 years. That’s an extraordinary leap. Such modeling exercises depend entirely on assumptions—about temperature change, biological response, and feedbacks—that cannot be verified. A model’s output is not data; it’s a hypothesis expressed in numbers. In this case, the model assumes that warming alone drives methane emissions upward in a near-linear fashion. But lake ecosystems are far more complex. Methane formation depends on oxygen availability, nutrient levels, sediment composition, microbial communities, and water depth. Temperature is only one variable among many, and in some systems, higher temperatures can even suppress methane production by increasing oxygen penetration or altering microbial competition.

Real lakes are also dynamic. Their surface temperatures fluctuate with wind, mixing, inflows, shading, and seasonal turnover. A small change in air temperature doesn’t necessarily translate into a proportional rise in sediment temperature where methane is generated. But models tend to smooth over these complexities, turning natural variability into tidy global averages. When that simplification is fed through multiple layers of climate scenario assumptions, it produces numbers that look precise but are, in fact, speculative.

The press release claims that before industrialization, methane emissions were “in balance” with natural breakdown processes and that climate change now threatens to “disturb” that equilibrium. That framing assumes there was ever a fixed baseline. In truth, methane levels have always fluctuated in response to natural factors like rainfall, vegetation shifts, and temperature cycles. Wetlands, lakes, and even termites are major methane sources, and their emissions have varied widely throughout history without any human influence. To describe the system as “out of balance” now is to misunderstand that natural balance is dynamic, not static.

Another red flag is the reliance on what the study itself calls the “IPCC’s warmest scenario”—the one that assumes massive fossil fuel expansion and unchecked emissions through 2100. Even the IPCC has quietly admitted that its so-called “worst case,” now known as SSP5-8.5, represents an implausible path that doesn’t match real-world energy or population trends. Yet that’s the foundation this methane projection stands on. When you start from an exaggerated premise, you end up with an exaggerated conclusion.

It’s also telling that the study was funded by the European Research Council, the Swedish Research Council, and NASA Earth Science programs—institutions that exist within the broader climate research ecosystem where funding and attention flow toward studies emphasizing risk and urgency. “Methane emissions stable” won’t make the news or attract new grants, but “methane doubling—worse than the IPCC’s worst case” certainly will. The incentive structure ensures that speculative modeling studies receive maximum visibility, while measured, data-driven assessments get buried.

And then there’s the rhetoric. The lead researcher is quoted as saying, “This study makes it even clearer that we really, really want to change the climate scenario as quickly as possible.” That isn’t scientific language; it’s advocacy.

Of course, he looks like another Mann clone:

A man with a beard, wearing a blue jacket, poses in a natural outdoor setting with blurred greenery and water in the background.
Professor David Bastviken at Tema M – Environmental Change, Linköping University, Sweden.

Science should describe what is, not prescribe what society “really, really” must do. When a model becomes a moral argument, the line between empirical research and policy lobbying has been crossed.

In the end, what we have here is not evidence of an impending methane catastrophe but another example of how climate modeling gets presented as certainty. Methane remains a trace gas with a small, transient role in atmospheric heating. Its natural sources and sinks are vast and variable, defying the kind of simplistic modeling that underpins this study. The suggestion that lakes and reservoirs will suddenly double their methane output by 2100 is speculation layered upon speculation.

So, when you see headlines warning that “warmer lakes could worsen the IPCC’s worst case,” remember what’s really being described: a model of a model of a model. The numbers aren’t measurements, the future isn’t data, and the atmosphere isn’t listening. Methane may bubble quietly from lakebeds, but the real gas here is the hot air coming from yet another round of climate conjecture dressed up as discovery.

Long-lasting La Niña events more common over past century

Global temperatures typically increase during an El Niño episode, and fall during La Niña’ – says BBC Science. This article also refers to ‘El Niño and La Niña, the warm and cool phases of a recurring climate pattern’. The featured research concludes that recent La Niñas are different, being more to do with warming, supported by ‘complex computer simulations’. The question is: does ‘the recent increase in multiyear La Niñas’ (per the study title) since 1998 suggest more cooling, or not? In the climate science world we read that ‘answers remain elusive’.

From Tallbloke’s Talkshop

 September 24, 2023 by oldbrew 

‘Global temperatures typically increase during an El Niño episode, and fall during La Niña’ – says BBC Science. This article also refers to ‘El Niño and La Niña, the warm and cool phases of a recurring climate pattern’. The featured research concludes that recent La Niñas are different, being more to do with warming, supported by ‘complex computer simulations’. The question is: does ‘the recent increase in multiyear La Niñas’ (per the study title) since 1998 suggest more cooling, or not? In the climate science world we read that ‘answers remain elusive’.
– – –
Multiyear La Niña events have become more common over the last 100 years, according to a new study led by University of Hawai’i (UH) at Mānoa atmospheric scientist Bin Wang.

Five out of six La Niña events since 1998 have lasted more than one year, including an unprecedented triple-year event [Talkshop comment – no, occurred three times since 1950]. The study was published in Nature Climate Change.

“The clustering of multiyear La Niña events is phenomenal given that only ten such events have occurred since 1920,” said Wang, emeritus professor of atmospheric sciences in the UH Mānoa School of Ocean and Earth Science and Technology.

El Niño and La Niña, the warm and cool phases of a recurring climate pattern across the tropical Pacific, affect weather and ocean conditions, which can, in turn, influence the marine environment and fishing industry in Hawai’i and throughout the Pacific Ocean.

Long-lasting La Niñas could cause persistent climate extremes and devastating weather events, affecting community resilience, tourist industry and agriculture.

Determining why so many multiyear La Niña events have emerged recently and whether they will become more common has sparked worldwide discussion among climate scientists, yet answers remain elusive.

Wang and co-authors examined 20 La Niña events from 1920-2022 to investigate the fundamental reasons behind the historic change of the multiyear La Niña. Some long-lasting La Niñas occurred after a super El Niño, which the researchers expected due to the massive discharge of heat from the upper-ocean following an El Niño.

However, three recent multiyear La Niña episodes (2007–08, 2010–11, and 2020–22) did not follow this pattern.

They discovered these events are fueled by warming in the western Pacific Ocean and steep gradients in sea surface temperature from the western to central Pacific.

“Warming in the western Pacific triggers the rapid onset and persistence of these events,” said Wang. “Additionally, our study revealed that multiyear La Niña are distinguished from single-year La Niña by a conspicuous onset rate, which foretells its accumulative intensity and climate impacts.”

Results from complex computer simulations of climate support the observed link between multiyear La Niña events and western Pacific warming.

Full article here.
– – –
Research article: Understanding the recent increase in multiyear La Niñas.

Historical change of La Nina shows increasing frequency of multiyear events. Credit: Wang, et al., 2023

IPCC Guilty of “Prosecutor’s Fallacy”

“Given the observed temperature increase, and the output from their computer simulations of the climate system, the IPCC rejected the idea that less than half the warming was man-made. They said there was less than a 5% chance that this was true.”

From Science Matters

By Ron Clutz

IPCC made an illogical argument in a previous report as explained in a new GWPF paper The Prosecutor’s Fallacy and the IPCC Report.  Excerpts in italics with my bolds and added images.

London, 13 September – A new paper from the Global Warming Policy Foundation reveals that the IPCC’s 2013 report contained a remarkable logical fallacy.

The author, Professor Norman Fenton, shows that the authors of the Summary for Policymakers claimed, with 95% certainty, that more than half of the warming observed since 1950 had been caused by man. But as Professor Fenton explains, their logic in reaching this conclusion was fatally flawed.

“Given the observed temperature increase, and the output from their computer simulations of the climate system, the IPCC rejected the idea that less than half the warming was man-made. They said there was less than a 5% chance that this was true.”

“But they then turned this around and concluded that there was a 95% chance
that more than half of observed warming was man-made.”

This is an example of what is known as the Prosecutor’s Fallacy, in which the probability of a hypothesis given certain evidence, is mistakenly taken to be the same as the probability of the evidence given the hypothesis.

As Professor Fenton explains

“If an animal is a cat, there is a very high probability that it has four legs.
However, if an animal has four legs, we cannot conclude that it is a cat.
It’s a classic error, and is precisely what the IPCC has done.”

Professor Fenton’s paper is entitled The Prosecutor’s Fallacy and the IPCC Report.

What the number does and does not mean

Recall that the particular ‘climate change number’ that I was asked to explain was the number 95: specifically, relating to the assertion made in the IPCC 2013 Report of ‘at least 95% degree of certainty that more than half the recent warming is man-made’.  The ‘recent warming’ related to the period 1950–2010. So, the assertion is about the probability of humans causing most of this warming.

Before explaining the problem with this assertion, we need to make clear that (although superficially similar) it is very different to another more widely known assertion (still promoted by NASA) that ‘97% of climate scientists agree that humans are causing global warming and climate change’. That assertion was simply based on a flawed survey of authors of published papers and has been thoroughly debunked.

The 95% degree of certainty is a more serious claim.
But the  case made for it in the IPCC report is also flawed.

[Commment: In the short video above, Norman Fenton explains the fallacy IPCC committed.  Synopsis of example.  A man dies is a very rowdy gathering of young men.  A size 13 footprint is found on the body.  Fred is picked up by the police.  He admits to being there but not to killing anyone, despite wearing size 13 shoes.  Since statistics show that only 1% of young men have size 13 feet, the prosecutor claims a 99% chance Fred is guilty.  The crowd was reported to be on the order of 1000, so  there were likely 10 others with size 13 shoes.  So in fact there is only a 10% chance Fred is guilty.]

The flaw in the IPCC summary report

It turns out that the assertion that ‘at least 95% degree of certainty that more than half the recent warming is man-made’ is  based on the same fallacy. In my article about the programme, I highlighted this concern as follows:

The real probabilistic meaning of the 95% figure. In fact it comes from a classical hypothesis test in which observed data is used to test the credibility of the ‘null hypothesis’. The null hypothesis is the ‘opposite’ statement to the one believed to be true, i.e. ‘Less than half the warming in the last 60 years is man-made’. If, as in this case, there is only a 5% probability of observing the data if the null hypothesis is true, the statisticians equate this figure (called a p-value) to a 95% confidence that we can reject the null hypothesis.

But the probability here is a statement about the data given the hypothesis. It is not generally the same as the probability of the hypothesis given the data (in fact equating the two is often referred to as the ‘prosecutors fallacy’, since it is an error often made by lawyers when interpreting statistical evidence).

IPCC defined ‘extremely likely’ as at least 95% probability.  The basis for the claim is found in Chapter 10 of the detailed Technical Summary, which describes various climate change simulation models, which reject the null hypothesis (that more than half the warming was not man-made) at the 5% significance level. Specifically, in the simulation models, if you assumed that there was little man-made impact, then there was less than 5% chance of observing the warming that has been measured. In other words, the models do not support the null hypothesis of little man-made climate change. The problem is that, even if the models were accurate (and it is unlikely that they are) we cannot conclude that there is at least a 95% chance that more than half the warming was man-made, because doing so is the fallacy of the transposed conditional.

The illusion of confidence in the coin example comes from ignoring (the ‘prior probability’) of how rare the double-headed coins are. Similarly, in the case of climate change there is no allowance made for the prior probability of man-made climate change, i.e. how likely it is that humans rather than other factors such as solar activity cause most of the warming. After all, previous periods of warming certainly could not have been caused by increased greenhouse gases from humans, so it seems reasonable to assume – before we have considered any of the evidence – that the probability humans caused most of the recent increase in temperature to be very low. 

Only the assumptions of the simulation models are allowed,
and other explanations are absent.

In both of these circumstances, classical statistics can then be used to deceive you into presenting an illusion of confidence when it is not justified.

New Paper Reveals Classic Logical Fallacy In IPCC Report

The alarmist media bought it at the time, which may well have been the idea.

From Tallbloke’s Talkshop

September 16, 2023 by oldbrew

The alarmist media bought it at the time, which may well have been the idea.
– – –
A new paper from the Global Warming Policy Foundation reveals that the IPCC’s 2013 report contained a remarkable logical fallacy, says Climate Change Dispatch.

The author, Professor Norman Fenton, shows that the authors of the Summary for Policymakers claimed, with 95% certainty, that more than half of the warming observed since 1950 had been caused by man.

But as Professor Fenton explains, their logic in reaching this conclusion was fatally flawed.

“Given the observed temperature increase, and the output from their computer simulations of the climate system, the IPCC rejected the idea that less than half the warming was man-made. They said there was less than a 5% chance that this was true.”

“But they then turned this around and concluded that there was a 95% chance that more than half of observed warming was man-made.”

This is an example of what is known as the Prosecutor’s Fallacy, in which the probability of a hypothesis given certain evidence is mistakenly taken to be the same as the probability of the evidence given the hypothesis.

As Professor Fenton explains:

If an animal is a cat, there is a very high probability that it has four legs. However, if an animal has four legs, we cannot conclude that it is a cat. It’s a classic error, and is precisely what the IPCC has done.”

Source here.

Another Day, Another Alarm: The ‘Time-Travelling’ Pathogen Paranoia

Grab your popcorn, folks! The curtain is up and we’re being treated to the latest in a long line of climate alarmist productions: the tale of ancient, frozen pathogens wreaking havoc on our unsuspecting modern world. According to a new study published in PLOS Computational Biology, these ‘time-travelling’ pathogens could emerge from the melting ice and permafrost due to climate change, posing significant threats to ecosystems and humanity itself.

From Watts Up With That?

Grab your popcorn, folks! The curtain is up and we’re being treated to the latest in a long line of climate alarmist productions: the tale of ancient, frozen pathogens wreaking havoc on our unsuspecting modern world. According to a new study published in PLOS Computational Biology, these ‘time-travelling’ pathogens could emerge from the melting ice and permafrost due to climate change, posing significant threats to ecosystems and humanity itself.

Climate change could hasten the release of ‘time-travelling’ pathogens from melting permafrost and ice that have been trapped for millennia. Their emergence increases threats to the global environment and even humanity itself.

While melting glaciers and permafrost risk the re-emergence of many types of dormant pathogens, the potential destruction to modern ecosystems posed by these microbes has been difficult to predict.

https://www.eurekalert.org/news-releases/996618

According to Dr. Giovanni Strona, lead author of the study,

“The scientific debate on the topic has been dominated by speculation, due to the challenges in collecting data or designing experiments to elaborate and test hypotheses. For the first time, we provide an extensive analysis of the risk posed to modern ecological communities by these ‘time-travelling’ pathogens through advanced computer simulations.”

https://www.eurekalert.org/news-releases/996618

The researchers have run some impressive-sounding digital simulations, pitting modern microbial communities against their ancient counterparts and observing the ensuing chaos.

Of course, the inevitable doomsday results are presented. The study reveals that

“about 1% of those invaders presented unpredictable results — some caused up to one third of the host species to die out, while others increased diversity by up to 12% compared to the simulations where escape was not permitted.”

https://www.eurekalert.org/news-releases/996618

For the uninitiated, it might sound like we’re on the cusp of an ecological apocalypse. But for those who’ve seen this show before, it’s the same old fear-mongering script dressed up with different props.

As is so often the case, the devil is in the details. These “computer simulations” are just that – simulations, not reality. As all mathematicians and scientists worth their salt know, any model is only as good as its inputs and assumptions. Simulating the interactions of long-dormant pathogens with modern ecosystems involves countless variables and uncertainties.

Flinders University Professor Corey Bradshaw furthers the climate catastrophe narrative by suggesting that the release of these pathogens is “not negligible” and warns that

“in the worst, but still entirely plausible case, the invasion of a single ancient pathogen reduced the size of its host community by 30% when compared to our non-invasive controls.”

https://www.eurekalert.org/news-releases/996618

Yet he conveniently fails to mention the wide range of outcomes these simulations produced, focusing solely on the ‘worst-case’ scenarios that fuel the most fear.

Interestingly, the researchers admit that the risks from these pathogens might seem small, given that they are based on just 1% of their simulations. However, they quickly follow this concession with an attempt to amplify fear by asserting that

“given the sheer number of ancient microbes regularly released into modern communities, these outbreaks represent a substantial danger.”

https://www.eurekalert.org/news-releases/996618

While they don’t specifically mention it, this is another case of Climate Alarmists using the logic of Pascal’s Wager in policy debates. What these “scientists” fail to appreciate when accepting the logic of the wager, is that in order to be logically consistent they now must attend church religiously and become pious Christians. You can’t pick and choose when you apply the logic. It either is valid or it isn’t.

Are these so-called ‘time-travelling’ pathogens really the significant threat we’re being led to believe, or just another piece in the alarmist puzzle, designed to generate fear and secure more funding for climate-related research?

Science should not be a tool for manipulation and alarmist propaganda. We must demand better from those who seek to inform us, insisting they do so in a manner that respects the complexities and uncertainties inherent in their work, rather than resorting to simplified scare tactics.

Readers, what are your thoughts on this latest climate alarmist tale? Drop your comments below.

JOURNAL

PLoS Computational Biology

DOI

10.1371/journal.pcbi.1011268 

METHOD OF RESEARCH

Computational simulation/modeling

SUBJECT OF RESEARCH

People

ARTICLE TITLE

Time-travelling pathogens and their risk to ecological communities

No, the Earth Did Not have an ‘Unprecedented and Terrifying … All-Time High Temperature’ on July 4th

On July 3rd and 4th and the following days, multiple mainstream media outlets ran stories claiming that the Earth had experienced an unprecedented hot day(s). This is false. The data they cited was not official data, but from a private website and investigation shows the claim was a gross error.

From ClimateRealism

By Anthony Watts

On July 3rd and 4th and the following days, multiple mainstream media outlets ran stories claiming that the Earth had experienced an unprecedented hot day(s). This is false. The data they cited was not official data, but from a private website and investigation shows the claim was a gross error.

Some sample headlines from that week are:

Yahoo News: ‘Unprecedented and terrifying’: World sets all-time high temperature record 2 days in a row

CNN: The planet saw its hottest day on record this week. It’s a record that will be broken again and again

Forbes: July 4 Was Earth’s Hottest Day In Over 100000 Years

UPI: Climate scientists: July 4 was hottest ever for average global temperature

CNBC: World registers hottest day since records began

In the CNBC article, reporter Sam Meredith wrote:

The planet’s average daily temperature climbed to 17.18 degrees Celsius (62.9 degrees Fahrenheit) on Tuesday, according to the University of Maine’s Climate Reanalyzer, an unofficial tool that is often used by climate scientists as a reference to the world’s condition.

“Monday, July 3rd was the hottest day ever recorded on Planet Earth. A record that lasted until … Tuesday, July 4th,” said Bill McGuire, professor emeritus of geophysical and climate hazards at University College London, via Twitter.

“Totally unprecedented and terrifying,” he added.

Apparently, all those people missed the fact that they were looking at the output of a climate model, not actually measured temperatures. Only one news outlet, The Associated Press, bothered to print a sensible caveat. In the July 5th story “Earth hit an unofficial record high temperature this week – and stayed there” reporting:

On Thursday, the National Oceanic and Atmospheric Administration distanced itself from the designation, compiled by the University of Maine’s Climate Reanalyzer, which uses satellite data and computer simulations to measure the world’s condition. That metric showed that Earth’s average temperature on Wednesday remained at an unofficial record high, 62.9 degrees Fahrenheit (17.18 degrees Celsius), set the day before.

The AP updated its story on July 7th to include this single yet very important paragraph:

NOAA, whose figures are considered the gold standard in climate data, said in a statement Thursday that it cannot validate the unofficial numbers. It noted that the reanalyzer uses model output data, which it called “not suitable” as substitutes for actual temperatures and climate records. The agency monitors global temperatures and records on a monthly and an annual basis, not daily.

So, in the space of two days, we went from temperature data that was “[t]otally unprecedented and terrifying,” to temperature data that was not suitable for purpose.

How did this happen? It was a chain of events involving “experts” on social media who first noticed this graph on climatereanalyser.org:

Figure 1: global temperature graph, July 4, 2023, from climatereanlyser.org

Note the uptick in black at the top, that’s supposedly proof of the hottest day ever in Earth’s history. Social media created a “viral” response to this, and the poorly trained yet climate narrative compliant mainstream media picked up the story and ran with it.

Some people, such as Ryan Maue, Ph.D., tried to put out the wrongheaded social media fire on Twitter. He notes that the climate model used isn’t even current, circa 2009/2011:

It seems the media, social and otherwise, saw what they expected to see and got fooled. They failed to check the source of the data before rushing to judgment.

Although, on July 8, the University of Maine’s Climate Reanalyzer website was forced to put up this notice on their global temperature page:

But even that claim is false, because in fact the NCEP CFSv2 used by Climate Reanalyzer and listed at the top of their graph, is in fact defined as a model according to its developer, NOAA:

The CFS version 2 was developed at the Environmental Modeling Center at NCEP. It is a fully coupled model representing the interaction between the Earth’s atmosphere, oceans, land, and sea ice.

So much for Climate Reanalyzer’s “not a model” claims. They simply “got caught with their pants down,” and the special notice was little more than damage control.

Even if the Climate Reanalyzer output had accurately reflected the temperature data recorded since satellites data began, there is no justification for the bizarre claims made by outlets such such as Forbes: “July 4 Was Earth’s Hottest Day In Over 100000 Years”

Note that in Figure 1, climatereanalyser.org only has data back to 1979. That makes the 100,000 year claim not just far-fetched, but impossible to verify or substantiate.

The mainstream media’s behavior in response to the claims made by Climate Reanalyzer made what should have been passed unnoticed as a bizarre outlier in climate data into headline news around the globe. This treatment was unjustifiable, a blatantly false portrayal by social media and mainstream media to push the climate crisis narrative forward. If the mainstream media had any integrity left, retractions would be published, yet there shamefully does not seem to be a single one.

Anthony Watts

Anthony Watts is a senior fellow for environment and climate at The Heartland Institute.

Watts has been in the weather business both in front of, and behind the camera as an on-air television meteorologist since 1978, and currently does daily radio forecasts.

He has created weather graphics presentation systems for television, specialized weather instrumentation, as well as co-authored peer-reviewed papers on climate issues.

He operates the most viewed website in the world on climate, the award-winning website wattsupwiththat.com.

Climate models behind Net Zero policies are ‘thoroughly flawed’

Crude corrections hide unrealistic physics.

From Net Zero Watch

Crude corrections hide unrealistic physics.

The world’s climate policies are based on computer simulations of the atmosphere that are thoroughly flawed. That’s the conclusion of a new paper published by Net Zero Watch.

The paper, by US climate writer Willis Eschenbach, describes the results of a review of the computer code inside NASA’s Model E climate simulation. It shows that, far from being based on basic physics, in many places the model incorporates crude corrections to make the output look vaguely reasonable.

Eschenbach says:

It’s clear that in many places the physics in the computer code is simply wrong and gives ludicrous output. But instead of fixing it, NASA scientists have simply put crude corrections to hide the problem. This destroys the credibility of NASA’s predictions.”

Andrew Montford, Net Zero Watch director said:

We know from the Covid debacle that computer models are no basis for public policy. It would be a pity if politicians refuse to learn that lesson and allow further damage to be inflicted on the public.” 

Eschenbach’s paper is available for download here.