The Neoglacial Period

The Neoglacial Period (also called neoglaciation or the Neoglacial) refers to a long-term cooling trend in Earth’s climate during the Holocene epoch. It describes the “renewed glaciation” or gradual return to cooler, wetter conditions following the warmest phase of the Holocene.

The Neoglacial Period (also called neoglaciation or the Neoglacial) refers to a long-term cooling trend in Earth’s climate during the Holocene epoch. It describes the “renewed glaciation” or gradual return to cooler, wetter conditions following the warmest phase of the Holocene.

From Watts Up With That?

By Andy May

Most agree that the Milankovitch cycles of eccentricity, obliquity, and precession drive long-term global and hemispheric climate changes, see figure 4 in this post for a brief description of them. The modern climate debate is about short-term climate change. The โ€œconsensusโ€ says that human emissions have caused โ€œthe most rapid changeโ€ or โ€œtemperatures are the warmest in X yearsโ€ (Lecavalier et al., 2017) and (IPCC, 2021, p. 8) with X varying from one thousand years to over 100,000 years. Obviously, we only have global instrumental data for the past 170 years or so, so any global or hemispheric data before then is either local or proxy temperature data.

The mainstream view is to ignore inconvenient data that shows CO2 and methane air concentrations do not correlate with temperature during the Holocene Epoch, or the past 12,000 years as shown in figure 4 here. Correlation is not causation, but the lack of correlation normally precludes causation. If changes in heat storage in the climate system are ignored, as is often done, then only outside forcing can cause climate change. Since recent climate changes (since 1950) have been too rapid to be caused by the Milankovitch orbital cycles, the only outside forces left are the Sun and greenhouse gases (GHGs). Since the oceans and atmosphere change the amount of heat they store, as opposed to emit to space, climate changes as climatic heat storage changes (Irvine, 2014). We can observe this in the 60-70-year climate or ocean oscillations, like the Atlantic Multidecadal Oscillation (AMO, see here and here).

The Sun and GHGs work differently. Solar radiation penetrates the ocean surface and warms the water at depth, storing heat in the ocean. GHGs absorb radiation emitted by Earth and mostly use it to warm gas molecules near them. Infrared emissions from GHGs cannot penetrate the ocean surface (Wong & Minnett, 2018). By warming the surface, they stimulate more evaporation sending a lot of the energy back to the atmosphere, although a small portion is circulated deeper by convection. Heat stored in the oceans stays in the climate system longer than storage in the atmosphere and change climate on decadal and century time scales (Irvine, 2014). This is seen in ocean oscillations. Changes in GHGs only affect the atmosphere and can only affect climate in the very short term. Theoretically temperature changes from the top of one 11-year solar cycle to the bottom is only about 0.02ยฐC due to the direct change in radiation reaching the Earth. However, the actual observed change is five times higher or 0.1ยฐC and the increase in the upper atmosphere is 0.3ยฐC. This is discussed in more detail here and (Hoyt & Schatten, 1997), (Lean, 2017), and (Haigh, 2011).

The Neoglacial

The Neoglacial period is not formally defined and its onset (that is the beginning of glacial growth in the late Holocene) varies with location. It is a global glacial advance (with the possible exception of Antarctica, see figure 1 and here) from the end of the Holocene Climatic Optimum. The important point is that the Neoglacial onset is not synchronous around the world (McKay et al., 2018). Here we begin the Northern Hemisphere Neoglacial at roughly 3,800BC, just after the Mid-Holocene Transition (MHT) from the Holocene Climatic Optimum (HCO). The literature has the Neoglacial starting anywhere from 2,000BC to 3,000BC, so my pick is a little early, but not excessively so.

When the chosen Neoglacial period begins the average latitude of the Intertropical Convergence Zone (ITCZ) shifts dramatically southward which initiates theย desertification of the Sahara. The average ITCZ latitude responds strongly to interhemispheric temperature gradients, and it shifts southward when the Northern Hemisphere cools as it did around 4,700BC (see figure 1ย here). For more on this dramatic change in climate seeย here, as well as (Wanner & Brรถnnimann, 2012) and (DeMenocal et al., 2000).

Regardless of complaints from the โ€œconsensus,โ€ the Neoglacial period may not have ended yet, it is still much colder today in the Northern Hemisphere than most of the Holocene as shown in the featured image of my previous post. Given the length, strength, and depth of the Neoglacial; it is hard to call its end after only seventy years of on-and-off warming. It will take another 100 to 200 years of warming to be sure we have really and truly ended the Neoglacial.

The first part of the Holocene, until around 4,000BC was quite warm, at least according to my favorite Northern Hemisphere proxies, the Vinther air temperature proxy (shown black in figure 1) and the Rosenthal Makassar Strait 500-meter proxy of Northern Pacific sea surface temperatures (SST, shown in blue). The lower part of figure 1 shows the number of global glacial advances from (Solomina et al., 2015) as a blue line and the central time and duration of solar grand minima (SGM, black dots) and solar grand maxima (SGMx, orange dots) from (Usoskin, 2017). Before the earliest SGMx shown (at 3860BC) there is not another until 6,120BC. Thus, the Holocene Climatic Optimum (HCO) is likely due to orbital cycles as long assumed and not due to solar maxima.

The Mid-Holocene Transition and the Neoglacial begin with a cluster of six SGMs and four SGMxs, so the sun was highly variable then. It might have played a role, along with the obvious orbital insolation forcings in the initiation of the Northern Hemispheric cooling, but the pattern is ambiguous as to its net effect on climate. Likewise, the 4.2 ka (thousand years ago) climate event does not correlate with the SGM before it or the SGMx after it, it must have other causes.

The overall picture of figure 1 shows a general decline in temperature as the number of glacial advances increases. The period from 2000BC to 500BC has little solar variability, but a strong 120-year SGM at 750BC and a dramatic increase in glacial advances. Right in the middle of these advances is the Bronze Age collapse in the eastern Mediterranean. The strongest SGM is centered on 1470AD, and it is accompanied with the maximum number of glacial advances, these are both just before the deepest part of the Little Ice Age from 1500 to 1750AD.

The spectacular 1177BC Bronze Age collapse (Cline, 2014) follows the 70-year SGM at 1385BC by almost 200 years, so it is unclear how much influence it might have had on that climate catastrophe. The Bronze Age collapse of eastern Mediterranean civilization led to the Greek Dark Age, and it did not end until the Roman Warm Period (RWP) began around 300BC, (some place the beginning later around 250BC). The RWP does not end until 400-500AD.

The Roman Warm Period saw the rise of the Roman Empire, the unification of China by Chโ€™in in 221BC, and it began just after the death of Alexander the Great. It also saw the rise of Indiaโ€™s greatest ancient emperor, Ashoka the Great who unified India for the first time around 266BC. Ashoka converted to Buddhism and promoted the spread of the religion. This period also includes the life of Jesus of Nazareth and the rise of Christianity.

The Roman Warm Period is notable because it coincides with three consecutive solar grand maxima and contains no solar grand minima. It is also within one of the longest periods in the Holocene without an SGM. The other such long gap, from 1385 to 2450BC, essentially marks the peak of the Bronze Age.

The European Dark Age can be identified by lower temperatures in the Vinther record between 500 and 800AD and an SGM at 690AD. The Medieval Warm Period exists between the SGM at 690AD and one at 1030AD and is more of a transitional period into the Little Ice Age than a true warm period like the RWP. The Little Ice Age has no SGMxs and four SGMs, with an exceptionally long one at 1470AD. The Vinther record reaches its coldest point at 1700AD and the North Pacific Rosenthal record is coldest at about 1810AD, so 1750AD is a reasonable Northern Hemisphere date for the modern warm period to begin. The last SGM is centered on 1680AD and it lasts from 1640 to 1720AD.

Once the last SGM is done, the next solar event is the Modern Solar Maximum centered on 1970 and from 1930 to 2010. It is the longest solar maximum since 3,170BC and the first solar maximum since 505AD.

Discussion

I am definitely not saying that solar variability is the only thing causing climate change and I do not think it is stronger than the Milankovitch orbital cycles (see figure 4 here). But, when we came out of the Little Ice Age, the coldest period in the entire Holocene Epoch, and a period with no solar grand maxima and four solar grand minima, including the strongest SGM (as measured by duration) in the Holocene, one has to consider that solar variability contributed to the Little Ice Age.

Then we must consider the Modern Warming Period. It coincides with the first solar grand maximum in 1,465 years and the strongest in 5,140 years. It seems quite reasonable to conclude that the modern solar grand maximum contributed to the observed recent climate changes. Climate change is a complex combination of the Milankovitch cycles, solar cycles, and (maybe) anthropogenic factors. It does not have just one cause at any time scale.

Download the bibliography here.

Unlearning Climate Alarmism โ€“ The Climate Realism Showย #191

Join The Heartland Instituteโ€™s Anthony Watts, Linnea Lueken, Jim Lakely, and special guest Anika Sweetland LIVE at 1 p.m. ET on YouTube, Rumble, X, and Facebook. Participate in the show by leaving your comments and questions in the chat.

The Heartland Institute

An encouraging trend is growing. Bright young people who were convinced of the truth of climate alarmist dogma open their eyes and mind to the actual data on the climate. Then they become climate realists, and even evangelists for science and truth. Anika Sweetland is one of those people. She is a former energy advisor with a degree in climate studies who gave an address on her awakening at Heartland’s World Prosperity Forum last month. And she’s one of the UK’s best public opponents of that country’s Net Zero policy and keeps a keen eye on the climate communism of the European Union.

Anika joins us to talk about her journey, and also comment on some of the Crazy Climate News of the week, including a proposal to chop down boreal forests in the far north and throw the wood into the Arctic Ocean, how stupid and counterproductive Californiaโ€™s aversion to oil refining really is, and how the European Union may be poised to make countering the climate alarmist narrative illegal.

Join The Heartland Instituteโ€™s Anthony Watts, Linnea Lueken, Jim Lakely, and special guest Anika Sweetland LIVE at 1 p.m. ET on YouTube, Rumble, X, and Facebook. Participate in the show by leaving your comments and questions in the chat.

Visit our sponsor, Advisor Metals: https://climaterealismshow.com/metals

Oklahoma smelter the first fruits of Trump aluminum policy

In May 2025, during a visit to the UAE, President Trump announced a strategic partnership that included commitments from Emirates Global Aluminium (EGA)- the world’s largest primary aluminum producer outside China- to invest billions in a new U.S. facility. This evolved into a joint venture announced on January 26, 2026, between EGA (majority stake) and Century Aluminum (U.S.- based, taking a 40% stake) to build a greenfield primary aluminum smelter in Inola, Oklahoma (near the Tulsa Port on the Verdigris River).

In May 2025, during a visit to the UAE, President Trump announced a strategic partnership that included commitments from Emirates Global Aluminium (EGA)- the world’s largest primary aluminum producer outside China- to invest billions in a new U.S. facility.

This evolved into a joint venture announced on January 26, 2026, between EGA (majority stake) and Century Aluminum (U.S.- based, taking a 40% stake) to build a greenfield primary aluminum smelter in Inola, Oklahoma (near the Tulsa Port on the Verdigris River).

This marks the first new primary aluminum smelter in the U.S. since 1980, ending a long “drought” in domestic capacity amid decades of offshoring, high energy costs, and cheap imports.

_________________________________________________________________________________________________________

From CFACT

By Duggan Flanakin

Just months after winning a $500 million grant from the Office of Clean Energy Demonstrations, Century Aluminum announced plans to construct and operate a new aluminum smelter in Inola, Oklahoma, that will have a production capacity of 500,000 tons per year of aluminum, including 20,000 tons of high-purity aluminum for defense applications.

Last May, President Trump, as part of his vision for reviving U.S. manufacturing industries, doubled tariffs on imported aluminum. The symbolic act (as the tariffs were later revised downward) echoed the Presidentโ€™s oft-stated view that along with steel, domestic aluminum is the backbone of both national security and economic independence.

Since the first U.S. aluminum smelter became operational in 1888 (just two years after the Hall-Heroult electrolytic smelting process was developed), the U.S. has been a world leader in supplying the lightweight, corrosion-resistant metal that helped transform multiple sectors of the U.S. and world economy.

The first hit on the U.S. aluminum industry came in the wake of the Arab oil embargo in 1979, as 1980 was the peak year for domestic smelting, at 908,000 metric tons. U.S. aluminum production, however, continued to climb into 1999, when about half of the 7.48 million metric tons was primary and half was secondary production.

Then, Enron happened.

As Reuters reporter Andy Home stated, a toxic combination of too little generation capacity, a chaotic pricing model, and the machinations of traders who manipulated a flawed system led to blackouts in California and a supernova hike in wholesale power prices. Aluminum smelting is a heavy power user, and all ten West Coast aluminum smelters shut down.

The final big blow to the U.S. aluminum industry came in the wake of the subprime crisis of 2008 that was like an earthquake for the U.S. automotive industry and brought about a collapse in aluminum demand. By 2016, 18 of the 23 aluminum plants in the U.S. operating in 1998 had permanently closed.

Shortly after President Trump was inaugurated for his first term, his first call for revival of the U.S. aluminum industry was rewarded when Alcoa announced it was reopening its Warwick smelter in Indiana. But in 2020, Alcoa shuttered its last remaining Pacific Northwest smelter, and the industry was again flailing against Chinese overproduction that submarined prices.

Today, the U.S. has just four operating aluminum plants with a combined output of 683,500 metric tons per year โ€“ while in 2024 the U.S. imported 5.46 million metric tons of aluminum.

Back in 2017, Home noted that import tariffs on aluminum could play a key role in returning aluminum production back to the U.S. But, he added, โ€œwhen it comes to aluminum, โ€˜made in Americaโ€™ needs to be powered in America โ€“ and thatโ€™s down to local utilities, not national policy.โ€

Home could not have foreseen that the Trump team in 2025 would make affordable electric energy a matter of national policy whether or not local utilities played along.

In 2025, the Trump White House did not just suggest โ€“ it demanded โ€“ that high energy users develop independent power sources [including nuclear] to keep their costs stable without interfering with other users of the electric grid.

In short, the reindustrialization of the U.S. will depend on corporate and government microgrids.

The December 2025 White House policy brief on aluminum states that the U.S. must develop a national strategy to prioritize, produce, and defend critical materials like aluminum. It further states the U.S. aluminum industry is poised for growth, given that global demand for aluminum is expected to grow by 80% through 2050 (according to the International Aluminium Institute).

The proposed Trump strategy rests on four pillars. First, pursue strong, targeted trade enforcement to defend U.S. aluminum manufacturers from Chinese and other non-market actors while leveraging trade with national security partners. That has been a major focus of Trumpโ€™s tariff policies.

Second, collect and keep more aluminum for America by strengthening recycling infrastructure and pursuing policies that grow scrap retention, collection, and sortation. [And you thought Trump wasnโ€™t green!]

Third, recognize aluminum as critical for economic and national security through a national strategy that will secure aluminum supply chains; ensure access to efficient, reliable, affordable energy; and eliminate reliance on materials from non-market or adversarial countries.

And, finally, invest in America by investing in aluminum with common-sense tax policies that open the door to even greater private investment by aluminum companies.

President Trump has called out Chinaโ€™s unfair trade practices as the biggest threat to U.S. aluminum manufacturing. He cited an Organization of Economic Cooperation and Development analysis showing that China has supported its domestic industry with more than $60 billion in government subsidies in recent years.

Without China, the U.S. relies on Canada (via a Section 232 tariff exemption) for much of the aluminum its industries need โ€“ but the Canadian government has just sworn its allegiance to China, and U.S.-Canadian relations are at an all-time low.

Politically influenced strictures on U.S. aluminum imports make the Trump administrationโ€™s efforts on aluminum recycling all the more important. While the U.S. aluminum industry has invested more than $10 billion into increasing domestic capacity over the last decade, the industry relies on recycled material for more than 80% of its feedstock.

The good news is that aluminum can be infinitely recycled and that 75% of all the aluminum ever produced is still in use today.

Instead of sending $1 billion worth of aluminum beverage cans alone into landfills every year, the White House is calling for investments in recycling infrastructure and support policies โ€“ including recycling refund and extended producer responsibility (EPR) systems to increase consumer aluminum recycling.

This, says the policy brief, would support manufacturing jobs, increase U.S. independence in metal supply, save domestic energy, and minimize the industryโ€™s impact on the environment.

But thatโ€™s not all.

President Trump wants the aluminum industry to invest in sorting technology and infrastructure to separate waste by material, then by alloy type, to foster an expansion of what can be recycled. This could keep more aluminum onshore and more readily available.

The chief reason for maximizing recycled aluminum is that only about 5% of the energy needed to manufacture new aluminum is needed to remanufacture recycled aluminum.

On the other hand, the Trump proposal calls for bringing new, affordable electricity generation online for smelters to lower the current 40% of production costs for primary smelting. Thatโ€™s why the plan also calls for supporting natural gas production and pipeline expansion that utilizes abundant U.S. energy resources.

Taken as a whole, revitalizing the U.S. aluminum industry is something even the millions of Americans can help accomplish.

Imagine Joe Sixpack โ€“ helping save America one beer can at a time!

This article originally appeared at Real Clear Energy

January 2026 Winter Storm Impacts on New York Grid

The January 2026 winter storm stressed electric systems across the country. It also offers electric resource planners an opportunity to examine the impacts of future increased use of renewable energy during high-load conditions. This article takes an initial look at the potential impact of such a weather event on the future New York electric system that relies on wind and solar.

By Roger Caiazza

The January 2026 winter storm stressed electric systems across the country. It also offers electric resource planners an opportunity to examine the impacts of future increased use of renewable energy during high-load conditions.  This article takes an initial look at the potential impact of such a weather event on the future New York electric system that relies on wind and solar.

There have been other articles about the January 23-27 winter storm impact on the electric grid.  Isaac Orr and Mitch Rolling described impacts to MISO, ISO-New England, ERCOT, and PJM.  They noted that there were no blackouts due to a lack of power generation possibly because โ€œthe storm didnโ€™t bring on the high demand that previous winter storms brought inโ€.  David Middleton covered the storm impacts on ERCOT noting that fossil generation provided the power when renewables were unavailable. 

This article looks at the storm impacts on the New York grid and how a similar storm would affect the future grid of the state when the Climate Leadership & Community Protection Act (Climate Act) requirements for a 2040 zero-emissions grid kick in.

I relied on two sources of New York Independent System Operator (NYISO) data for this analysis.ย  New York fuel-mix load data are available at the NYISOย Real-Time Dashboard.ย  The second source of data is the Operations Performance Metrics Monthly Report prepared by the NYISOย Operating Committee.ย  I looked at data from January 22-31, 2026, to bound conditions before the storm and after.ย  Note that the cold weather went into February but the Metrics Report data for February is not available so I did not include February data in my evaluation.

New York Grid Impacts

The dashboard real-time fuel mix data includes links to current and historical five-minute generation (MW) for energy generated in New York State.  I processed that data to calculate hourly averages as described in a post on my blog.  Figure 1 graphs all the fuel mix hourly data. The relative average fuel mix energy provided over these ten days was nuclear 18%, hydro 14%, and fossil fuels 61% for a total of 93%. Six years after passing the net-zero transition legislation New York only got 7% of its energy over the last ten days of January from wind and solar.

Figure 1: Hourly NYISO Realtime Fuel Mix January 22 to January 31, 2026

I used the January  Operations Performance Metrics Monthly Report for this analysis.  This report includes a graph of net wind and solar performance.  It describes the wind; utility-scale solar, also known as Front of the Meter (FTM) solar; and the rooftop top solar also known as Behind the Meter (BTM) solar total daily production and capacity factors. 

Figure 2: Net Wind and Solar Performance Total Daily Production and Capacity Factors

Source: NYISOย JanuaryOperations Performance Metrics Monthly Report

In New York the winter storm impacts started on the night of 24 January and total snow/sleet accumulation ranged from 8-13โ€ near the coast and 12-17โ€ across the interior.  As the precipitation ended a glaze of freezing rain occurred.  Following the storm there was a period of prolonged sub-freezing weather.  Figure 2 clearly shows the impact of snow on all solar production with no solar production on January 25.

Table 1 consists of three smaller tables.  On the left,  capacity factors derived from Figure 2 are listed for each day of the episode.  At the top, resource capacity (MW) from the Operations Performance Metrics Monthly Report are listed for solar and wind resources.  The main body of the table lists the calculated renewable daily energy (MWh) for each parameter and the renewable percentage of the total system energy that I calculated using the real-time fuel mix data.

Table 1: Capacity Factors Derived from Figure 5, Resource Capacity (MW) from Operations Performance Metrics Monthly Report, and Calculated Renewable Daily Energy (MWh)

The total renewable output in Table 2 is notable.  On average, wind resources counterbalance low winter solar resource availability.  However, during dark doldrums when the wind fails renewable resources plummet.  If such a period occurs after a significant snowstorm, then total renewable resources approach zero.

I have previously described the challenge of the gap between renewable energy production and peak loads and the potential solution.  The New York entities responsible for the electric system all agree that a new category of generating resources called Dispatchable Emissions-Free Resources (DEFR) is necessary to keep the lights on during periods of extended low wind and solar resource availability. The observed eight consecutive days where wind and solar resource availability was less than 6% of the potential capacity is a perfect example of the conditions that necessitate this new resource.

Electric System Projections

I used these results to evaluate projections made for the generating resources necessary to meet the 2040 100% zero emissions electric generation mandate. Table 2 lists the projected 2040 capacity (MW) for four scenarios that have been developed for the 2040 New York electric system.  I have included one scenario from the NYISO, the primary projection scenario from the Scoping Plan that outlined how the Climate Act 2040 mandate could be achieved, and two โ€œNet Zeroโ€ scenarios from the draft New York Energy Plan developed last summer.  These scenarios represent four ways to achieve the 2040 mandate for zero emissions electric generation.

Table 2: Projected Electric Resource Capacity (MW) in 2040.

I detailed the process to estimate the impact of this storm on these resources if you are interested in more details.  I estimated the daily energy production for the projected generating resources in Table 2. Daily production equals the capacity in MW times the capacity factor times 24 hours in the day. Capacity factors were derived from the real-time fuel mix or taken from the Operations Performance Metrics Monthly Report data in Table 1. 

I estimated the 2040 daily energy production for each scenario by multiplying those factors by the Table 2 resource capacities.  Table 3 is an example of the daily production for the weather over this period.  Note that consistent with the zero-emissions mandate there are no fossil fuel (Gas and Fuel Oil) emissions.  Consistent with the NYISO projection for the winter peak, no imported hydro generation is included.  I calculated the battery storage energy production by multiplying the projected capacity times four hours (the current default discharge time).  This assumption is included every day but note that if the batteries need to be charged using renewables there are instances where there would be insufficient energy to recharge the batteries.  Finally, note that in this example, no DEFR production was assumed.

Table 3: Daily Production (MWh) for January 22, 2026

The goal was to compare the observed daily observed energy load against the projected energy projection for daily production in Table 3 to see if the resources provided enough energy to cover the observed generation load from the real-time fuel mix data during the conditions of the January 2026 storm.  Using the existing total load I found that weather like five days from Jan 22-31 created conditions in which resources excluding DEFR were unable to provide enough power generation to cover the January 2026 loads.  The NYISO 2025 Load & Capacity Data Report notes that New York electric system is projected to increase winter peaking load due to electrification, primarily from space heating and EVs.  When I accounted for that increase in load, none of the scenarios provided enough power from January 24-31 to prevent blackouts.

These results show that DEFR is necessary. When I included the DEFR resources operating at a capacity factor of 85% most scenarios provided enough generation to cover expected load  Because no DEFR technology has been identified the capacity factor value is arbitrary.  The one scenario exception to this was the โ€œNet Zero Bโ€ option that never showed a surplus even with a 100% capacity factor.  My analysis found that at least 20GW of DEFR would be necessary to prevent a generation shortage if these conditions were to occur in 2040 for these capacity projections.

Dark Doldrum and DEFR

The most notable finding in Table 1 is the observation that there were eight consecutive days when the total New York wind and solar production was 6% or less than maximum possible energy production.  This is a perfect example of what the Germans call โ€œDunkelflauteโ€.  That term refers to dark doldrum periods when solar is reduced due to the length of day or clouds and there are light winds.  This event was exacerbated by the snowstorm that covered solar panels with enough snow to eliminate production (Figure 2).  Note that most rooftop solar in New York City is essentially flat so snow cover is a significant issue.  In this case the loss of solar was exacerbated by the snow depth, a crust of ice from a glaze of freezing rain that occurred at the end of the storm, and the subsequent period of prolonged sub-freezing weather. Perhaps we should amend the worst weather label to โ€œsnowy dark doldrumsโ€.

These conditions are the fundamental driver of the need for DEFR.  It is disappointing that the clean energy advocates have continued to argue that the size of the DEFR gap has been overstated even after all the agencies responsible for electric system reliability argue otherwise.  These results should put those arguments to rest.

Conclusion

Large projected wind and solar capacities do no good when the sun doesnโ€™t shine and the wind doesnโ€™t blow.  During and following the January winter storm there were at least eight consecutive days when the New York total wind and solar production was less than 6% of the capacity available.  These are the conditions that require DEFR.  Without DEFR, intermittent, diffuse, and correlated electric generating resources are not viable.  Given that there is no commercially available DEFR technology available, proceeding under the assumption that one will magically appear is risky.


Roger Caiazza blogs on New York energy and environmental issues at Pragmatic Environmentalist of New York.  This represents his opinion and not the opinion of any of his previous employers or any other company with which he has been associated.

EPA endangerment finding repeal & Potomac River sewage crisis

In Episode 542 of District of Conservation, Gabriella discusses two trending news stories: the repeal of the 2009 endangerment finding and the Trump administration stepping in to resolve the Potomac River sewage crisis that began on January 19th, 2026. Tune in to learn more!

From CFACT

By Gabriella Hoffman

โ€œThe Endangerment Finding has been the source of 16 years of consumer choice restrictions and trillions of dollars in hidden costs for Americansโ€ฆ Referred to by some as the โ€˜Holy Grailโ€™ of the โ€˜climate change religion,โ€™ the Endangerment Finding is now eliminated. The Trump EPA is strictly following the letter of the law, returning commonsense to policy, delivering consumer choice to Americans and advancing the American Dream. As EPA Administrator, I am proud to deliver the single largest deregulatory action in U.S. history on behalf of American taxpayers and consumers. As an added bonus, the off-cycle credit for the almost universally despised start-stop feature on vehicles has been removed.โ€ โ€” EPA Administrator Lee Zeldin, February 12, 2026

In Episode 542 of District of Conservation, Gabriella discusses two trending news stories: the repeal of the 2009 endangerment finding and the Trump administration stepping in to resolve the Potomac River sewage crisis that began on January 19th, 2026. Tune in to learn more!

Listen on Apple Podcasts

EP 579: BAAJA Blast: Permitting Reform or Bust – District of Conservation

In Episode 579 of District of Conservation, Gabriella discusses the permitting reform bill – aka BAAJA – that is gaining traction in Congress now. The Senate will hold a cloture vote starting at 3:30pm ET in a motion to proceed. Gabriella discusses the status quo without permitting reform, how BAAJA is good for the environment and affordability. Tune in!SHOW NOTESBipartisan Policy Center: BAAJA ExplainerEstimating the US Energy System Impacts of the Bipartisan American Affordability and Jobs Act
  1. EP 579: BAAJA Blast: Permitting Reform or Bust
  2. EP 578: Midterms, CO Amendment 83, Disneyland Goes Electric
  3. EP 577: Kaylyn Glenn – Florida Gladeswoman & Conservationist
  4. EP 576: Chiricahua National Park & Energy Security Index
  5. EP 575: Menhaden Madness (ft. Whit Fosburgh, Forage Fish Campaign)

Listen on Spotify Podcastshttps://open.spotify.com/episode/17G6ABR9L8AFPFVHXVZnbW?si=nzt01LK_RSq3Ktzl3-KvxA

SHOW NOTES

โ Trump Administration to Repeal Endangerment Finding and Advance Historic Deregulationโ 

โ President Trump Delivers Biggest Regulatory Relief in Historyโ 

โ Ryan Maue on Endangerment Finding Being Administrativeโ 

โ What is the Potomac Interceptor?โ 

โ Poo-thetic: Networks Refuse to Cover Largest Sewage Spill in U.S. Historyโ 

โ Katie Pavlich News Nation Coverage of Potomac Sewage Disasterโ 

โ Trump directs federal authorities to protect Potomacโ โ  DC Water CEO writes open letter on Potomac sewage spillโ 

โ Government agencies less likely than private firms to comply with environmental regulations

Big Auto’s Bitter Pill: The Electric Boom Has Hit the Wall

A growing industry consensus that the rapid, widespread adoption of electric vehicles (EVs) – once projected as an imminent revolution – has stalled significantly, prompting major automakers to take massive financial hits and scale back ambitious plans.

A growing industry consensus that the rapid, widespread adoption of electric vehicles (EVs) – once projected as an imminent revolution – has stalled significantly, prompting major automakers to take massive financial hits and scale back ambitious plans.

In the past year, global carmakers have written off more than $60 billion from their balance sheets related to EV over-investments.

Ford: Around $19.5 billion in restructuring and pullbacks (with EV models like the F-150 Lightning and Mustang Mach-E seeing sales reverse in 2025).

Stellantis (Vauxhall/Opel owner): โ‚ฌ22 billion.

General Motors: Around $6-7.6 billion.

Others like Volkswagen, Honda, and Volvo also taking multi-billion hits.

Ford’s CEO Jim Farley is quoted as saying, “I think the customer has spoken. That’s the punchline,” after the company reported a $5 billion loss in its EV division for 2025.

_________________________________________________________________________________________________________

Even auto giants know it: the electric car boom is out ofย charge

Worldโ€™s biggest manufacturers write off billions as they retreat from an EV boom that never was

โ€œI think the customer has spoken. Thatโ€™s the punchline,โ€ said Jim Farley, the chief executive of Ford. The Telegraph has the story.

The American boss was speaking last week as his company unveiled a $5bn (ยฃ3.7bn) annual loss, barely two months after it had booked a shock $19.5bn write-down.

The cause?

An aggressive bet on electric vehicles (EVs) that backfired spectacularly.

In 2025, sales of the Mustang Mach-E crossover and the F-150 Lightning pickup truck โ€“ once hailed by Farley as the โ€œtruck of the futureโ€ โ€“ went into reverse.

Worse, the electric Model-E division has booked losses of more than $13bn since 2023.

Now it has consigned the F-150 to the dustbin and has scrapped much of its future EV plans, with the company set to put a greater emphasis on hybrids.

Ford isnโ€™t the only automotive giant counting the costs of a failed bet on electric.

In the past year, the worldโ€™s biggest carmakers have written off more than $60bn from their balance sheets as they retreat from an EV boom that never was.

The figure includes a โ‚ฌ22bn (ยฃ19bn) charge reported by Vauxhall owner Stellantis, along with a $7.6bn hit to General Motors, โ‚ฌ5.1bn at Volkswagen Group, $4.5bn at Honda and $1.2bn at Volvo, among others.

โ€œMost of the Western carmakers are now facing big issues,โ€ says Felipe Muรฑoz, of Car Industry Analysis.

Broadly speaking, EV sales are growing. But a rapid shift to electric that both carmakers and politicians had hoped for has failed to materialise. โ€œMany drivers are still not comfortable making the shift,โ€ says Muรฑoz.

At the same time, net zero regulations are beginning to bite in the UK and Europe โ€“ with companies facing fines if they cannot meet increasingly stretching targets โ€“ just as low-price competitors from China have arrived to undercut them.

Many of those Chinese manufacturers are themselves trying to outrun a crisis, as sales at home grind to a halt.

All across the world, a grim reality for carmakers is setting in: drivers simply donโ€™t want EVs in the volume they hoped.

Read the full story here.
_________________________________________________________________________________________________________

In late 2025 and early 2026, major legacy automakers announced massive write-downs totaling around $55-65 billion globally (estimates vary slightly by source, with some broader analyses reaching higher when including ongoing losses). These reflect scaled-back EV investments, canceled models, impaired platforms/factories, supplier contract settlements, and strategic resets.

Key Examples of Major Write-downs (Late 2025โ€“Early 2026). Here’s a breakdown of the biggest hits reported:

AutomakerWritedown/Charge AmountTiming/DetailsKey Reasons/Impacts
Stellantis (Jeep, Ram, Chrysler, Fiat, Peugeot)~$26 billion (โ‚ฌ22.2 billion)Announced February 6, 2026; largest single charge, tied to “business reset” in H2 2025Overestimated EV pace; realignment to gas/hybrids; includes โ‚ฌ14.7B in product/platform impairments + โ‚ฌ6.5B restructuring (cash over 4 years). Led to net loss of โ‚ฌ19-21B in H2 2025; suspended 2026 dividend; shares plunged 20-30%.
Ford$19.5 billionAnnounced December 2025; covers canceled models (e.g., F-150 Lightning changes) and asset disposalsPivot to hybrids/extended-range; Model e division lost $4.8B in 2025 (ongoing losses expected $4-4.5B in 2026); total EV losses since 2022 exceed $16B; break-even pushed to 2029.
General Motors (GM)$7-7.6 billionAnnounced January 2026 (part of $7.1-8.8B in charges)Reduced EV capacity; canceled programs (e.g., BrightDrop vans); supplier settlements; more charges expected in 2026.
Others (e.g., Volkswagen, Honda, Volvo, Porsche)$3-6B+ each (contributing to total)Scattered announcements (e.g., VW ~$3.5-6B linked to Porsche/EV overhaul)Excess capacity, delayed models, job cuts; broader industry tally pushes to $55-65B+.

These are mostly non-cash (impairments reduce asset values on the balance sheet without immediate cash outflow), but portions involve real cash (e.g., supplier payouts, restructuring). They hit reported earnings hard, often leading to quarterly/full-year net losses.

Financial Health:

  • Balance Sheet Strain: Writedowns erode equity/book value and can trigger credit downgrades (e.g., Stellantis downgraded in February 2026 due to lower projected margins and cash flow recovery delays).
  • Profitability Hit: Massive one-time losses drag down net income (e.g., Stellantis expects low single-digit margins in 2026; Ford’s adjusted EBIT fell sharply).
  • Cash Flow & Liquidity: Some cash outflows (e.g., Stellantis’ โ‚ฌ6.5B+ over years) require bond issuances or dividend cuts to preserve liquidity.
  • Stock Market Reaction: Shares often drop sharply on announcements (Stellantis -20-30%; broader sector pressure), though some rebound if investors view the reset as clearing the deck (e.g., GM stock surged post-charge due to strong cash generation elsewhere).

Strategic Shifts:

  • Pivot from “all-in” EVs to hybrids, plug-in hybrids, or extended-range models as bridges.
  • Delayed/canceled pure-EV projects, reduced production capacity, job cuts, and supplier impacts.
  • Focus on profitable segments (e.g., trucks/SUVs in U.S., where demand remains strong).
  • Acknowledgment that consumer adoption is slower than projectedโ€”echoing comments like Ford CEO Jim Farley’s “the customer has spoken.”

Industry-Wide Ramifications:

  • Signals over-investment in EVs during the hype phase (2021-2024), driven by policy incentives and forecasts.
  • Contributes to the “EV boom out of charge” narrative: slower global growth in key markets (U.S. dips, China cools post-subsidies).
  • Doesn’t kill electrificationโ€”many companies still commit long-term (e.g., Ford targets 2029 break-even)โ€”but forces realism, cost-cutting, and hybrid emphasis.
  • Suppliers and battery partners face ripple effects (canceled contracts, reduced orders).

In short, these write-downs aren’t the end of EVs but a painful correction after mismatched expectations vs. reality.

FOE Accuses Big Tech of Lying about the Climate Benefits of AI

But who is the real target audience of big tech climate propaganda?

From Watts Up With That?

Essay by Eric Worrall

But who is the real target audience of big tech climate propaganda?

Report Exposes Big Techโ€™s AI Climate Hoax: 74% of Industryโ€™s Claims About AIโ€™s Climate Benefits are Unproven

February 17, 2026

First critical analysis of industryโ€™s statements on AI and climate impact

BERLIN โ€“ The big tech industryโ€™s claims about the climate benefits of artificial intelligence (AI) are a hoax, according to a new report released today. A staggering 74% of claims about AIโ€™s climate benefits are unproven, serving the profits of tech and fossil fuel industries, while downplaying the major climate harms of generative AI.

The research looks at 154 statements claiming AI will serve as a net climate benefit โ€“ including from companies like Google and Microsoft, and from institutions such as the International Energy Agency โ€“ and, for the first time, critically analysed the assertion that AI will be a net benefit to climate action, making up for the increased fossil fuel demand by AI-driven data centres. 

According to the findings, only 26% of the claims cited published academic papers and 36% did not cite any evidence at all. Overall, these claims tend to rely on weak forms of evidence rather than robust, peer-reviewed academic papers.

The report was commissioned and published by a consortium of environmental organisations including Beyond Fossil Fuels, Climate Action Against Disinformation (CAAD), Friends of the Earth U.S., Green Screen Coalition, Green Web Foundation, and Stand.earth, and was authored by climate and energy analyst Ketan Joshi. It is released ahead of the AI Impact Summit 2026 (19-20 February, New Delhi, India).[2]

The study examines the types of AI underpinning these claims, and the strength of the evidence put forth alongside them. The analysis did not uncover a single example where consumer generative systems such as ChatGPT, Gemini, or Copilot were leading to a material, verifiable, and substantial level of emissions reductions. It finds that claims about โ€œAI sustainabilityโ€ blur the differences between generative AI โ€“ which carries major environmental costs, with the much lower energy and environmental footprint of โ€œtraditionalโ€ AI, used for instance for machine learning to forecast wind patterns. This deceptive bait-and-switch is a new form of greenwashing used by the tech industry.

Ketan Joshi, Independent climate and energy analyst, said: โ€œIt appears tech companies are using vagueness about what happens within energy-hogging data centres to greenwash a planet-wrecking expansion. This has bled through into organisations like the International Energy Agency. The promises of planet-saving tech remain hollow, while AI data centres breathe life into coal and gas every day. These claims of climate benefit are unjustified and overhyped, and could  cover up irreversible damage being done to communities and society.โ€

Jill McArdle, International Corporate Campaigner, Beyond Fossil Fuels, said: โ€œBig Techโ€™s AI hype is distracting users from the rapid and dangerous expansion of giant, energy and water-intensive data centres, while the tech industryโ€™s huge energy demands are throwing the fossil fuel industry a lifeline. There is simply no evidence that AI will help the climate more than it will harm it. Rather than relying on credible and substantiated data, Big Tech companies are writing themselves a blank cheque to pollute on the empty promise of future salvation. We cannot bet the climate on these baseless claims.โ€

Michael Khoo, Policy co-chair, Climate Action Against Disinformation, Program Director, Friends of the Earth U.S., said: โ€œAny climate benefits are far outweighed by how much energy generative AI is using. By lumping traditional and generative AI together, possible climate solutions are bundled with extreme pollution, and presented as a package deal. Governments must require basic transparency from the AI industry so communities and scientists can know how much energy is being exploited for this technology.โ€

In short, the evidence that AI will lead to large-scale climate benefits is weak, whilst the evidence of immediate and substantial climate and environmental harm is strong.

Exaggerating AIโ€™s climate potential distracts from the real costs of massive, energy- and water-hungry data centres imposed on communities worldwide.

Nathan Taft, Senior Campaigner Stand.earth, said: โ€œThe sheer scale of these AI data center buildouts could have global implications for the climate, and it also comes with serious impacts for local communities. The least these corporations can do is ensure that demand isnโ€™t met with fossil fuels that pollute local communities. Hyperscalers canโ€™t hand-wave away community concerns with sleight-of-hand promises of future clean energy, or greenwash its ongoing love affair with fossil fuels โ€” these new data centers must be backed by new, locally sourced, 24/7 renewable energy before they go online, or not go online at all.โ€

The accelerated growth of AI is increasing pressure on the climate, and Big Tech must take responsibility for mitigating its environmental impacts. Companies must disclose their energy consumption and emissions, and be transparent about the environmental and social justice impacts of their technologies, and whether data centres are really serving the critical needs of society. 

CONTACTS

Jill McArdle, International Corporate Campaigner, Beyond Fossil Fuels, jill.mcardle@bff.earth, mobile +32 456 723 993 (English)
Pierre Terras, Corporate Programme Lead, Beyond Fossil Fuels, pierre.terras@bff.earth , mobile +33 646 90 21 04 (French, Spanish, English)
Shane Reese, Corporate Campaigns Media Director, Stand.earth, shane.reese@stand.earth , mobile +1 919 339 3785 (English)Source: https://foe.org/news/report-exposes-big-techs-ai-climate-hoax/

The claim energy guzzling AI is a tool to reduce emissions always was an absurdity. But why would big tech persist with such nonsense?

More than 1,000 Amazon workers warn rapid AI rollout threatens jobs and climate

Workers say the firmโ€™s โ€˜warp-speedโ€™ approach fuels pressure, layoffs and rising emissions

Varsha Bansal
Sat 29 Nov 2025 00.50 AEDT

More than 1,000 Amazon employees have signed an open letter expressing โ€œserious concernsโ€ about AI development, saying that the companyโ€™s โ€œall-costs justified, warp speedโ€ approach to the powerful technology will cause damage to โ€œdemocracy, to our jobs, and to the earth.โ€

The letter, published on Wednesday, was signed by the Amazon workers anonymously, and comes a month after Amazon announced mass layoff plans as it increases adoption of AI in its operations.

Among the signatories are staffers in a range of positions, including engineers, product managers and warehouse associates.

Reflecting broader AI concerns across the industry, the letter was also supported by more than 2,400 workers from companies including Meta, Google, Apple and Microsoft.

โ€ฆRead more: https://www.theguardian.com/technology/2025/nov/28/amazon-ai-climate-change

The open letter makes interesting reading;

Dear Andy Jassy and S-team,

In recent years, tech leaders have accelerated their race to build the most powerful AI first. โ€œSink or swim,โ€ โ€œAI is not going anywhere,โ€ and โ€œwork with it or be replacedโ€ have become mantras in workspaces at Amazon and beyond. 

We, the undersigned Amazon employees, have serious concerns about this aggressive rollout during the global rise of authoritarianism and our most important years to reverse the climate crisis. We believe that the all-costs-justified, warp-speed approach to AI development will do staggering damage to democracy, to our jobs, and to the earth.

Weโ€™re the workers who develop, train, and use AI, so we have a responsibility to intervene. Hereโ€™s why weโ€™re sounding the alarm:

All of this is daunting, but none of it is inevitable. A better future is still very much within reach, but it requires us to get real about the costs of AI and the guardrails we need.

We demand Amazon leadership commit to the following:

  1. No AI with dirty energy.
    No more vague promises that โ€œAI will solve the climate crisis.โ€ Amazon must implement a public plan that includes: 1) powering all data centers withย 100% additional, local renewableย energy,ย 24/7, 2) endingย custom AI solutions for oil & gas companiesย to drill more oil faster, and 3) publishing aย detailed, science-backed glidepathย for how it will meet its climate commitments.
  2. No AI without employee voices.
    We want ethical AI working groups of non-managers across the company that will have significant ownership over org-level goals and how or if AI should be used in their orgs, how or if AI-related layoffs or headcount freezes are implemented, and how to mitigate or minimize the collateral effects of AI use, such as environmental impact.ย 
  3. No AI for violence, surveillance, or mass deportation.
    Amazon sells a huge range of products and services โ€” from physical goods to digital infrastructure to films to medical services. It should not need to beย helping surveil civilians in Gaza,ย collaborating with AI companies that specialize in drone warfare, orย supportingย a mass deportation machine.

The Amazon employees signing this letter believe in building a better world โ€” not in building bunkers to fall back to. We want the promised gains from AI to give everyone more freedom to play and rest, to spend time with family and friends, to be moved by nature, to create, to feel safe being who we are. 

This is an incredibly consequential moment in history. Itโ€™s time for us to step up and spark a conversation about the real benefits and costs of AI. Workers have guided Amazon to a better path before, and we can do it again. The choices we make now, for the planet, for its people and animals, matter more than ever. Letโ€™s make ones we can be proud of.

Signed,

1,235 Amazon employees (and counting!)

Job titles and Amazon organizations listed below. We will update the signatories periodically after verification. Add your signature below.

4,034  people outside of Amazon (and counting!)

โ€ฆRead more: https://www.amazonclimatejustice.org/open-letter?ms=nai

The point is itโ€™s not just warehouse staff who are about to lose their jobs, the very people who are developing AI are protesting against AIโ€™s climate footprint. AI developers are demanding AI be low carbon, and not be used in ways which offend their left wing sensibilities.

How can big tech fix this staff rebellion? Because as the CEO of Honeywell recently explained, powering AI with renewables isnโ€™t going to happen.

One possible solution to pacify radical tech giant staff is to reframe AI as an emissions reduction tool. Convincing big tech staff that AI is essential to solving the climate crisis might help keep them obedient and productive.

In summary, I donโ€™t think big tech is serious about trying to convince the public to accept the absurd proposition that their new AI toys will help reduce global CO2 emissions.ย I believe the real target of big techโ€™s green propaganda campaign is their own staff.ย I believe big tech executives are spending billions on propaganda and letโ€™s say highly speculative energy projects, just to maintain the fiction amongst their own staff that tech leaders remain committed to reducing global CO2 emissions, even when tech giantsโ€™ soaring carbon footprints tell the opposite story.

EPAโ€™s elegant arguments for endangerment repeal

EPAโ€™s arguments for repealing the Obama endangerment finding are simple, clear, and strong. So, they have a likely chance of winning in the Supreme Court (SCOTUS), which is where the final decision will be made.

From CFACT

By David Wojick

EPAโ€™s arguments for repealing the Obama endangerment finding are simple, clear, and strong. So, they have a likely chance of winning in the Supreme Court (SCOTUS), which is where the final decision will be made.

I am working from the lengthy EPA press release which contains what amounts to a summary legal brief of the arguments.

The primary argument is legal and aimed directly at SCOTUS. The release even cites several relevant prior decisions. The gist of these decisions is that agencies cannot find new meaning in old statutes that suddenly gives them enormous new regulatory powers. Such recklessness is called regulatory overreach.

EPAโ€™s argument is that massive overreach is precisely what the endangerment finding did, and it sure looks that way. It was not mission creep, more like mission explosion.

The statute in question is Section 202(a) of the Clean Air Act which lets EPA regulate harmful tailpipe emissions from motor vehicles. The Obama endangerment finding is entirely based on this narrow rule.

Here is how EPA puts it:

โ€œThe agency concludes that Section 202(a) of the CAA does not provide statutory authority for EPA to prescribe motor vehicle and engine emission standards in the manner previously utilized, including for the purpose of addressing global climate change, and therefore has no legal basis for the Endangerment Finding and resulting regulations. EPA firmly believes the 2009 Endangerment Finding made by the Obama Administration exceeded the agencyโ€™s authority to combat โ€œair pollutionโ€ that harms public health and welfare, and that a policy decision of this magnitude, which carries sweeping economic and policy consequences, lies solely with Congress. Unlike our predecessors, the Trump EPA is committed to following the law exactly as it is written and as Congress intendedโ€”not as others might wish it to be.โ€

This is just the sort of statutory issue the Supreme Court usually deals with.

There is an element of the endangerment finding that is so blatantly wrong that it is hilarious. I would start with it because it certainly makes EPAโ€™s case for repeal, at least in part. EPA mentions it in passing saying this:

โ€œIn an unprecedented move, the Obama EPA found that carbon dioxide emissions emitted from automobiles โ€“ in combination with five other gases, some of which vehicles donโ€™t even emit โ€“ contribute an unknown amount to greenhouse gas concentrations in the atmosphereโ€ฆ.โ€

So they used the tailpipe statute to assess (and then regulate) gases that tailpipes do not emit. There is clearly no statutory basis for these endangerment findings.

These are not scientific issues, and SCOTUS does not normally adjudicate science. There are, however, one and a half scientific arguments in case the science comes up. That is, one argument is fully stated in the release while the other is merely alluded to.

Here is the fully stated argument:

โ€œUsing the same types of models utilized by the previous administrations and climate change zealots, EPA now finds that even if the U.S. were to eliminate all GHG emissions from all vehicles, there would be no material impact on global climate indicators through 2100.โ€

This is actually an endangerment finding, namely that there is none.

Here is the alluded to argument:

โ€œโ€ฆ.the Obama EPA found that carbon dioxide emissions emitted from automobiles โ€“ in combination with five other gases, some of which vehicles donโ€™t even emit โ€“ contribute an unknown amount to greenhouse gas concentrations in the atmosphere that, in turn, play a role through varied causal chains that may endanger human health and welfare.โ€

The several scientific issues here are the reality of the โ€œvaried causal chainsโ€ claimed in the Obama endangerment finding. These causal issues include a great deal of alarmism.

As science, the endangerment finding is a complex attribution claim, and these are highly speculative and contentious. These causal chain issues may be elaborated in the technical support documents for the repeal. But if they are at least mentioned, as in the release, it creates a placeholder for them, in case they come up during the SCOTUS arguments.

EPA has mounted some elegant arguments for repeal of the endangerment finding. Stay tuned to CFACT as this drama unfolds.

January 2026 Ocean SSTs Warmย Slightly

The climatists have seized on this unusual warming as proof their Zero Carbon agenda is needed, without addressing how impossible it would be for CO2 warming the air to raise ocean temperatures.ย  It is the ocean that warms the air, not the other way around.ย 

From Science Matters

Byย Ron Clutz

The best context for understanding decadal temperature changes comes from the worldโ€™s sea surface temperatures (SST), for several reasons:

  • The ocean covers 71% of the globe and drives average temperatures;
  • SSTs have a constant water content, (unlike air temperatures), so give a better reading of heat content variations;
  • A major El Nino was the dominant climate feature in recent years.

Previously I used HadSST3 for these reports, but Hadley Centre has made HadSST4 the priority, and v.3 will no longer be updated.  This January report is based on HadSST 4, but with a twist. The data is slightly different in the new version, 4.2.0.0 replacing 4.1.1.0. Product page is here.

The Current Context

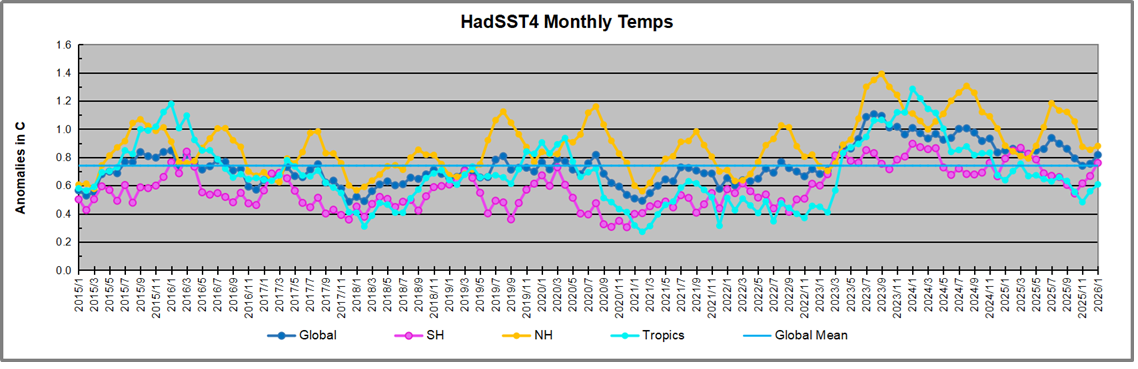
The chart below shows SST monthly anomalies as reported in HadSST 4.2 starting in 2015 through January 2026. A global cooling pattern is seen clearly in the Tropics since its peak in 2016, joined by NH and SH cycling downward since 2016, followed by rising temperatures in 2023 and 2024 and cooling in 2025, now with a small bump upward.

Note that in 2015-2016 the Tropics and SH peaked in between two summer NH spikes.  That pattern repeated in 2019-2020 with a lesser Tropics peak and SH bump, but with higher NH spikes. By end of 2020, cooler SSTs in all regions took the Global anomaly well below the mean for this period.  A small warming was driven by NH summer peaks in 2021-22, but offset by cooling in SH and the tropics, By January 2023 the global anomaly was again below the mean.

Then in 2023-24 came an event resembling 2015-16 with a Tropical spike and two NH spikes alongside, all higher than 2015-16. There was also a coinciding rise in SH, and the Global anomaly was pulled up to 1.1ยฐC in 2023, ~0.3ยฐ higher than the 2015 peak.  Then NH started down autumn 2023, followed by Tropics and SH descending 2024 to the present. During 2 years of cooling in SH and the Tropics, the Global anomaly came back down, led by Tropics cooling from its 1.3ยฐC peak 2024/01, down to 0.6C in September this year. Note the smaller peak in NH in July 2025 now declining along with SH and the Global anomaly cooler as well. In December the Global anomaly exactly matched the mean for this period, with all regions converging on that value, led by a 6 month drop in NH.  Essentially, all the warming since 2015 was gone, with a slightl warming starting 2026.

Comment:

The climatists have seized on this unusual warming as proof their Zero Carbon agenda is needed, without addressing how impossible it would be for CO2 warming the air to raise ocean temperatures.  It is the ocean that warms the air, not the other way around.  Recently Steven Koonin had this to say about the phonomenon confirmed in the graph above:

El Nino is a phenomenon in the climate system that happens once every four or five years.ย  Heat builds up in the equatorial Pacific to the west of Indonesia and so on.ย  Then when enough of it builds up it surges across the Pacific and changes the currents and the winds.ย  As it surges toward South America it was discovered and named in the 19th century.ย It is well understood at this point that the phenomenon has nothing to do with CO2.

Now people talk about changes in that phenomena as a result of CO2 but itโ€™s there in the climate system already and when it happens it influences weather all over the world.ย  ย We feel it when it gets rainier in Southern California for example.ย  So, for the last 3 years we have been in the opposite of an El Nino, a La Nina, part of the reason people think the West Coast has been in drought.

It has now shifted in the last months to an El Nino condition that warms the globe and is thought to contribute to this Spike we have seen. But there are other contributions as well.  One of the most surprising ones is that back in January of 2022 an enormous underwater volcano went off in Tonga and it put up a lot of water vapor into the upper atmosphere. It increased the upper atmosphere of water vapor by about 10 percent, and thatโ€™s a warming effect, and it may be that is contributing to why the spike is so high.

A longer view of SSTs

The graph above is noisy, but the density is needed to see the seasonal patterns in the oceanic fluctuations.  Previous posts focused on the rise and fall of the last El Nino starting in 2015.  This post adds a longer view, encompassing the significant 1998 El Nino and since.  The color schemes are retained for Global, Tropics, NH and SH anomalies.  Despite the longer time frame, I have kept the monthly data (rather than yearly averages) because of interesting shifts between January and July. 1995 is a reasonable (ENSO neutral) starting point prior to the first El Nino.

The sharp Tropical rise peaking in 1998 was dominant in the record, starting Jan. โ€™97 to pull up SSTs uniformly before returning to the same level Jan. โ€™99. There were strong cool periods before and after the 1998 El Nino event. Then SSTs in all regions returned to the mean in 2001-2.

SSTS fluctuate around the mean until 2007, when another, smaller ENSO event occurs. There is cooling 2007-8,  a lower peak warming in 2009-10, following by cooling in 2011-12.  Again SSTs are average 2013-14.

Now a different pattern appears.  The Tropics cooled sharply to Jan 11, then rise steadily for 4 years to Jan 15, at which point the most recent major El Nino takes off.  But this time in contrast to โ€™97-โ€™99, the Northern Hemisphere produces peaks every summer pulling up the Global average.  In fact, these NH peaks appear every July starting in 2003, growing stronger to produce 3 massive highs in 2014, 15 and 16.  NH July 2017 was only slightly lower, and a fifth NH peak still lower in Sept. 2018.

The highest summer NH peaks came in 2019 and 2020, only this time the Tropics and SH were offsetting rather adding to the warming. (Note: these are high anomalies on top of the highest absolute temps in the NH.)  Since 2014 SH has played a moderating role, offsetting the NH warming pulses. After September 2020 temps dropped off down until February 2021.  In 2021-22 there were again summer NH spikes, but in 2022 moderated first by cooling Tropics and SH SSTs, then in October to January 2023 by deeper cooling in NH and Tropics.

Then in 2023 the Tropics flipped from below to well above average, while NH produced a summer peak extending into September higher than any previous year.ย  Despite El Nino driving the Tropics January 2024 anomaly higher than 1998 and 2016 peaks, following months cooled in all regions, and the Tropics continued cooling in April, May and June along with SH dropping.ย  After July and August NH warming again pulled the global anomaly higher, September through January 2025 resumed cooling in all regions, continuing February through April 2025, with little change in May, June and July despite upward bumps in NH. Now temps in all regions have cooled led by NH from August through December 2025.

What to make of all this? The patterns suggest that in addition to El Ninos in the Pacific driving the Tropic SSTs, something else is going on in the NH.  The obvious culprit is the North Atlantic, since I have seen this sort of pulsing before.  After reading some papers by David Dilley, I confirmed his observation of Atlantic pulses into the Arctic every 8 to 10 years.

Contemporary AMO Observations

Through January 2023 I depended on the Kaplan AMO Index (not smoothed, not detrended) for N. Atlantic observations. But it is no longer being updated, and NOAA says they donโ€™t know its future.ย  So, I find that ERSSTv5 AMO dataset has current data.ย  It differs from Kaplan, which reported average absolute temps measured in N. Atlantic.ย  โ€œERSST5 AMOย  follows Trenberth and Shea (2006) proposal to use the NA region EQ-60ยฐN, 0ยฐ-80ยฐW and subtract the global rise of SST 60ยฐS-60ยฐN to obtain a measure of the internal variability, arguing that the effect of external forcing on the North Atlantic should be similar to the effect on the other oceans.โ€ย  So, the values represent SST anomaly differences between the N. Atlantic and the Global ocean.

The chart above confirms what Kaplan also showed. As August is the hottest month for the N. Atlantic, its variability, high and low, drives the annual results for this basin. Note also the peaks in 2010, lows after 2014, and a rise in 2021. Then in 2023 the peak reached 1.4C before declining to 0.9 last month. An annual chart below is informative:

Note the difference between blue/green years, beige/brown, and purple/red years.  2010, 2021, 2022 all peaked strongly in August or September.  1998 and 2007 were mildly warm.  2016 and 2018 were matching or cooler than the global average.  2023 started out slightly warm, then rose steadily to an  extraordinary peak in July.  August to October were only slightly lower, but by December cooled by ~0.4C.

Then in 2024 the AMO anomaly started higher than any previous year, then leveled off for two months declining slightly into April.  Remarkably, May showed an upward leap putting this on a higher track than 2023, and rising slightly higher in June.  In July, August and September 2024 the anomaly declined, and despite a small rise in October, ended close to where it began.  Note 2025 started much lower than the previous year and headed sharply downward, well below the previous two years, then since April through September aligning with 2010. In October there was an unusual upward spike, now reversed down to match 2022 and 2016.  An orange dot on the left axis represents the value of 0.71C for January 2026

The pattern suggests the ocean may be demonstrating a stairstep pattern like that we have also seen in HadCRUT4.

The rose line is the average anomaly 1982-1996 inclusive, value 0.18.  The orange line the average 1982-2025, value 0.41 also for the period 1997-2012. The red line is 2015-2025, value 0.74. As noted above, these rising stages are driven by the combined warming in the Tropics and NH, including both Pacific and Atlantic basins.

Curiosity:  Solar Coincidence?

The news about our current solar cycle 25 is that the solar activity is hitting peak numbers now and higher  than expected 1-2 years in the future.  As livescience put it:  Solar maximum could hit us harder and sooner than we thought. How dangerous will the sunโ€™s chaotic peak be?  Some charts from spaceweatherlive look familar to these sea surface temperature charts.

Summary

The oceans are driving the warming this century.  SSTs took a step up with the 1998 El Nino and have stayed there with help from the North Atlantic, and more recently the Pacific northern โ€œBlob.โ€  The ocean surfaces are releasing a lot of energy, warming the air, but eventually will have a cooling effect.  The decline after 1937 was rapid by comparison, so one wonders: How long can the oceans keep this up? And is the sun adding forcing to this process?

USS Pearl Harbor deploys Global Drifter Buoys in Pacific Ocean