Nuclear is the most reliable path to affordable electricity

Political leaders are increasingly prioritizing affordability (without the need for subsidies) as a cornerstone of electricity policy. They are now recognizing that high costs burden households, stifle economic growth, and fuel public discontent in wealthier nations that are providing taxpayer subsidies to support unreliable electricity from wind and solar.

A cutaway model of a small modular reactor displayed at an exhibition, with informational panels in the background. Visitors are seen exploring the exhibit.

From CFACT

By Ronald Stein, Olivia Vaughan, Steve Curtis

Cooling towers of a nuclear power plant amidst a field of yellow flowers during sunset, with power lines in the background.

Political leaders are increasingly prioritizing affordability (without the need for subsidies) as a cornerstone of electricity policy. They are now recognizing that high costs burden households, stifle economic growth, and fuel public discontent in wealthier nations that are providing taxpayer subsidies to support unreliable electricity from wind and solar.

These same political leaders in the wealthier nations are oblivious to the fact that “net-zero” is NOT affordable by the 6 billion living in poverty! Shockingly, 80% of the 8 billion on planet Earth, or more than 6 billion, are living on less than $10/day.

Amid this “worldwide” economic reality backdrop, nuclear energy presents a far superior, affordable alternative to unreliable electricity sources like wind and solar.  Economically, it makes no sense to abandon working production methods until new ones can replace the existing and future demand. World citizens are facing this reality in higher electricity prices.

The Truth About Continuous Electricity

One cannot compare baseload continuous electricity to intermittent wind and solar on a like-for-like basis. Due to wind and solar being unable to provide continuous electricity, those projects are not investable by the private sector and only exist in the wealthier countries that can afford to subsidize their existence with taxpayer subsidies.

However, electricity from wind and solar is unpredictable and intermittent and cannot be used as a baseload without 100% backup, meaning continuous sources like nuclear, coal, or gas must be constructed, operated, and ready to be dispatched when the wind stops or the sun sets. For solar, we can predict nighttime lapses, but wind’s unpredictability exacerbates the issue. So, if 1 megawatt of continuous backup is needed for every 1 megawatt of wind or solar, why build the intermittent wind and solar in the first place?

Countries like Germany and Denmark, which led with aggressively subsidized wind and solar projects, now suffer some of Europe’s highest prices. This serves as a cautionary tale of a self-inflicted economic disaster that the U.S. can readily avoid. States with high renewable penetration, like California, have seen systemic rises in electricity prices due to full system costs, including that 100% backup requirement. Today, California has the highest electricity cost in America (except for Hawaii).

U.S. Secretary of Energy Chris Wright has been clear about such inefficiencies: “Germany invested half a trillion dollars, more than doubled the capacity of its electricity grid, and today produces 20% less electricity than before that investment, selling it at three times the price.” He adds, “We’re in the greatest malinvestment in human history,” noting that globally, $10 trillion has yielded only about 6% of electricity from wind and solar, with high penetration driving up prices and prompting mass industry exodus.

It’s time for the U.S. to lead with sane electricity policies, unlocking investments in nuclear, coal, and oil & gas. These are the industries that power the modern world that we know today. Nuclear, in particular, provides continuous baseload power with no harmful pollution during operations, positioning it as the clean, reliable cornerstone for a prosperous future.

Nuclear power excels in delivering stable, affordable electricity, operating at high-capacity factors, often over 90%, to generate power continuously, regardless of weather or time of day. This translates to lower long-term costs, as uranium fuel is vastly superior in the amount of output it produces as opposed to other sources.

True Generation IV SMRs, which fit specific criteria including sustainability (effective fuel use and waste minimization), economics (cost advantages and low financial risk), safety and reliability (very low core damage risk and no need for offsite emergency response), and proliferation resistance and physical protection (deterring misuse), are ideally suited for this role. The Department of Energy endorses fast-tracking these technologies as the clean solutions of the future, with systems like the High-Temperature Gas-Cooled Reactor (HTGR), Sodium-Cooled Fast Reactor (SFR), and Molten Salt Reactor (MSR) leading the way.

Unlike those unreliable wind and solar sources, nuclear provides stable, baseload power that ensures reliability and long-term cost savings, making it the optimal solution for meeting rapidly escalating electricity needs without compromising economic stability. To policymakers and voters alike, embracing nuclear, particularly advanced Small Modular Reactors (SMRs), offers a long-term path to electricity independence, job creation, prosperity, and a means to bring the 6 billion living in poverty to join the industrial revolution.

The surge in electricity demand is unprecedented. Tech giants such as Amazon, Google, Microsoft, and Meta are backing nuclear power while they are constructing massive data centers to power AI advancements, with facilities requiring six to ten times more power than previous generations. These centers demand round-the-clock, uninterrupted electricity. AI workloads cannot tolerate fluctuations or downtime.  U.S. electricity consumption could double by 2050, necessitating an around-the-clock, always-available supply.

What About the Grid?

The inherent safety in Gen IV SMRs, such as passive cooling that enables automatic shutdown without external power, should translate to reduced regulatory burdens and shorter build times, addressing historical delays in large-scale reactors plagued by overruns and grid constraints.

SMRs, with capacities between 10 and 300 megawatts, are factory-assembled and standardized, substantially reducing construction timelines and costs, and will rapidly benefit from economies of scale. They scale efficiently as demand grows, allowing modular additions for precise planning rather than massive, risky projects.

Crucially, SMRs serve as behind-the-meter solutions, deployed on-site with reduced exclusion zones due to their safety features. This means large users like industry and data centers avoid waiting for grid connections or burdening existing systems, connecting directly via short, dedicated lines while maintaining grid interties for resilience. As baseload generators, SMRs supply on-demand, continuous power 24 hours a day, 365 days a year.

Distributed designs incorporate continuous refueling systems, eliminating downtime. For example, the Stratek Global High Temperature Modular Reactor (HTMR), with its foundation on the Pebble Bed Modular Reactor (PBMR), requires no refueling shutdowns, with its multi-module configuration enabling rotational maintenance on downstream equipment. This allows data centers and industrial users to coordinate system maintenance and redundancy, building in future scaling from the outset while aligning future construction with demand.

Policies and Shifting Sentiment

The issue of nuclear “waste” is overstated; it is better termed spent fuel, retaining over 90% of its energy potential. Companies like Oklo are advancing recycling technologies that are integral to the future of affordable and abundant electricity. Countries like France, Russia, and China are already reprocessing spent fuel to extract further value and minimize long-term storage needs. Advanced fast reactor recycling (Gen V reactors), such as that proposed by Oklo, can increase the energy output over reprocessing by at least ten times. Since more spent fuel is being made all the time, recycling spent nuclear fuel transforms it into a truly renewable resource.

Recent U.S. policy shifts, including executive orders aiming to quadruple U.S. nuclear capacity to 400 GW by 2050 and partnerships with firms like Cameco, Brookfield, and Westinghouse, give gravitas to the urgency of this potential. Efforts to restart shuttered plants will further revitalize the sector and provide the continuous power needed by States, their industries, and citizens.

Regulators, policymakers, and financiers should take the inherent safety characteristics of Gen IV SMRs into account when making long-term decisions about the country’s future trajectory. Cutting time to license and build is not a nice-to-have; it is an imperative step that policy makers need to act on.

The Path to Affordable Electricity

As electricity demand balloons and affordability drives political agendas, policymakers and voters must prioritize nuclear energy over intermittent wind and solar power. By embracing Nuclear Power (particularly Gen IV SMRs, with their inherent safety, scalability, and behind-the-meter advantages), the U.S. can secure a stable, cost-effective power supply that fuels innovation, protects consumers from price volatility, and ensures energy independence for generations to come. Failing to invest now risks grid instability and higher costs. These are outcomes no leader or citizen can afford. It’s time for America to lead the world toward rational, nuclear-powered progress.

This article originally appeared at America Out Loud

The Risks of AR7: Ed Miliband’s Poison Pill

AR7 refers to the UK’s Allocation Round 7 of the Contracts for Difference (CfD) scheme, a government auction process for subsidizing renewable energy projects, primarily offshore wind. It is a key part of Energy Secretary Ed Miliband’s push for “clean power by 2030” under the Labour government.
Ed Miliband’s “poison pill” debate reflects broader UK tensions over net zero costs, subsidies, and energy bills.

Cover image featuring dramatic lightning strikes against a dark stormy sky, with a wind turbine in the foreground. Text includes 'THE RISKS OF AR7', 'Ed Miliband’s Poison Pill', and 'David Turver'.

AR7 refers to the UK’s Allocation Round 7 of the Contracts for Difference (CfD) scheme, a government auction process for subsidizing renewable energy projects, primarily offshore wind. It is a key part of Energy Secretary Ed Miliband’s push for “clean power by 2030” under the Labour government.

Ed Miliband’s “poison pill” debate reflects broader UK tensions over net zero costs, subsidies, and energy bills.

A man in a suit looks shocked while holding a large, labeled object with 'AR7', surrounded by several smaller figures in the background, also in suits, showing surprise or confusion.

_________________________________________________________________________________________________________

From The Global Warming Policy Foundation

By David Turver

Graphic discussing the impact of AR7 on electricity prices, featuring a book cover titled 'The Risks of AR7' with an image of a wind turbine and stormy sky.

London, 4th February. AR7 is Ed Miliband’s “poison pill”, entrenching higher costs, weaker energy security and reduced democratic scrutiny for a generation, according to a new briefing paper from The Global Warming Policy Foundation.

  • New analysis warns AR7 will lock households into decades of higher electricity bills. The subsidies will add the equivalent of £79 per household annually to economy-wide electricity costs and the contracts are guaranteed for 20 years.
  • These costs come as the grid is being expanded and reinforced to manage increasing intermittent power capacity. By 2031, household can expect to be paying £400 annually in balancing and backup costs, and £134 from grid expansion.
  • Government claims that renewables are “cheap” rely on unrealistic assumptions, ignoring the soaring costs of intermittency, backup generation and curtailment.
  • Official forecasts once again underestimate the true cost of net zero electricity, with AR7 contracts priced above gas-fired power even before system costs are included.
  • Analysis shows firm power capacity is forecast to decline, raising blackout risks.

In The Risks of AR7 – Ed Miliband’s Net Zero Poison Pill, energy analyst David Turver analyses official AR7 auction data and cost forecasts from the Department for Energy Security and Net Zero (DESNZ), the Office for Budget Responsibility (OBR), the National Energy System Operator (NESO) and Ofgem. He concludes that government Net Zero costings understate the true price of renewable electricity by excluding the full costs of subsidies, intermittency, backup generation and grid expansion.

International Energy Agency (IEA) figures suggest that the UK had the highest non-domestic electricity prices in the developed world, with the second or third highest domestic prices, depending on measurements.

AR7 and AR7a are expected to add an additional £2.3 billion to energy bills, with grid balancing and maintenance costs adding billions of pounds more.

The report concludes that AR7 and the wider Clean Power 2030 programme will lock Britain into higher electricity costs and greater supply risks for decades.

David Turver, author of the paper, said:

“AR7 and Miliband’s broader Clean Power 2030 plan are a poison pill that will leave us with high energy prices and unreliable power for decades to come. Miliband must be stopped before he does even more damage.”

Lord Mackinlay, Director of the Global Warming Policy Foundation said:

“It is clear that the AR7 round has produced only one group of winners – the subsidy-hungry wind power companies who have literally ‘tucked-up’ the British taxpayer. They knew that Ed Miliband and his Department needed to secure this auction round at virtually any price. This will mean even higher energy prices, estimated at £79 per household, indexing up annually across the 20-year term of this incoherent endeavour.

If this wasn’t bad enough, as reliance on intermittent renewables increases, their true costs—unnecessary grid expansion, balancing, and backup—will rapidly come into view, adding a further £500 plus per household each year.

AR7 marks another dark chapter for energy security and affordability.”

Harry Wilkinson, Head of Policy at the Global Warming Policy Foundation said:

“At a time when Britain labours under some of the highest electricity prices in the world, Miliband has chosen to entrench a failing system. This is reckless in the extreme and the implications will be very challenging to reverse.” 

The Risks of AR7 – Ed Miliband’s Net Zero Poison Pill can be read here.

A man in a suit holds a large blue and white capsule labeled 'AR7' while standing in front of a crowd. The background features people shouting and a scattering of dollar bills and wind turbine models around him.

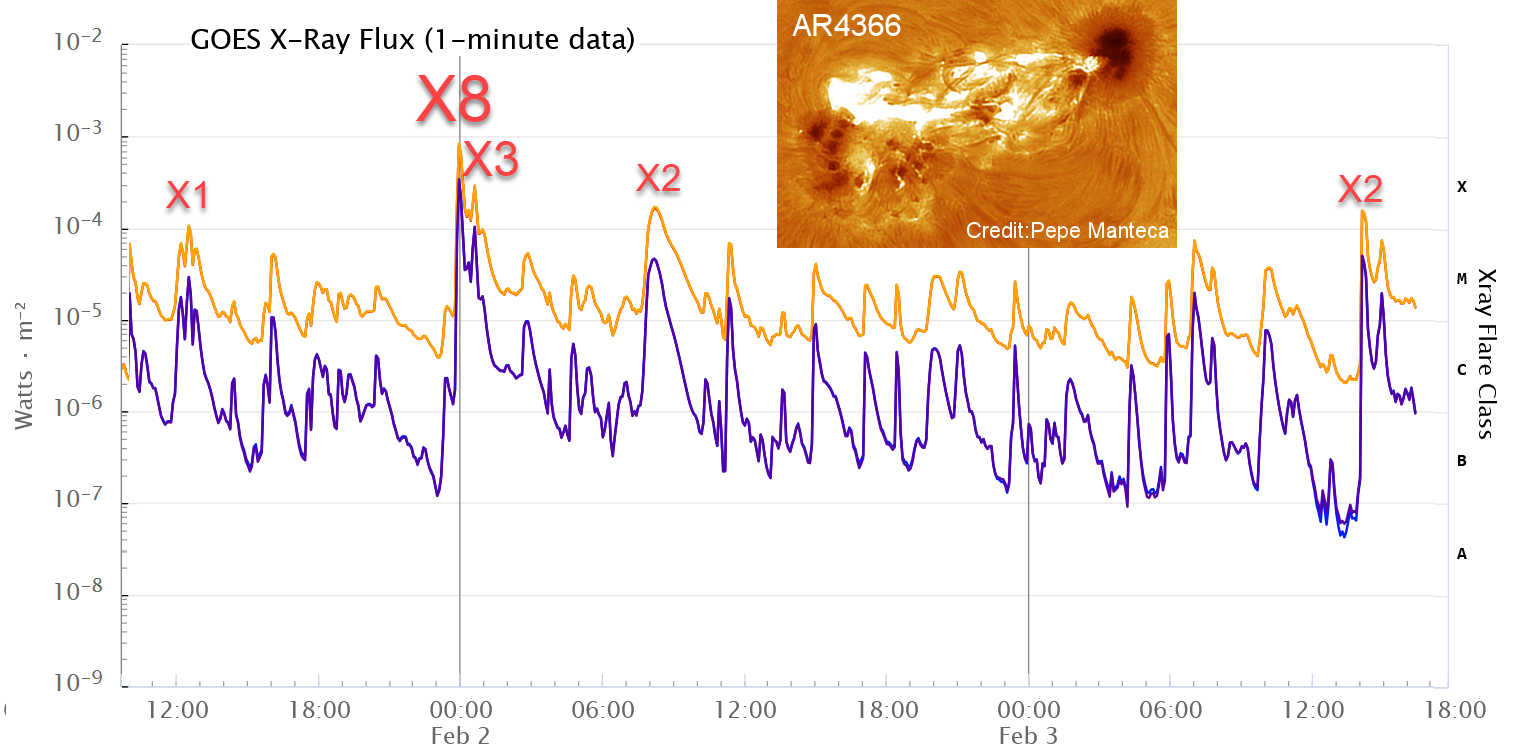
A MAJOR SUNSPOT IS FACING EARTH – Potential for Huge X-Class Solar Flares

There’s currently a major sunspot region (designated AR4366 or Region 4366) facing Earth that’s been extremely active, producing multiple X-class solar flares—the strongest category—and raising concerns about potential for more huge flares.

Close-up view of the sun's surface, showcasing solar flares and sunspots against a fiery orange backdrop.
ENORMOUS X 4.2 FLARE ON AR 4366 !

There’s currently a major sunspot region (designated AR4366 or Region 4366) facing Earth that’s been extremely active, producing multiple X-class solar flares—the strongest category—and raising concerns about potential for more huge flares.

This sunspot has grown rapidly and is one of the most active regions in the current solar cycle (Cycle 25). It’s massive, with reports describing it as roughly 6.5 to 15 times the diameter of Earth (or larger in some estimates), making it visible even without equipment under safe viewing conditions (never look directly at the Sun without proper solar filters!).

_________________________________________________________________________________________________________

From Watts Up With That?

By Anthony Watts

Close-up view of solar flares and sunspots on the surface of the sun, featuring bright, intense light and swirling patterns against a warm orange background.

Via Spaceweather.com Sunspot AR4366 is shaping up to be the most active sunspot of Solar Cycle 25. In only two days, it has produced five X-class solar flares and shows no signs of slowing down. The giant sunspot is turning to face Earth, and we will be squarely inside its ‘strike zone’ for the rest of the week.

NOAA says that minor G1-class geomagnetic storms are likely on Feb 5-6 when a Coronal Mass Ejection (CME) is expected to graze Earth’s magnetic field. The CME was hurled into space by a powerful X8-class solar flare on Feb.1st. Even a glancing blow from such a CME can be potent, so don’t be surprised if the storm is stronger than expected.

A close-up view of the sun, showcasing its bright yellow surface with solar flares and dark sunspots against a gradient orange background.
Taken by Eduardo Schaberger Poupeau on February 2, 2026 @ Rafaela, Provincia de Santa Fe, Argentina

“I captured this image of the sun on Feb. 2nd using my H-alpha telescope at a moment of intense solar activity,” says Poupeau. “The main feature is sunspot AR 4366, a true solar flare factory, which has produced dozens of M-class flares and 5 X-class flares, including a powerful X8 event, all within a few days.”

This sunspot is just getting started. It has an increasingly unstable ‘delta-class’ magnetic field, and it is rapidly adding new spots. More X-flares are likely in the days ahead, and they will be Earth directed.

A vibrant depiction of the sun as a swirling mass of energy, with bright orange and yellow hues, set against a backdrop of green and purple auroras in the night sky.

Climate Scientist Who Predicted End Of “Heavy Frost and Snow” Now Refuses Media Inquiries

In April 2000, Latif was quoted in a Der Spiegel article (titled something along the lines of “Winter ade – nie wieder Schnee,” or “Goodbye Winter – Never Snow Again”) predicting that due to global warming, Germany would likely see fewer harsh winters with heavy frost and snow compared to previous decades. He reportedly also mentioned recollections of snow around Easter in the past, implying such events were becoming rare or obsolete.

A man in a business suit smiles broadly while standing in deep snow, with a wintry landscape in the background.

In April 2000, Latif was quoted in a Der Spiegel article (titled something along the lines of “Winter ade – nie wieder Schnee,” or “Goodbye Winter – Never Snow Again”) predicting that due to global warming, Germany would likely see fewer harsh winters with heavy frost and snow compared to previous decades.

He reportedly also mentioned recollections of snow around Easter in the past, implying such events were becoming rare or obsolete.

A man in a white lab coat stands in deep snow, expressing shock or surprise while raising his hand to his forehead. Snow-covered landscape and trees are visible in the background.

_________________________________________________________________________________________________________

From No Trick Zone

By P Gosselin

More than two decades ago, renowned climate scientist Mojib Latif of Germany’s Max Planck Instiute for Meterology, based in Hamburg, warned the climate-ambulance chasing Der Spiegel that, due to global warming, Germany would likely no longer experience harsh winters with heavy frost and snow as it had in previous decades.

Text excerpt discussing the impact of climate change on winter weather in Germany, highlighting the reduction of snow and cold winters.
Spiegel reported climate scientist’s prediction of harsh winters disappearing due to man’s activities. Image cropped here. 

In light of the current severe winter weather in Germany, Latif’s statements are facing renewed scrutiny. An article appearing in the Berliner Zeitung here notes that Latif’s prophecy has “aged poorly” and he appears to want to have nothing to do with them.

Hiding from the media

According to the Berliner Zeitung, the former Max Planck Institute scientist has recently stopped responding to media inquiries regarding his past claims. Critics argue that such drastic predictions damage the credibility of climate science, while others point out that extreme weather events—including intense cold snaps—can still occur within the broader context of climate change.

No Easter snow as well

Latif also claimed he recalled snow in the past occurring at Easter time, implying this no longer happens today. But that too was a false claim. perhaps prof. Latif will answer phone calls in April?

Article headline discussing climate predictions made 20 years ago regarding snowfall in Germany, authored by Boban Dukic.

Dutch climate skeptics vindicated: KNMI reinstates seven pre-1950 heatwaves after long battle

Seven years after Dutch skeptics first challenged KNMI’s temperature adjustments, the institute has reinstated seven “lost” pre-1950 heatwaves at De Bilt — validating claims of over-correction that had erased 16 out of 23 historical extremes. The breakthrough came via the skeptics’ peer-reviewed paper.

A group of children dressed in school uniforms stands by a canal, watching two boys sitting on a wooden boat. One boy plays an accordion while the other sits beside him. The surroundings feature green trees and vintage cars.

From Clintel

By Marcel Crok

Seven years after Dutch skeptics first challenged KNMI’s temperature adjustments, the institute has reinstated seven “lost” pre-1950 heatwaves at De Bilt — validating claims of over-correction that had erased 16 out of 23 historical extremes. The breakthrough came via the skeptics’ peer-reviewed paper.

A miracle just happened. KNMI, the national weather and climate institute in The Netherlands, admitted publicly that we, a group of four skeptical scientists, were right in our critique of their homogenization. This admission means the end of a ‘battle’ that has been dragging on for about seven years.

What was this whole discussion actually about? In 2016, KNMI homogenized their daily temperatures for the period 1901-1950 because of a change in measurement method in 1950 (Pagoda screen to Stevenson screen) and a displacement 300 meter towards open field in 1951. They had parallel measurement for the change in screens but not for the displacement and therefore they had decided to homogenize De Bilt statistically by comparing it with a station 150 kilometers northeast (a place called Eelde) from De Bilt. The homogenization had a negligible effect on the average temperature. However, the hottest days of the year (In The Netherlands this means Tmax of around 30oC) in the period 1901-1950 were corrected downwards by up to 1.9oC. Because of this, 16 out of those 23 heatwaves vanished from the official records.

Hot summer

In 2018, when The Netherlands experienced a hot summer, KNMI started claiming in the media that heatwaves nowadays are much more frequent than in the past. I, together with three others, decided to critically examine the KNMI corrections. In March 2019 we launched our first extensive report (in Dutch) about the matter, titled The Mystery of the vanished Heatwaves. The report showed that the KNMI had overcorrected far too much. An article was prepared for a major Dutch newspaper, but after interference by the director of KNMI, the editor in chief of the newspaper decided not to publish the article. A spokesman of KNMI used ad hominem arguments against us (or mainly me as I am the most visible of us four). After questioning this in an email I had a conversation with the director of KNMI and the spokesman. It was a shocking experience. They told me they wouldn’t response to our extensive report as they didn’t “trust me”. I replied science isn’t about trust. “Our report is either right or wrong and in both cases, I would like to know”, I replied.

This was the end of it and in the years after they kept using their – in our opinion – fraudulent corrections to claim a strong increase in heatwaves.

Peer reviewed

We had one option left. We decided to try to get our critique published in a peer reviewed journal. As you can imagine this wasn’t easy, but ultimately in December 2021 we succeeded with a publication in the journal Theoretical and Applied Climatology. We focused not on heatwaves, but on what we call tropical days (days with Tmax of at least 30oC). The Netherlands has quite a peculiar definition of a heatwave: 5 days of at least 25oC of which three days are hotter than 30oC. Historical heatwaves can easily disappear if one tropical day is corrected downwards from say 30.3oC to let’s say 29.8oC. KNMI used corrections up to 1.9oC and that’s how 16 out of 23 heatwaves in the first half of the 20th century vanished from the books.

In the paper, we presented irrefutable evidence that, as a result of the corrections, De Bilt had become an outlier compared to the four other principal stations we have in the Netherlands. Below is the key figure from our paper. You see the ratio of tropical days before and after 1950. A ratio of one means as many tropical days during 1906-1949 as during 1952-1995. A number larger than one means more tropical days in the first than in the latter period.

Bar graph comparing temperature measurements for various locations labeled Groningen/Eelde, Maastricht/Beek, Den Helder/De Kooy, Vlissingen, and De Bilt, with 'De Bilt - measured' noted. Data indicates values at or above 30 degrees Celsius.
Figure 2 from the paper: ratio of tropical days 1906-1949 compared to 1952-1995
at the five main stations after the KNMI corrections. In dark gray the original
measurements of the KNMI, in light gray De Bilt after the corrections of the KNMI.

The four other main stations in The Netherlands (red, green, blue and yellow) show ratios of slightly more than one. Before homogenization (dark grey) De Bilt has a comparable ratio as the other stations, suggesting that homogenization isn’t even necessary. After homogenization (light grey) De Bilt became a huge outlier. Our conclusion plain and simple: far too many tropical days had been scrapped in De Bilt.

Sensitivity analysis

We examined the effect of a number of choices made by KNMI during the statistical procedure. These include the choice of reference stations, the length of temperature series, the calculation of the statistical distribution of the highest daily temperatures per month and the way in which outliers in the data are smoothed out. This shows that almost all choices made by KNMI lead to a greater decrease in the number of tropical days before 1950. Figure 3 of the paper illustrates the problem:

Line graph depicting the number of days exceeding 30 degrees Celsius from 1901 to 1950 across various locations, with multiple colored lines representing different reference periods.
Figure 3 from the paper: number of tropical days after correction based on 116 variants.
KNMI only showed the outcome labelled Brandsma, 2016 in the figure.

The y-axis shows the number of tropical days remaining in De Bilt after the temperature corrections. There were originally 164. It can be clearly seen that the choice made by KNMI (Brandsma, 2016 in the figure, leading to 76 tropical days) is at the lower end of the range of the 116 variants considered by the researchers.

By using longer comparison periods, the method converges towards a narrower range, from 104-119 with a median of 113. This is considerably higher than the 76 according to the KNMI. We are not saying that this number is therefore the correct number. This is merely what you would get if you applied the method used by KNMI but strive for a somewhat more stable outcome.

The Other Newspaper

We again published a press release on our website and also sent it to the Dutch media. The timing though was awkward. The paper was published on 6 December 2021, a moment that the media is more interested in snow and ice. Just one alternative newspaper (De Andere Krant, The Other Newspaper) decided to publish about it and decided to ask for a reaction of KNMI. This time they admitted to the newspaper that our analysis was “interesting” and they promised to look into it in 2022 and publish a new version of their homogenization in 2023.

For the first time in this battle between us, a group of ‘skeptics’ and KNMI, we were in the lead. Their homogenization in 2016 was published in a KNMI report. It was not published in a peer reviewed journal. Now, our critique had been published in a peer reviewed journal.

Still, 2022, 2023, 2024, 2025 went by and there was no news about it. Meanwhile national weathermen kept claiming on national television that heatwaves are much more frequent nowadays. But many people in The Netherlands were aware of our critique, especially on social media platforms like X, Linkedin and Facebook. Last October, finally, the first author of our paper, Frans Dijkstra, was contacted by KNMI and asked to review their homogenization 2.0. Much to our satisfaction, we observed that the KNMI had in fact recognized the validity of our criticism. Last week they silently tried to launch their new version of the homogenization. No press release, just a short article on their website and a pdf of the report. However, a Dutch climate journalist, working for a mainstream and progressive newspaper, realized this was news. He interviewed both me and KNMI and his headline was simply amazing: KNMI ‘Discovers’ Seven Pre-1950 Heatwaves: A Win and Point of Principle for Climate Skeptics.

Vindicated

So, more than seven years after starting to look into this matter, we were completely vindicated, both by KNMI itself and by the media. We never thought this day would ever come. KNMI more or less did what we advised, use more stations to do the homogenization (they now use Eelde and Maastricht) and use longer comparison periods (they now use 15 years). This results in far smaller corrections. Seven heatwaves are back in the records (some are still gone though). Before the homogenization the summer of 1947 had an absolute record with four heatwaves. After the first homogenization three of those four had vanished. After the 2.0 homogenization all four are back.

Although KNMI responded in an unprofessional and dismissive manner to our 2019 report, the publication of our critique in a peer-reviewed journal ultimately proved decisive in shifting the debate in our favor. In contrast to KNMI’s initial homogenization effort — which was not subjected to formal peer review — our critique underwent rigorous peer review and publication. This strengthened our position in the debate. We commend KNMI for adopting a far more professional approach in producing the second version of their homogenization report. Notably, they invited one of our co-authors to serve as a reviewer and chose to publish all reviewer comments along with their responses online. Such transparency is essential in the often-polarized climate science debate.

The final word probable hasn’t been said about this matter yet. KNMI keeps claiming that heatwaves are much more frequent now than in the past. It is true that there is an increase in tropical days, especially since the nineties. But the original and also the new homogenized data also show a lot of variability in the past. Here are three versions of the number of tropical days per year (version 0 is unhomogenized), the graph is made by our coauthor Frans Dijkstra.

Graph showing tropical days in De Bilt, version 0; includes data from 1907 to 2022, with a trend line.
Tropical days at De Bilt, version 0, 1 and 2 (staves) with non-linear trendline (orange solid line).
The trendline was calculated by the LOESS-function with span=20 points.

The long-term temperature trend in the Netherlands is clearly upward, particularly since the 1990s, though a comparable peak occurred in the 1940s. As demonstrated in our peer-reviewed paper with Jos de Laat (who is affiliated with KNMI), Dutch temperatures exhibited a stepwise increase starting in the late 1980s. Furthermore, a compelling study by two Dutch mathematicians — a father-and-son team — argues that changes in atmospheric circulation patterns, rather than CO₂, are the primary driver of temperature variations in the Netherlands. The findings of that paper may well become the focus of the next debate with KNMI.

_________________________________________________________________________________________________________

Marcel Crok

Marcel Crok is a Dutch science journalist who has been writing full-time about the climate debate and climate policy since an award winning article about the notorious hockey stick graph in 2005.

He published two books in Dutch (De Staat van het Klimaat (The State of the Climate) and was co-author of the book Ecomodernisme (Ecomodernism)). With the British independent researcher Nic Lewis he wrote an extensive report about climate sensitivity, titled A Sensitive Matter.

He was asked by the Dutch government to become expert reviewer of the IPCC AR5 report. Together with the Dutch climate institutes KNMI and PBL, Crok set up an international discussion platform Climate Dialogue.


In 2019, Crok and emeritus professor Guus Berkhout founded the Clintel Foundation. They published the World Climate Declaration, which has now been signed by over 2000 scientists and experts.

Together with Andy May and a team of scientists from the Clintel network, Crok contributed to and edited the book The Frozen Climate Views of the IPCC.

Three Radical Ideas to Reform the Scientific Enterprise

Science journalist Matt Kaplan critiques the current scientific funding and career system for being inefficient, biased toward safe incremental work, favoring established (often older) researchers, and suppressing bold, risky, or novel ideas from younger scientists. Kaplan proposes three provocative reforms to inject more innovation, reduce conservatism, and better support breakthrough potential.

A distressed scientist in a lab, resting his head in his hands, surrounded by laboratory equipment including a microscope and glass beakers.

Science journalist Matt Kaplan critiques the current scientific funding and career system for being inefficient, biased toward safe incremental work, favoring established (often older) researchers, and suppressing bold, risky, or novel ideas from younger scientists. Kaplan proposes three provocative reforms to inject more innovation, reduce conservatism, and better support breakthrough potential.

____________________________________________________________________________________

A person's hand using a pen-like tool to mark an egg, with a test tube rack in the background and other eggs visible.

From Watts Up With That?

By Ross Pomeroy

From afar, science is a marvelous thing, a humming engine of discovery that simultaneously reveals the wonders of our world and makes it a better place for all to live in. But when you get a little closer and scrutinize science’s innards, you realize that it’s not exactly a well-oiled machine – far from it. The engine is noisy, inefficient, and in dire need of maintenance.

This engine is a metaphor for the modern scientific enterprise, the system through which scientists today solve problems, generate new knowledge, and innovate. By and large – at least in the academic setting – it boils down to: secure funding, conduct experiments, publish the results, repeat. This monotonous system is in many ways antithetical to the idealized form of science: delving into the unknown and testing sometimes wild ideas to discover something new and potentially world changing. All too often, funding agencies won’t financially back risky ideas, so money regularly flows to older researchers with many publications under their belt in tried-and-true areas of research. Younger researchers with fresh hypotheses can be ignored, or worse, openly attacked.

In his forthcoming book, I Told You So!: Scientists Who Were Ridiculed, Exiled, and Imprisoned for Being Right, science journalist Matt Kaplan shined a light on some of the pitfalls of the current system through which science is done. More importantly, he also offered some solutions. Here are three of the most radical:

1. Award grants through a lottery

To receive money for their work, scientists typically write grants to funding agencies explaining their ideas, how these ideas should be tested, and why they should be funded. Agencies first review these proposals for scientific merit, weeding out the bogus from the legitimate. Afterwards, the proposals are sent to committees where members must decide between “proposals that are good and those that are excellent,” Kaplan described. This process is the most time-consuming and often results in decisions whereby members fall back on factors like age, prestige, and familiarity. In other words, they opt for safety and status quo rather than risky and novel. Instead, at this stage, grants should be awarded randomly with a lottery, Kaplan suggests.

2. Take a note from Willy Wonka with ‘Golden Tickets’

Imagine a committee meeting in which an expert is thoroughly enamored with a new idea presented in a grant, but their colleagues have reservations. Under present conditions, that grant stands no chance. But with a golden ticket, it does.

“The notion behind the golden ticket methodology is that reviewers working on grant-­awarding committees can each be given the power to override their colleagues on one occasion during consideration of applications,” Kaplan explains. “Proposals with unusual ideas and higher risks stand a better chance of getting funding than they do now since just a single reviewer can say, “This is cool, we should give it a try!”

However, such a system would need safeguards to guard against corruption or blatant favoritism. Any reviewer caught selling their tickets or using them regularly on allies would be suspended.

3. Older researchers should step back.

Nobody likes to be told they are old, but the simple fact is that people “become more conservative, rigid, and risk averse as they get older,” Kaplan writes. Scientists are no different. They grow more hostile to new ideas while at the same time drawing exorbitant salaries and competing with younger, more driven scientists. Perhaps they should take a step back, for the good of science?

Kaplan offered ideas for what they could do instead to promote the scientific endeavor.

“If an older scientist has good mentoring abilities, they should move to a smaller lab space, shift to a lower salary, and continue mentoring. If the older scientist is a good author, they should pivot toward writing more books. If they are talented at editing, journals are always in need of people who can help with reviewing and editing articles that come in. What matters most is that they take a step back as they enter old age to free up essential resources for young researchers.”

This article was originally published by RealClearScience and made available via RealClearWire.

A cartoon-style illustration of a young male character wearing a lab coat over a red shirt, standing with arms outstretched in a welcoming pose.

UAH Stays Cool January 2026

The post below updates the UAH record of air temperatures over land and ocean. Each month and year exposes again the growing disconnect between the real world and the Zero Carbon zealots. It is as though the anti-hydrocarbon band wagon hopes to drown out the data contradicting their justification for the Great Energy Transition. Yes, there was warming from an El Nino buildup coincidental with North Atlantic warming, but no basis to blame it on CO2.

A serene ocean view at sunrise, featuring sunlight reflecting on the water and dramatic clouds in the sky.

From Science Matters

By Ron Clutz

The post below updates the UAH record of air temperatures over land and ocean. Each month and year exposes again the growing disconnect between the real world and the Zero Carbon zealots.  It is as though the anti-hydrocarbon band wagon hopes to drown out the data contradicting their justification for the Great Energy Transition.  Yes, there was warming from an El Nino buildup coincidental with North Atlantic warming, but no basis to blame it on CO2.

As an overview consider how recent rapid cooling completely overcame the warming from the last 3 El Ninos (1998, 2010 and 2016).  The UAH record shows that the effects of the last one were gone as of April 2021, again in November 2021, and in February and June 2022.  At year end 2022 and continuing into 2023 global temp anomaly matched or went lower than average since 1995, an ENSO neutral year. (UAH baseline is now 1991-2020). Then there was an usual El Nino warming spike of uncertain cause, unrelated to steadily rising CO2, and now dropping steadily back toward normal values.

Graph displaying UAHv6 global TLT air temperature anomalies (land and ocean) from 1995 to 2023, showing trends in temperature anomalies and CO2 levels over time.

For reference I added an overlay of CO2 annual concentrations as measured at Mauna Loa.  While temperatures fluctuated up and down ending flat, CO2 went up steadily by ~66 ppm, an 18% increase.

Furthermore, going back to previous warmings prior to the satellite record shows that the entire rise of 0.8C since 1947 is due to oceanic, not human activity.

gmt-warming-events

The animation is an update of a previous analysis from Dr. Murry Salby.  These graphs use Hadcrut4 and include the 2016 El Nino warming event.  The exhibit shows since 1947 GMT warmed by 0.8 C, from 13.9 to 14.7, as estimated by Hadcrut4.  This resulted from three natural warming events involving ocean cycles. The most recent rise 2013-16 lifted temperatures by 0.2C.  Previously the 1997-98 El Nino produced a plateau increase of 0.4C.  Before that, a rise from 1977-81 added 0.2C to start the warming since 1947.

Importantly, the theory of human-caused global warming asserts that increasing CO2 in the atmosphere changes the baseline and causes systemic warming in our climate.  On the contrary, all of the warming since 1947 was episodic, coming from three brief events associated with oceanic cycles. And in 2024 we saw an amazing episode with a temperature spike driven by ocean air warming in all regions, along with rising NH land temperatures, now dropping well below its peak.

Chris Schoeneveld has produced a similar graph to the animation above, with a temperature series combining HadCRUT4 and UAH6. H/T WUWT

Graph depicting global warming trends from 1944 to 2021, highlighting pauses and the influence of large el Niño events, with temperature changes noted in degrees Celsius.

See Also Worst Threat: Greenhouse Gas or Quiet Sun?

January 2026 UAH Temps: Tropical Cooling with Slight Warming Elsewhere 

Graphic depicting a historic theme, featuring the text 'One if by Land & Two if by Sea' alongside an image of a statue of Paul Revere against a nighttime backdrop with a moon.

With apologies to Paul Revere, this post is on the lookout for cooler weather with an eye on both the Land and the Sea.  While you heard a lot about 2020-21 temperatures matching 2016 as the highest ever, that spin ignores how fast the cooling set in.  The UAH data analyzed below shows that warming from the last El Nino had fully dissipated with chilly temperatures in all regions. After a warming blip in 2022, land and ocean temps dropped again with 2023 starting below the mean since 1995.  Spring and Summer 2023 saw a series of warmings, continuing into 2024 peaking in April, then cooling off to the present.

UAH has updated their TLT (temperatures in lower troposphere) dataset for January 2026. Due to one satellite drifting more than can be corrected, the dataset has been recalibrated and retitled as version 6.1 Graphs here contain this updated 6.1 data.  Posts on their reading of ocean air temps this month are ahead the update from HadSST4 or OISST2.1.  I posted recently on SSTs December 2025 All Ocean SSTs Cool to Mean. These posts have a separate graph of land air temps because the comparisons and contrasts are interesting as we contemplate possible cooling in coming months and years.

Sometimes air temps over land diverge from ocean air changes. In July 2024 all oceans were unchanged except for Tropical warming, while all land regions rose slightly. In August we saw a warming leap in SH land, slight Land cooling elsewhere, a dip in Tropical Ocean temp and slightly elsewhere.  September showed a dramatic drop in SH land, overcome by a greater NH land increase. 2025 has shown a sharp contrast between land and sea, first with ocean air temps falling in January recovering in February.  Then in November and December SH land temps spiked while ocean temps showed litle change.  January 2026 showed NH land warming 0.1C, SH less, while ocean temps changed little, except for Tropical co9oling by 0.1C.

Note:  UAH has shifted their baseline from 1981-2010 to 1991-2020 beginning with January 2021.   v6.1 data was recalibrated also starting with 2021. In the charts below, the trends and fluctuations remain the same, but the anomaly values changed with the baseline reference shift.

An illustration of a satellite orbiting Earth, showcasing its solar panels and various scientific instruments against a backdrop of space.

Presently sea surface temperatures (SST) are the best available indicator of heat content gained or lost from earth’s climate system.  Enthalpy is the thermodynamic term for total heat content in a system, and humidity differences in air parcels affect enthalpy.  Measuring water temperature directly avoids distorted impressions from air measurements.  In addition, ocean covers 71% of the planet surface and thus dominates surface temperature estimates.  Eventually we will likely have reliable means of recording water temperatures at depth.

Recently, Dr. Ole Humlum reported from his research that air temperatures lag 2-3 months behind changes in SST.  Thus, cooling oceans portend cooling land air temperatures to follow.  He also observed that changes in CO2 atmospheric concentrations lag behind SST by 11-12 months.  This latter point is addressed in a previous post Who to Blame for Rising CO2?

After a change in priorities, updates are now exclusive to HadSST4.  For comparison we can also look at lower troposphere temperatures (TLT) from UAHv6.1 which are now posted for January 2026.  The temperature record is derived from microwave sounding units (MSU) on board satellites like the one pictured above. Recently there was a change in UAH processing of satellite drift corrections, including dropping one platform which can no longer be corrected. The graphs below are taken from the revised and current dataset.

The UAH dataset includes temperature results for air above the oceans and thus should be most comparable to the SSTs. There is the additional feature that ocean air temps avoid Urban Heat Islands (UHI).  The graph below shows monthly anomalies for ocean air temps since January 2015.

Line graph depicting anomalies in ocean air temperatures over time, including data for the globe, Northern Hemisphere (NH), Southern Hemisphere (SH), and tropics. The y-axis represents temperature anomalies in degrees Celsius, while the x-axis shows time from January 2005 to October 2023.

In 2021-22, SH and NH showed spikes up and down while the Tropics cooled dramatically, with some ups and downs, but hitting a new low in January 2023. At that point all regions were more or less in negative territory.

After sharp cooling everywhere in January 2023, there was a remarkable spiking of Tropical Ocean temps from -0.5C up to + 1.2C in January 2024.  The rise was matched by other regions in 2024, such that the Global anomaly peaked at 0.86C in April. Since then, all regions have cooled down sharply to a low of 0.27C in January.  In February 2025, SH rose from 0.1C to 0.4C pulling the Global ocean air anomaly up to 0.47C, where it stayed in March and April. In May drops in NH and Tropics pulled the air temps over oceans down despite an uptick in SH. At 0.43C, ocean air temps were similar to May 2020, albeit with higher SH anomalies. In November/December all regions are cooler, led by a sharp drop in SH bringing the Global ocean anomaly down to 0.02C. January saw continued Tropical cooling offset by NH warming.

Land Air Temperatures Tracking in Seesaw Pattern

We sometimes overlook that in climate temperature records, while the oceans are measured directly with SSTs, land temps are measured only indirectly.  The land temperature records at surface stations sample air temps at 2 meters above ground.  UAH gives tlt anomalies for air over land separately from ocean air temps.  The graph updated for January is below.

Line graph depicting land air temperature anomalies from UAHv6.1, showing trends for Globe, Northern Hemisphere, Southern Hemisphere, and Tropics from 2015 to 2023.

Here we have fresh evidence of the greater volatility of the Land temperatures, along with extraordinary departures by SH land.  The seesaw pattern in Land temps is similar to ocean temps 2021-22, except that SH is the outlier, hitting bottom in January 2023. Then exceptionally SH goes from -0.6C up to 1.4C in September 2023 and 1.8C in August 2024, with a large drop in between.  In November, SH and the Tropics pulled the Global Land anomaly further down despite a bump in NH land temps. February showed a sharp drop in NH land air temps from 1.07C down to 0.56C, pulling the Global land anomaly downward from 0.9C to 0.6C. Some ups and downs followed with returns close to February values in August.  A remarkable spike in October was completely reversed in November/December, along with NH dropping sharply bringing the Global Land anomaly down to 0.52C, half of its peak value of 1.17C 09/2024. Now in January Global land rebounded up to 0.61C, led by NH warming s similar amount.

The Bigger Picture UAH Global Since 1980
Line graph depicting UAHv6.1 global lower troposphere air temperature anomalies over time, showing monthly fluctuations in degrees Celsius from January 1979 to December 2022, with a horizontal line indicating the mean anomaly.

The chart shows monthly Global Land and Ocean anomalies starting 01/1980 to present.  The average monthly anomaly is -0.02 for this period of more than four decades.  The graph shows the 1998 El Nino after which the mean resumed, and again after the smaller 2010 event. The 2016 El Nino matched 1998 peak and in addition NH after- effects lasted longer, followed by the NH warming 2019-20.   An upward bump in 2021 was reversed with temps having returned close to the mean as of 2/2022.  March and April brought warmer Global temps, later reversed

With the sharp drops in Nov., Dec. and January 2023 temps, there was no increase over 1980. Then in 2023 the buildup to the October/November peak exceeded the sharp April peak of the El Nino 1998 event. It also surpassed the February peak in 2016. In 2024 March and April took the Global anomaly to a new peak of 0.94C.  The cool down started with May dropping to 0.9C, later months declined steadily until August Global Land and Ocean was down to 0.39C. then rose slightly to 0.53 in October. Now in January 2026 it is back down to 0.35C.

The graph reminds of another chart showing the abrupt ejection of humid air from Hunga Tonga eruption.

Graph showing upper atmosphere water vapor content from 2006 to 2023, indicating a spike due to the Hunga Tonga–Hunga Ha'apai eruption on January 15, 2022, which injected approximately 150 million tonnes of water into the stratosphere.

TLTs include mixing above the oceans and probably some influence from nearby more volatile land temps. Clearly NH and Global land temps have been dropping in a seesaw pattern, nearly 1C lower than the 2016 peak. Since the ocean has 1000 times the heat capacity as the atmosphere, that cooling is a significant driving force. TLT measures started the recent cooling later than SSTs from HadSST4, but are now showing the same pattern. Despite the three El Ninos, their warming had not persisted prior to 2023, and without them it would probably have cooled since 1995. Of course, the future has not yet been written.

A close-up of a person's hand holding a pen above a piece of paper, with a quote by Omar Khayyam in decorative text on the side.

If You Think the Colossal Net Zero Spending Will End in 2050 Then These Three Countries Will Soon Set, You Straight

The latest fantasy figure for international climate aid is $300 billion a year, to be paid by a diminishing band of Net Zero fanatical countries (looking at you Europe). But at least, come 2050, when the world is awash with green riches with energy too cheap to meter, it will all be worthwhile, and the scam – pardon – worthwhile investment can stop. If only. Look no further than the three countries that on many counts have already hit Net Zero, namely Suriname, Panama and Bhutan, for guidance on future investment demands.

A dystopian urban landscape with damaged buildings and debris, featuring the text 'NET ZERO 2050' prominently displayed against a dramatic, cloudy sky.

From The Daily Sceptic

By Chris Morrison

Panoramic view of a modern skyline in Panama City, featuring high-rise buildings along a waterfront with greenery and a curved road.

The latest fantasy figure for international climate aid is $300 billion a year, to be paid by a diminishing band of Net Zero fanatical countries (looking at you Europe). But at least, come 2050, when the world is awash with green riches with energy too cheap to meter, it will all be worthwhile, and the scam – pardon – worthwhile investment can stop. If only. Look no further than the three countries that on many counts have already hit Net Zero, namely Suriname, Panama and Bhutan, for guidance on future investment demands. All three countries are heavily forested and all demand billions of dollars to keep these ‘carbon’ sinks in place. Sustainability is the name of the game, or to put it another way: ‘Nice little forest we got here. Shame if anything happened to it.’

Suriname is a small South American country with a population of just 640,000 and an annual GDP of $4.5 billion. In its latest UN Nationally Determined Contribution (NDC) it asks for $4.5 billion to be paid over the next decade to reaffirm its commitment to remaining carbon negative through “forest preservation”. Money is also sought from many other international sources, and the country is a leading light in the cash for ‘climate justice’ shake down. Panama is also keen on maintaining its carbon neutrality status, but, needless to say, such virtue does not come cheap. In its latest NDC, the country seems wary of producing cash figures but there is one mention of the need for $1.23 billion for 21 adaptation initiatives. A recently announced plan for a dedicated nature conservancy plan calls for new, additional, predictable, assessable and non-debt increasing international aid. In other words, a regular one-way lorry load of cash.

As the Daily Sceptic reported recently, the big winner in this giant Net Zero cash protection scheme is Bhutan. This small, landlocked country in the eastern Himalayas has huge hydroelectric power, while 93% of the land is carpeted with carbon dioxide absorbing forest. As the poster country for Net Zero, its demands for waterfalls of cash are suitably impressive. With a population of only 800,000 and a GDP of around $3 billion, it notes in its latest NDC that it requires “continued and predictable” financial support amounting to $13.7 billion over the next decade.

In the land of the Net Zero cult, cash might not be God, but it is a deeply religious experience. Sadly, the collection plate has come back a bit light of late. In America, President Trump has ruthlessly cut federal funds for both domestic and international Net Zero boondoggles. The United Nations, which is the ringmaster for pumping up climate panic, is talking about financial collapse after the Americans withdrew the feeding bottle. Indeed, the Secretary-General Antonio Guterres recently spoke of the organisation being on the “brink of bankruptcy”. But then this particularly clownish act often gives a passable impression of complete derangement having recently claimed that the era of “global boiling” had arrived.

No doubt some international aid does environmental good in the developing world once it has passed through the sticky fingers of those on the crowded bandwagon from politicians to NGOs. But the stories of waste and misappropriation are legendary. In 2023, a database of ‘climate finance’ was compiled by Reuters in collaboration with researchers from Big Local News. Drawn together from UN data filed by countries signed up to what was then a $100 billion annual pledge, it highlighted spending from 2015-2020 on new coal and gas-fired power stations, along with airport and hotel developments. At the time, it seems that a number of countries were sticking a ‘climate’ tag on already existing foreign aid commitments.

At least oil and gas plants are more useful than hopeless wind turbines. Different considerations were no doubt applied for the Italian contributions that helped a retailer set up a chain of chocolate and gelato stores across Asia. Persuading an Italian to open an ice cream shop does not normally require subsidies from the taxpayer. Meanwhile, the Belgians chipped in with funding for a romantic film about a green activist and a rugby-playing logger set in the rainforest. The film does not appear to have had a large distribution but one can only hope that in the end the chap managed to get his log over.

Getting screwed is the name of the game for long-suffering taxpayers in the developed world. In the last 20 years, average income in the Maldives has quintupled to around $19,000, helped by a massive growth in the tourism industry. The Maldives is one of those chains of Pacific islands where constant mainstream fears of inundation by sea level rise are matched by frequently ignored scientific data showing overall land growth. There has been huge recent development of infrastructure including hotels and airports. The country promises to reduce its emissions, but this is said to be “conditional” on collecting “adequate international support”. Primary areas for support are said to be renewable electricity and waste management. Many resort hotels continue to pump some untreated sewage into the sea.

The Maldives offers an idyllic tropical vacation for high-end tourists. It is not immediately clear why they, along with the increasingly wealthy owners of local businesses, cannot pay for necessary sewage facilities, rather than poorer taxpayers thousands of miles away who might only dream of such a holiday.

Chris Morrison is the Daily Sceptic’s Environment Editor. Follow him on X.

ABC: Green China is Building Lots of Backup Coal Plants Because They Need Reliable Energy

“… The government’s response [to energy shortages] was to signal that it wanted more coal plants …”

A smiling man in a dark suit stands in front of wind turbines and solar panels under a bright sun and blue sky, representing renewable energy.

From Watts Up With That?

Essay by Eric Worrall

A whimsical illustration featuring a unicorn with a rainbow mane jumping over solar panels, set against a vibrant landscape with wind turbines and blue skies.

“… The government’s response [to energy shortages] was to signal that it wanted more coal plants …”

Why China is building so many coal plants despite its solar and wind boom

China has significantly increased its coal power capacity, reviving concerns about its climate-changing carbon emissions

By KEN MORITSUGU Associated Press
February 3, 2026, 5:42 PM

Overall, China brought 78 gigawatts of new coal power capacity online, a sharp uptick from previous years, …

China added 315 gigawatts of solar capacity and 119 gigawatts of wind in 2025 …

The massive growth in wind and solar begs the question: Why is China still building coal power plants and, by most analyses, way more than it actually needs? 

The answer is complicated.

China is at an earlier development stage than the United States or Europe, so it needs more energy to keep growing. If more of the nation’s 1.4 billion people climb into the middle class, more will be able to afford air conditioners and washing machines.

Power shortages in parts of China in 2021 and 2022 reinforced longstanding concerns about energy security. Some factories temporarily halted production and one city imposed rolling blackouts.

The government’s response was to signal that it wanted more coal plants, leading to a surge in applications and permits for their construction.

…Read more: https://abcnews.go.com/International/wireStory/china-building-coal-plants-despite-solar-wind-boom-129805102

I’m so confused. I thought renewables were cheaper than coal. And China is the king of building cheap batteries. So why would China need 78 gigawatts of coal to back up 315 + 119 = 434GW of renewables?

Could it be that renewables + backup is not a viable solution to a nation’s energy needs, even when the people implementing that solution are the global leaders of manufacturing green energy components?

Of course, Western apologists and Chinese propagandists insist that China has special needs, that the coal is just temporary. If China abandons renewables all green hope is lost, so they’ll tie themselves in knots trying to excuse China’s skyrocketing carbon emissions.

But nobody builds a new coal plant which they intent to shut down in the near future, those coal plants will still be humming long after all of China’s wind turbines and solar panels are dust.

An industrial scene featuring oil refineries with smokestacks set against a vibrant red background adorned with the Chinese flag.