Global warming, climate change, all these things are just a dream come true for politicians. I deal with evidence and not with frightening computer models because the seeker after truth does not put his faith in any consensus. The road to the truth is long and hard, but this is the road we must follow. People who describe the unprecedented comfort and ease of modern life as a climate disaster, in my opinion have no idea what a real problem is.
The January-2023 mean temperature data from the Japan Meteorological Agency (JMA) for Tokyo and its Hachijō-jima island in the Pacific have just been released.
The January-2023 mean temperature data from the Japan Meteorological Agency (JMA) for Tokyo and its Hachijō-jima island in the Pacific have just been released.
Not surprisingly honest institutes that don’t rewrite history like the the JMA show temperature trends that are not unusual.
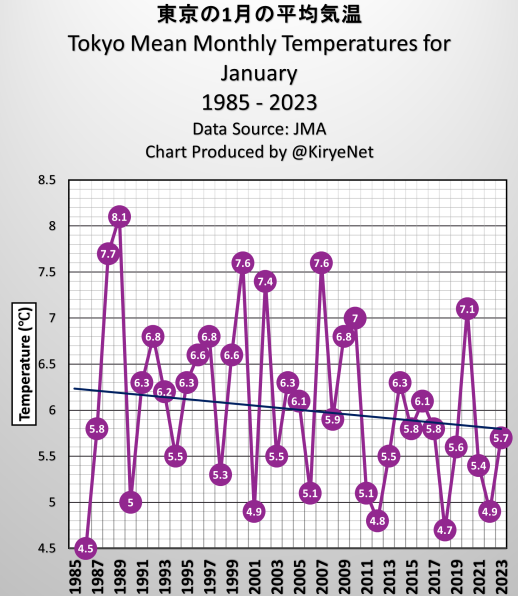
First we look at the JMA temperature data and linear trend since 1985 for the megacity of Tokyo:
Mid winter (January) in Tokyo has been cooling over the past 38 years! No warming – winter seems to be getting harsher.
Hachijō-jima
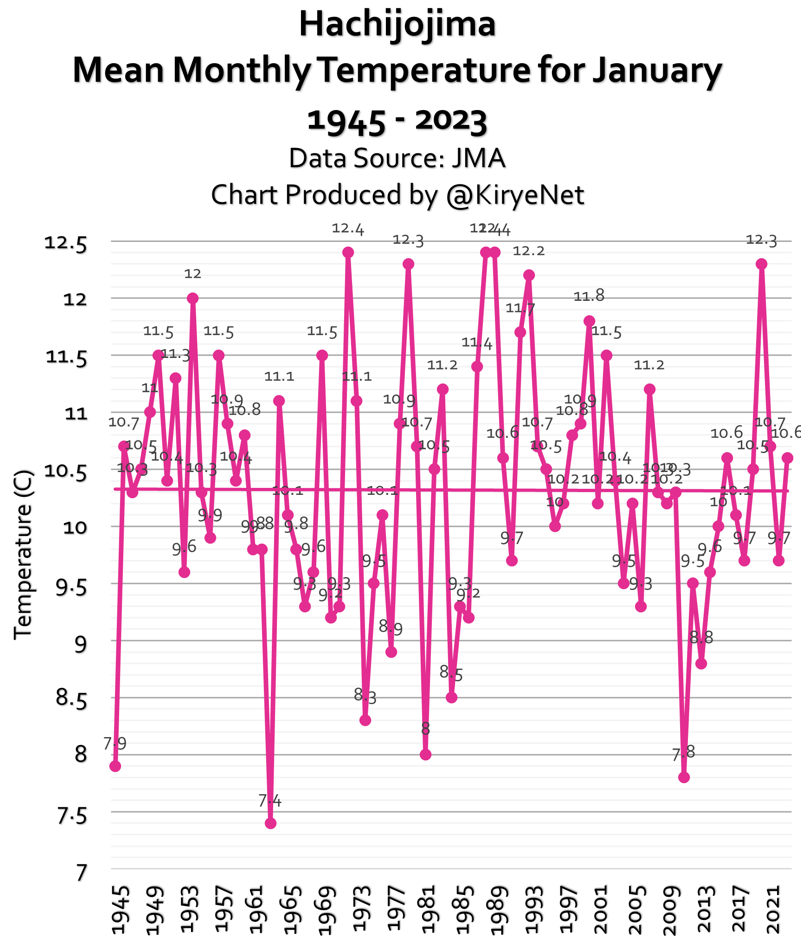
Next we look at the mean January temperature of the Tokyo offshore island of Hachijō-jima, going back to 1945. Due to its rural location, the urban heat island effects allow cleaner temperature readings than what we find in the middle of Tokyo’s sea of concrete, asphalt, steel and waste heat from heating and automobiles:
Hachijō-jima island is located 287 kilometers south of Tokyo, in the Pacific Ocean. Here as well the January mean temperature trend hasn’t risen in nearly 80 years. It too has cooled since 1985, linear trend.
Reuters finally joins Twitter, Associated Press, Australian Associated Press and FactCheck.org in fake fact-checking my monster 13 million-view tweet about no warming since 2015.
Reuters fake fact check is like the others, claiming that I cherry-picked a timeframe and that time frame unfairly represents the long-term warming trend.
That’s all just lies.
1. The global warming con is that greenhouse gas emissions are warming the planet and that every emission warms the planet.
2. That is obviously not true as we have just completed 8 years and 5 months with no warming despite 475 billion tons of emissions worth about 14% of total manmade CO2.
3. Of course there is a long-term warming trend, but it most recently commenced around 1650 at the bottom of the Little Ice Age, before coal plants, SUVs and cheeseburgers.
4. But there is no warming that can be associated with emissions. What we have, at least in recent decades, is a step-wise warming driven by El Nino, not emissions.
Clearly, the point I made has panicked Big Climate. Thank you Reuters Fact Check for showing us what liars you are.
Importantly, the theory of human-caused global warming asserts that increasing CO2 in the atmosphere changes the baseline and causes systemic warming in our climate. On the contrary, all of the warming since 1947 was episodic, coming from three brief events associated with oceanic cycles.
The post below updates the UAH record of air temperatures over land and ocean. But as an overview consider how recent rapid cooling completely overcame the warming from the last 3 El Ninos (1998, 2010 and 2016). The UAH record shows that the effects of the last one were gone as of April 2021, again in November 2021, and in February and June 2022 Now at year end 2022 and continuing into January 2023 we have again global temp anomaly lower than average since 1995. (UAH baseline is now 1991-2020).
For reference I added an overlay of CO2 annual concentrations as measured at Mauna Loa. While temperatures fluctuated up and down ending flat, CO2 went up steadily by ~60 ppm, a 15% increase.
Furthermore, going back to previous warmings prior to the satellite record shows that the entire rise of 0.8C since 1947 is due to oceanic, not human activity.
The animation is an update of a previous analysis from Dr. Murry Salby. These graphs use Hadcrut4 and include the 2016 El Nino warming event. The exhibit shows since 1947 GMT warmed by 0.8 C, from 13.9 to 14.7, as estimated by Hadcrut4. This resulted from three natural warming events involving ocean cycles. The most recent rise 2013-16 lifted temperatures by 0.2C. Previously the 1997-98 El Nino produced a plateau increase of 0.4C. Before that, a rise from 1977-81 added 0.2C to start the warming since 1947.
Importantly, the theory of human-caused global warming asserts that increasing CO2 in the atmosphere changes the baseline and causes systemic warming in our climate. On the contrary, all of the warming since 1947 was episodic, coming from three brief events associated with oceanic cycles.
Update August 3, 2021
Chris Schoeneveld has produced a similar graph to the animation above, with a temperature series combining HadCRUT4 and UAH6. H/T WUWT
With apologies to Paul Revere, this post is on the lookout for cooler weather with an eye on both the Land and the Sea. While you will hear a lot about 2020-21 temperatures matching 2016 as the highest ever, that spin ignores how fast the cooling set in. The UAH data analyzed below shows that warming from the last El Nino was fully dissipated with chilly temperatures in all regions. After a warming blip in 2022, land and ocean temps dropped again with 2023 starting below the mean since 1995.
UAH has updated their tlt (temperatures in lower troposphere) dataset for January 2023. Posts on their reading of ocean air temps this month came ahead of updated records from HadSST4. I have previously posted on SSTs using HadSST4 Ocean Temps Dropping November 2022This month also has a separate graph of land air temps because the comparisons and contrasts are interesting as we contemplate possible cooling in coming months and years. Sometimes air temps over land diverge from ocean air changes. However, in January temps in all land and ocean regions dropped sharply.
Note: UAH has shifted their baseline from 1981-2010 to 1991-2020 beginning with January 2021. In the charts below, the trends and fluctuations remain the same but the anomaly values change with the baseline reference shift.
Presently sea surface temperatures (SST) are the best available indicator of heat content gained or lost from earth’s climate system. Enthalpy is the thermodynamic term for total heat content in a system, and humidity differences in air parcels affect enthalpy. Measuring water temperature directly avoids distorted impressions from air measurements. In addition, ocean covers 71% of the planet surface and thus dominates surface temperature estimates. Eventually we will likely have reliable means of recording water temperatures at depth.
Recently, Dr. Ole Humlum reported from his research that air temperatures lag 2-3 months behind changes in SST. Thus the cooling oceans now portend cooling land air temperatures to follow. He also observed that changes in CO2 atmospheric concentrations lag behind SST by 11-12 months. This latter point is addressed in a previous post Who to Blame for Rising CO2?
After a change in priorities, updates are now exclusive to HadSST4. For comparison we can also look at lower troposphere temperatures (TLT) from UAHv6 which are now posted for December. The temperature record is derived from microwave sounding units (MSU) on board satellites like the one pictured above. Recently there was a change in UAH processing of satellite drift corrections, including dropping one platform which can no longer be corrected. The graphs below are taken from the revised and current dataset.
The UAH dataset includes temperature results for air above the oceans, and thus should be most comparable to the SSTs. There is the additional feature that ocean air temps avoid Urban Heat Islands (UHI). The graph below shows monthly anomalies for ocean air temps since January 2015.
Note 2020 was warmed mainly by a spike in February in all regions, and secondarily by an October spike in NH alone. In 2021, SH and the Tropics both pulled the Global anomaly down to a new low in April. Then SH and Tropics upward spikes, along with NH warming brought Global temps to a peak in October. That warmth was gone as November 2021 ocean temps plummeted everywhere. After an upward bump 01/2022 temps reversed and plunged downward in June. After an upward spike in July, ocean air everywhere cooled in August and also in September. Now in January 2023, sharp cooling everywhere brought all regions into negative territory.
Land Air Temperatures Tracking Downward in Seesaw Pattern
We sometimes overlook that in climate temperature records, while the oceans are measured directly with SSTs, land temps are measured only indirectly. The land temperature records at surface stations sample air temps at 2 meters above ground. UAH gives tlt anomalies for air over land separately from ocean air temps. The graph updated for January is below.
Here we have fresh evidence of the greater volatility of the Land temperatures, along with extraordinary departures by SH land. Land temps are dominated by NH with a 2021 spike in January, then dropping before rising in the summer to peak in October 2021. As with the ocean air temps, all that was erased in November with a sharp cooling everywhere. After a summer 2022 NH spike, land temps dropped everywhere, and in January, a NH upward bump offset further cooling in SH and Tropics to leave Global land anomaly unchanged.
The Bigger Picture UAH Global Since 1980
The chart shows monthly Global anomalies starting 01/1980 to present. The average monthly anomaly is -0.06, for this period of more than four decades. The graph shows the 1998 El Nino after which the mean resumed, and again after the smaller 2010 event. The 2016 El Nino matched 1998 peak and in addition NH after effects lasted longer, followed by the NH warming 2019-20. An upward bump in 2021 was reversed with temps having returned close to the mean as of 2/2022. March and April brought warmer Global temps, later reversed, and with the sharp drops in Nov., Dec. and now January temps, there is no increase over 1980.
TLTs include mixing above the oceans and probably some influence from nearby more volatile land temps. Clearly NH and Global land temps have been dropping in a seesaw pattern, nearly 1C lower than the 2016 peak. Since the ocean has 1000 times the heat capacity as the atmosphere, that cooling is a significant driving force. TLT measures started the recent cooling later than SSTs from HadSST3, but are now showing the same pattern. It seems obvious that despite the three El Ninos, their warming has not persisted, and without them it would probably have cooled since 1995. Of course, the future has not yet been written.
Two German Last Generation street-blocking climate protesters, roundly criticized for glaring hypocrisy after taking 18,000 km roundtrip flight for a 4-month holiday in Thailand…struggled to “reconcile it”…excuse: “wasn’t possible to go by rail or bus”!
Two German Last Generation street-blocking climate protesters, roundly criticized for glaring hypocrisy after taking 18,000 km roundtrip flight for a 4-month holiday in Thailand…struggled to “reconcile it”…excuse: “wasn’t possible to go by rail or bus”!
We’ve all heard about the “Last Generation”: young, mostly spoiled upper middle class, privileged. They glue themselves to streets and block commuters from going to work in order to protest the burning of “climate-changing” fossil fuels. They demand people wean themselves off driving, flying, heating and eating meat. One tonne of CO2 emissions per person or even less each year is plenty, they insist. In fact, people need to start being confined in 15-minute cities!
But now it’s wintertime, and so gluing oneself to the street in freezing weather is just such a drag – and so is going to class or getting a real job. So what’s a spoiled climate cultist to do?
If you’re a member of “Letzte Generation” (Last Generation) like Germans Luisa S. and Yannick S,, who blocked a federal highway near Stuttgart with other activists last September, you book a long-haul flight to Thailand for a long vacation – until late spring!
Previously, Germany’s national daily Bild had inaccurately reported that the two climate kiddies had flown to Bali, and so at Twitter Germany’s Last Generation defended the two jet-setting activists, accusing Bild of spreading misinformation: the truth is that they had flown to Thailand. So there!
In the 12 part-thread, Last Generation went on to dismiss all double standard accusations with a defiant attitude. You see, climate protesters get a pass and jet-setting is the just reward for the hard work of being glued to a street when the weather is warm. They’re special.
Excuse: not possible to go by land!
Luisa S. and Yannick S,, went on to defend their flight to Thailand, claiming: “Conflicts had prevented them from completing the journey “across the Silk Road by train and bus.” According to Bild, the two told the German taz daily that the only option was to fly to Asia because of “the Russian war of aggression, the Syrian civil war, the Turkish invaders in northern Iraq, the Taliban’s seizure of power, the tensions in the Kashmir region and the military coup in Myanmar, to name just a few on the route to Southeast Asia.”
Bild commented on the spectacular excuse: “A cynical instrumentalization of suffering in the world as an absurd justification for one’s own vacation flight!”
Psychology of hypocrisy
The 2 street-blocking climate puppies added: “We are for pretty much exactly four months in Southeast Asia, just in Thailand” and noted it had been “a long-standing dream of Luisa”.
According to Bild, the couple claim they had not been sure whether they could “reconcile it” with their “conscience to get on a plane”. In the end, after a long mental struggle, they said they ultimately made the choice to make the trip.
Last October, the U.S. climate envoy John Kerry suggested that the Democratic Republic of Congo (DRC) should abandon some oil blocks that it had put up for auction.
Last October, the U.S. climate envoy John Kerry suggested that the Democratic Republic of Congo (DRC) should abandon some oil blocks that it had put up for auction.
However, for the people of the DRC — some of the poorest in the world — this could mean more years of pollution and ill-health from dirty cooking fuels such as charcoal.
Welcome to 21st century climate imperialism in Africa.
Climate Imperialism
A prominent form of modern slavery is climate imperialism, or eco-colonialism, wherein restrictive energy policies conceived and promoted by politicians in Western economies are forced on some of the world’s poorest. Though branded as environmentally friendly, these outlandish policies deny economic growth to those who most need it in Africa’s poorest countries.
According to the World Bank, in 2019, over 41% of the population in sub-Saharan Africa lived in extreme poverty. Poor households in Africa often lack access to necessities such as clean water, electricity, cooking fuel and health care. The region’s weak economy coupled with poor infrastructure impedes access to education and job opportunities, further exacerbating poverty.
The West’s war on fossil fuels, which is being promoted with draconian polices in developing countries, adds to the obstacles of overcoming this deprivation.
DRC’s Charcoal Problem
In the DRC, over 63% of the population — around 60 million people — live in extreme poverty, on less than $2.15 a day. Only 23% of the population has access to electricity. And one of the biggest threats to health is the country’s dependence on dirty cooking fuels.
More than 90% of DRC citizens cook with charcoal, whose smokey indoor emissions are a major health concern. In addition, use of charcoal requires people — usually girls and women — to forage for wood, robbing them of valuable time that could be spent on education and acquiring more economically valuable skills. In the DRC, wood cut for charcoal sometimes exceeds quantities taken by loggers, contributing to deforestation of the country.
A solution to the overreliance on charcoal is the gas stove, which lately has been vilified by climate warriors claiming with no scientific basis that the emissions of burning gas are hazardous.
Cooking gas replaces fuels such as charcoal, wood, coal and dung, all of which contribute to indoor air pollution — estimated to cause 4.3 million premature deaths annually across the globe. When cooking gas is burned, the emissions are water vapor and carbon dioxide, both of which are harmless
Imperialism, An Obstruction To Gas Stoves And Gas Production
The DRC government is pursuing policies to make oil and gas more affordable to its population and boost the economy. Last year, 30 oil and gas blocks went up for auction. The move drew sharp criticism from various quarters, including the U.S. administration hostile to fossil fuels, the UN and highly funded mainstream media.
Curbing DRC’s oil and gas production would disrupt a legitimate path to safe and prosperous living, which every other developing country in the world is pursuing — that is, a transition from dirty charcoal to clean and safe gas stoves.
Transitioning to gas is a well-established international policy directive of many bodies like the World Bank. In 2022, the bank’s Energy Sector Management Assistance Program announced a $500 million investment for a clean cooking fund in developing nations. Many Asian countries like Bangladesh, India, Pakistan and Myanmar have immensely benefitted from such efforts. Today more than one billion people in India alone use gas stoves.
Efforts to restrict the production or use of fossil fuels serve to increase the prices of these exceedingly useful energy sources, making them less available to those who need them most. In the DRC’s case, carbon imperialism has taken the route of making the Congolese people remain in abject poverty.
Governments of developing countries that yield to the pressures of climate imperialism — whether to abandon coal-fired power plants or prohibit the use of gas cook stoves — ill serve their people. So far, the DRC government has resisted this.
The DRC government should follow the examples of Asian countries that have committed to providing their people with access to plentiful and economically priced fossil fuels. Otherwise, the misery of poverty, including smokey kitchens, could be the lot of the Congolese for a long time to come.
Vijay Jayaraj is a Research Associate at the CO2 Coalition, Arlington, Virginia. He holds a master’s degree in environmental sciences from the University of East Anglia, UK and resides in India.
Earlier this month, the Consumer Product Safety Commission announced that indoor gas stoves emit harmful pollution and that a ban on selling new ones was, to quote one of the agency’s commissioners, “on the table.”
Earlier this month, the Consumer Product Safety Commission announced that indoor gas stoves emit harmful pollution and that a ban on selling new ones was, to quote one of the agency’s commissioners, “on the table.”
Several studies claim that the use of gas can cause respiratory illness. The CPSC is considering restrictions on gas stoves, including possible bans in new residential construction. But attacks on gas stoves are based on questionable science and are largely driven by concerns not related to health.
The CPSC has reportedly been considering actions on gas stoves since October. Richard Trumka Jr., a CPSC commissioner, stated, “This is a hidden hazard. Any option is on the table. Products that can’t be made safe can be banned.” Two recent studies figure prominently in agency concerns. The first, published in January last year by Eric Lebel and others, found that gas stoves and ovens emit hazardous levels of methane and nitrogen dioxide. The second, published in December last year by Talor Gruenwald and others, estimated that 12.7% of childhood asthma cases in the U.S. were due to gas stove use.
Nitrous oxide is produced at combustion temperatures above 2912 F (1,600 C) by breaking down nitrogen molecules in air. Modern stove burner flames reach temperatures above 2912 F (1,600 C), producing this gas. The nitrous oxide then combines with oxygen to form nitrogen dioxide, a pollutant.
But the amount of NO2 generated by stoves is very small — only at parts per billion (ppb) levels.
The Lebel study measured nitrogen dioxide levels of 100 ppb in kitchens, but this was only possible after sealing the room in plastic — an unrealistic, artificial condition. Other studies have found nitrogen dioxide levels as high as 34 ppb after several hours of stove and oven use. But this level is below the 53 ppb limit of the National Ambient Air Quality Standard of the Environmental Protection Agency. The EPA states that, for nitrogen dioxide levels below 50 ppb, “No health impacts are expected for air quality in this range.”
Meanwhile, most studies do not find hazardous levels of nitrogen dioxide from stove use.
Nevertheless, the Gruenwald study claims that nitrogen dioxide from gas stoves is linked to asthma in children. It used statistical analysis to find an association between stoves and childhood asthma in the U.S. But the study itself states that it reviewed 27 other studies connected to gas stoves, and none reported “associations between gas stove use and childhood asthma.” In addition, the Centers for Disease Control reports that asthma attacks and asthma hospitalizations for U.S. children have been declining since 2001, while U.S. natural gas consumption rose 38% over the same period.
So, then — could it be that health concerns about gas stoves are really just a scare tactic? A pretext for advancing a political issue that people are less likely to care about?
For more than a decade, environmentalists have promoted “electrification” of homes. Historically, the term “electrification” meant extending the electrical grid to rural areas and homes without electricity. But the renewable energy movement redefined electrification to mean eliminating the use of carbon-based fuels such as natural gas. As they see it, electrification of homes means the replacement of gas stoves, furnaces, water heaters, and even propane grills with electric appliances. They say this is needed to reduce greenhouse gas emissions and solve the problem of human-caused climate change.
Talor Gruenwald, the lead author of the study on childhood asthma in the U.S., is employed by the Rocky Mountain Institute, which also funded the study. For three decades, the institute has been working on programs to counter global warming. Eric Lebel is a researcher at Stanford University, with articles on methane emissions from oil and gas wells, gas water heaters, and gas stoves. His goal appears to be to counter global warming through the electrification of homes by claiming harmful health effects from gas appliances.
The Netherlands and the United Kingdom now urge their residents to replace gas appliances with electric appliances and heat pumps as part of programs to reach net-zero emissions. These policies were adopted even though 92% of homes in the Netherlands use gas for heating and 78% of homes in the U.K. use gas. The Netherlands aims to disconnect gas lines from eight million homes by 2050.
An electrification battle rages in the U.S. cities in seven states — California, Colorado, Massachusetts, New York, Oregon, Vermont, and Washington — and these have established bans on gas appliances in new construction. Residents of those states pay significantly more in utility bills with electric appliances. For example, in 2020, the average price of residential natural gas in California was $14.14 per million British Thermal Units. For a new 95-percent-efficiency natural-gas furnace or water heater, this translates to a cost of just under $13 per million BTU. California’s 2020 residential electricity price translates to $60.11 per million BTU. Thus, California residents pay more than four times as much to operate electric stoves, water heaters, and electric baseboard heat compared to gas appliances.
The gas stove bandwagon might not be on its way to your state. In fact, 19 other states have recently enacted laws preventing local governments from banning natural gas and propane, or “impairing a consumer’s ability to choose a utility service.” Another four states have proposed legislation that would prohibit bans by local governments.
The bottom line is that banning gas stoves will raise homeowner costs and reduce choices, without creating any tangible improvement in health.
Steve Goreham is a speaker, author, and independent columnist on energy, sustainability, climate change, and public policy. More than 100,000 copies of his books are now in print, including his latest, Outside the Green Box: Rethinking Sustainable Development.
New Zealand is in a food crisis. Food prices jumped 11.3% over the last 12 months, many families are struggling. The government response is punitive climate taxes and regulations on food production.
How New Zealand plans to tackle climate change: Taxing cow burps
Story by Rachel Pannett Photography by Cameron James McLaren Feb. 1 at 6:30 a.m.
…
His pedigree cows rank among New Zealand’s most productive cattle, the result of careful breeding and quality grazing land. Millions of years of volcanic activity in the area have created rich soils ideal for this kind of free-range, grass-fed farming, helping turn dairy cows into the country’s biggest export earners.
But the digestive processes of the livestock — basically, their burps — emit a powerful greenhouse gas called methane, and as a result, agriculture makes up half of the country’s emissions. Now, the island nation, dubbed the Saudi Arabia of milk for its dominant role in global dairy trade, faces a reckoning over how to balance the outsize contribution that ranchers make to the economy against New Zealand’s need to meet its greenhouse gas pledges.
…
Some farmers will need to reduce their herds to meet those targets, which many worry could drive them out of business. Government modeling suggests that by 2030, sheep and beef revenue would drop by around 20 percent — making many farms nonviable.
Food prices jumped 1.1 per cent in December and were 11.3 per cent higher than a year earlier.
…
Grocery food prices were up 11 per cent, fruit and vegetable prices up 23 per cent, and restaurant meals and ready-to-eat food 7.8 per cent.
…
The Act Party today blamed Labour for the rising food prices.
…
“The Government should stop smothering food producers with bureaucracy and nonsensical rules.”
…
Foodstuffs said the tight labour market, increasing wages, weaker NZ dollar, increasing fertiliser costs for suppliers, and the upcoming end to fuel subsidies were also influencing prices.
Climate change is just the latest socialist excuse for meddling.
Their endless interference, taxes and pointless regulations, the conceited bureaucratic conviction that they know better than people who work the land or manage the factories, always eventually breaks something important, like people’s ability to buy enough food to feed themselves.
Ouch! The ‘rapidly warming’ Arctic, as climate alarmists like to claim, can still pack a hefty punch. Weren’t such days supposed to be over, in theory at least?
Ouch! The ‘rapidly warming’ Arctic, as climate alarmists like to claim, can still pack a hefty punch. Weren’t such days supposed to be over, in theory at least? – – – Weather authorities say an “epic, generational Arctic outbreak” caused record cold temperatures and life-threatening conditions in the northeastern United States on Saturday, reports DW.com.
The summit of Mount Washington in New Hampshire reported a low of minus 78 Celsius (minus 108 Fahrenheit) — the coldest temperature ever recorded in the United States.
Meanwhile, the National Weather Service (NWS) in Caribou, Maine, said it received reports of “frostquakes.”
“Just like earthquakes, [they] generate tremors, thundering sensations. These are caused by sudden cracks in frozen soil or underground water when it’s very cold,” the NWS office wrote on Twitter.
Strong winds also caused a tree branch in western Massachusetts to fall on a car, killing an infant, a district attorney said in a statement.
Homeless population braves record chill
Several cities in the Northeast set or tied record low temperatures for that date on Friday and Saturday. This created a significant risk for homeless people.
In Massachusetts, Governor Maura Healey took the unusual step of keeping the South Station transit hub open overnight so roughly 60 homeless people had a safe place to sleep.
“This is the coldest I ever, ever remember, and I worked the door at a bunch of clubs for 15 years,” one person taking shelter at the station, who has been homeless since December 2021, told the Associated Press news agency.
The fossil fuels that Joe Biden has promised to eliminate from the grid by 2035 supplied 65% of New England’s electricity at 8.00pm on Friday night. The wind and solar that he thinks the US can run on only manged a paltry 4%.
I’ve said and before, and I’ll say it again. If Biden gets his way, how many millions of Americans are going to die as a result?
The man in charge of how the US spends $400bn to shift away from fossil fuels
The Department of Energy’s loan programs office was ‘essentially dormant’, says Jigar Shah, its head – but now it’s ready to bankroll clean energy projects
Deep in the confines of the hulking, brutalist headquarters of the US Department of Energy, down one of its long, starkly lit corridors, sits a small, unheralded office that is poised to play a pivotal role in America’s shift away from fossil fuels and help the world stave off disastrous global heating.
The department’s loan programs office (LPO) was “essentially dormant” under Donald Trump, according to its head, Jigar Shah, but has now come roaring back with a huge war chest to bankroll emerging clean energy projects and technology.
Last year’s vast Inflation Reduction Act grew the previously moribund office’s loan authority to $140bn,while adding a new program worth another $250bn in loan guarantees to retool projects that help cut planet-heating emissions. Which means that Shah, a debonair former clean energy entrepreneur and podcast host who matches his suits with pristine Stan Smiths, oversees resources comparable to the GDP of Norway: all to help turbocharge solar, wind, batteries and a host of other climate technologies in the US.
With a newly divided Congress stymieing any new climate legislation in the foreseeable future, Shah has emerged as one of Washington’s most powerful figures in the effort to confront global heating. Shah says such focus on him is “hyperbolic” but the White House is pinning much of its climate agenda on an office that barely had a dozen people when Shah joined in March 2021. It now has more than 200 staffers as it scrambles to distribute billions in loans to projects across the US.
Why do I describe these loans as “soft” loans? In my opinion, if the projects being financed had any commercial merit, they wouldn’t need to go to the government for money.
Right now, today, the Republicans have a chance to prevent at least some of that $400 billion of US taxpayer’s money being wasted on virtue signalling green trash projects.
Let us hope the Republicans stand their ground during debt ceiling negotiations.




You must be logged in to post a comment.