2026 Update: Fossil Fuels ≠ Global Warming

Previous posts addressed the claim that fossil fuels are driving global warming. This post updates that analysis with the latest (2025) numbers from Energy Institute and compares World Fossil Fuel Consumption (WFFC) with three estimates of Global Mean Temperature (GMT).

From Science Matters

By Ron Clutz

Previous posts addressed the claim that fossil fuels are driving global warming. This post updates that analysis with the latest (2025) numbers from Energy Institute and compares World Fossil Fuel Consumption (WFFC) with three estimates of Global Mean Temperature (GMT). More on both these variables below. Note: Previously these same statistics were hosted by BP.

WFFC

2025 statistics are now available from Energy Institute for international consumption of Energy sources. Statistical Review of World Energy. 

The reporting categories are:
Oil
Natural Gas
Coal
Nuclear
Hydro
Renewables (other than hydro)

Note:  Energy Institute began in 2023 to use Exajoules to replace MToe (Million Tonnes of oil equivalents.) It is logical to use an energy metric which is independent of the fuel source. OTOH renewable advocates have no doubt pressured EI to stop using oil as the baseline since their dream is a world without fossil fuel energy.

From BP conversion table 1 exajoule (EJ) = 1 quintillion joules (1 x 10^18). Oil products vary from 41.6 to 49.4 tonnes per gigajoule (10^9 joules).  Comparing this annual report with previous years shows that global Primary Energy (PE) in MToe is roughly 24 times the same amount in Exajoules.  The conversion factor at the macro level varies from year to year depending on the fuel mix. The graphs below use the new metric.

A new wrinkle in the EI 2026 report is a shift in terminology concerning supply and consumption.  Previous reports headlined Primary Energy Consumption (PEC), but this year the top line is Total Energy Supply (TES).  No doubt the change is to raise the profile of non-carbon energy (NCE).  A comparison with previous years stats shows that consumption numbers for all years from 1965 to 2024 have been lowered in this report, a puzzling result likely due to methodology.  And yet tables show that summing the consumption EJs of each of the six energy categories matches the TES, effectively the same result as Energy Consumption, albeit with lower numbers across the board.  Apparently the motivation was to remove “Primary” to make room for Non Carbon Energy (NCE) sources like renewables that only input into Electricity, a Secondary energy form.

I found this diagram on the internet, but don’t have a link for it at EI itself. However, I can confirm it with statistics from the 2026 Data Report. Those provided the basis for the chart later on. Firstly, here is analysis from 2025 combining the first three, Oil, Gas, and Coal for total fossil fuel consumption world wide (WFFC). The chart below shows the patterns for WFFC compared to world consumption of Primary Energy from 1965 through 2024 from the EI 2025 report.

The graph shows that global Primary Energy (PE) consumption from all sources has grown continuously over nearly 6 decades. Since 1965  oil, gas and coal (FF, sometimes termed “Thermal”) averaged 88% of PE consumed, ranging from 93% in 1965 to 81% in 2024.  Note that in 2020, PE dropped 21 EJ (4%) below 2019 consumption, then increased 31 EJ in 2021.  WFFC for 2020 dropped 24 EJ (5%), then in 2021 gained back 26 EJ to slightly exceed 2019 WFFC consumption. For the 60 year period, all net changes were increases from previous years and were:

Oil207%
Gas555%
Coal183%
WFFC252%
PE308%
And Now The Energy Institute 2026 Report

Note the orange TEC line is slightly below the green line in the 2025 report, and also that FF have a slightly larger % of TEC. The 600 EJ total matches the consumption sum of all energy categories. The green NCE line includes Nuclear, Hydro and Renewables.  WFFC proportion of Total Energy Consumption ranged from 97% in 1965 to 86% in 2025, an average of 91% over those six decades. NCE proportion matches exactly the remainder of TEC after subtracting WFFC, from 2.6% to 13.8%. The Table below shows EJs and %s for 2024 and 2025

2024 EJ2025 EJEJ IncreasesSources2024 %s2025 %s
592.18600.318.14Total
199.04200.971.93Oil33.61%33.48%
148.72150.701.97Gas25.11%25.10%
165.35166.030.68Coal27.92%27.66%
30.7131.040.33Nuclear5.19%5.17%
16.116.10.02Hydro2.72%2.69%
32.2435.453.20Renewables5.45%5.90%
592.18600.318.14Sum of All100.00%100.00%
Renewables Breakdown
Exajoules Consumed
20242025
Solar 7.810.1
Wind9.19.8
Bio and Other15.415.6
Renewables32.235.4

The data show that Wind and Solar energy is about half of the Renewables category, or about 3% of Total Energy Consumed, not much larger than previously.

Global Mean Temperatures. 

Everyone acknowledges that GMT is a fiction since temperature is an intrinsic property of objects, and varies dramatically over time and over the surface of the earth. No place on earth determines “average” temperature for the globe. Yet for the purpose of detecting change in temperature, major climate data sets estimate GMT and report anomalies from it.

UAH record consists of satellite era global temperature estimates for the lower troposphere, a layer of air from 0 to 4km above the surface. HadSST estimates sea surface temperatures from oceans covering 71% of the planet. HadCRUT combines HadSST estimates with records from land stations whose elevations range up to 6km above sea level.

Both GISS LOTI (land and ocean) and HadCRUT4 (land and ocean) use 14.0 Celsius as the climate normal, so I will add that number back into the anomalies. This is done not claiming any validity other than to achieve a reasonable measure of magnitude regarding the observed fluctuations.[Note: HadCRUT4 was discontinued after 2021 in favor of HadCRUT5.]

No doubt global sea surface temperatures are typically higher than 14C, more like 17 or 18C, and of course warmer in the tropics and colder at higher latitudes. Likewise, the lapse rate in the atmosphere means that air temperatures both from satellites and elevated land stations will range colder than 14C. Still, that climate normal is a generally accepted indicator of GMT.

Correlations of GMT and WFFC

The next graph compares WFFC to GMT estimates over the decades from 1965 to 2024 from HadCRUT5, which includes HadSST4.

Since 1965 the increase in fossil fuel consumption is dramatic and monotonic, steadily increasing by 252% from 146 to 513 exajoules.  Meanwhile the GMT record from Hadcrut shows multiple ups and downs with an accumulated rise of 1.4C over 60 years, 10% of the starting value.

The graph below compares WFFC to GMT estimates from UAH6, and HadSST4 for the satellite era from 1980 to 2024 a period of 45 years.

In the satellite era WFFC has increased at a compounded rate of 1.5% per year, for a total increase of 99% since 1980. At the same time, SST warming amounted to 0.8C, or 5.6% of the starting value.  UAH warming was 1.1C, or 8% up from 1979.  The temperature compounded rate of change is 0.1% per year for HadSST4, and 0.2% per year for UAH, an order of magnitude less than WFFC.  Even more obvious is the 1998 El Nino peak and flat GMT until 2023-24.

Summary

The climate alarmist/activist claim is straight forward: Burning fossil fuels makes measured temperatures warmer. The Paris Accord further asserts that by reducing human use of fossil fuels, further warming can be prevented.  Those claims do not bear up under scrutiny.

It is enough for simple minds to see that two time series are both rising and to think that one must be causing the other. But both scientific and legal methods assert causation only when the two variables are both strongly and consistently aligned. The above shows a weak and inconsistent linkage between WFFC and GMT.

Going further back in history shows even weaker correlation between fossil fuels consumption and global temperature estimates:

Figure 5.1. Comparative dynamics of the World Fuel Consumption (WFC) and Global Surface Air Temperature Anomaly (ΔT), 1861-2000. The thin dashed line represents annual ΔT, the bold line—its 13-year smoothing, and the line constructed from rectangles—WFC (in millions of tons of nominal fuel) (Klyashtorin and Lyubushin, 2003). Source: Frolov et al. 2009

In legal terms, as long as there is another equally or more likely explanation for the set of facts, the claimed causation is unproven. The more likely explanation is that global temperatures vary due to oceanic and solar cycles. The proof is clearly and thoroughly set forward in the post Quantifying Natural Climate Change.

Footnote: CO2 Concentrations Compared to WFFC

Contrary to claims that rising atmospheric CO2 consists of fossil fuel emissions, consider the Mauna Loa CO2 observations in recent years.

Despite the drop in 2020 WFFC, atmospheric CO2 continued to rise steadily, demonstrating that natural sources and sinks drive the amount of CO2 in the air.

See also: Nature Erases Pulses of Human CO2 Emissions

02/2025 Update–Temperature Changes, CO2 Follows

UAH May 2026 Ocean Warms More Than Land

The post below updates the UAH record of air temperatures over land and ocean. Each month and year exposes again the growing disconnect between the real world and the Zero Carbon zealots. It is as though the anti-hydrocarbon band wagon hopes to drown out the data contradicting their justification for the Great Energy Transition.

From Science Matters

By Ron Clutz

The post below updates the UAH record of air temperatures over land and ocean. Each month and year exposes again the growing disconnect between the real world and the Zero Carbon zealots.  It is as though the anti-hydrocarbon band wagon hopes to drown out the data contradicting their justification for the Great Energy Transition.  Yes, there was warming from an El Nino buildup coincidental with North Atlantic warming, but no basis to blame it on CO2.

As an overview consider how recent rapid cooling  completely overcame the warming from the last 3 El Ninos (1998, 2010 and 2016).  The UAH record shows that the effects of the last one were gone as of April 2021, again in November 2021, and in February and June 2022  At year end 2022 and continuing into 2023 global temp anomaly matched or went lower than average since 1995, an ENSO neutral year. (UAH baseline is now 1991-2020). Then there was an usual El Nino warming spike of uncertain cause, unrelated to steadily rising CO2, and now dropping steadily back toward normal values.

For reference I added an overlay of CO2 annual concentrations as measured at Mauna Loa.  While temperatures fluctuated up and down ending flat, CO2 went up steadily by ~66 ppm, an 18% increase.

Furthermore, going back to previous warmings prior to the satellite record shows that the entire rise of 0.8C since 1947 is due to oceanic, not human activity.

gmt-warming-events

The animation is an update of a previous analysis from Dr. Murry Salby.  These graphs use Hadcrut4 and include the 2016 El Nino warming event.  The exhibit shows since 1947 GMT warmed by 0.8 C, from 13.9 to 14.7, as estimated by Hadcrut4.  This resulted from three natural warming events involving ocean cycles. The most recent rise 2013-16 lifted temperatures by 0.2C.  Previously the 1997-98 El Nino produced a plateau increase of 0.4C.  Before that, a rise from 1977-81 added 0.2C to start the warming since 1947.

Importantly, the theory of human-caused global warming asserts that increasing CO2 in the atmosphere changes the baseline and causes systemic warming in our climate.  On the contrary, all of the warming since 1947 was episodic, coming from three brief events associated with oceanic cycles. And in 2024 we saw an amazing episode with a temperature spike driven by ocean air warming in all regions, along with rising NH land temperatures, now dropping well below its peak.

Chris Schoeneveld has produced a similar graph to the animation above, with a temperature series combining HadCRUT4 and UAH6. H/T WUWT

See Also Worst Threat: Greenhouse Gas or Quiet Sun?

May 2026 UAH Temps: Ocean Warms More Than Land

With apologies to Paul Revere, this post is on the lookout for cooler weather with an eye on both the Land and the Sea.  While you heard a lot about 2020-21 temperatures matching 2016 as the highest ever, that spin ignores how fast the cooling set in.  The UAH data analyzed below shows that warming from the last El Nino had fully dissipated with chilly temperatures in all regions. After a warming blip in 2022, land and ocean temps dropped again with 2023 starting below the mean since 1995.  Spring and Summer 2023 saw a series of warmings, continuing into 2024 peaking in April, then cooling off to the present.

UAH has updated their TLT (temperatures in lower troposphere) dataset for May 2026. Due to one satellite drifting more than can be corrected, the dataset has been recalibrated and retitled as version 6.1 Graphs here contain this updated 6.1 data.  Posts on their reading of ocean air temps this month are ahead the update from HadSST4.  I posted recently on April 2026 SSTs Continue to Warm. These posts have a separate graph of land air temps because the comparisons and contrasts are interesting as we contemplate possible cooling in coming months and years.

Sometimes air temps over land diverge from ocean air changes. 2025 showed a sharp contrast between land and sea, first with ocean air temps falling in January recovering in February.  Then in November and December SH land temps spiked while ocean temps showed litle change. In February 2026 NH land temps doubled, from Dec. 0.53C up to 1.14C last month.  Despite SH land changing little, and Tropical land cooling, the Global land anomaly jumped up from 0.53 to 0.93C.  That reversed in March with both NH land and Global land anomaly back down to 0.63C. That cooling offset SH Ocean warming doubling from 0.19C to 0.38C. Now in May comes a warming spike in Tropics and SH ocean air while NH ocean air was flat. At the same time, Land air temps warmed in Tropics and NH while dropping in SH.  The unusual end result for May was Global, Land and Ocean air temp anomalies all showing the same 0.53C.

Note:  UAH has shifted their baseline from 1981-2010 to 1991-2020 beginning with January 2021.   v6.1 data was recalibrated also starting with 2021. In the charts below, the trends and fluctuations remain the same but the anomaly values changed with the baseline reference shift.

Presently sea surface temperatures (SST) are the best available indicator of heat content gained or lost from earth’s climate system.  Enthalpy is the thermodynamic term for total heat content in a system, and humidity differences in air parcels affect enthalpy.  Measuring water temperature directly avoids distorted impressions from air measurements.  In addition, ocean covers 71% of the planet surface and thus dominates surface temperature estimates.  Eventually we will likely have reliable means of recording water temperatures at depth.

Recently, Dr. Ole Humlum reported from his research that air temperatures lag 2-3 months behind changes in SST.  Thus cooling oceans portend cooling land air temperatures to follow.  He also observed that changes in CO2 atmospheric concentrations lag behind SST by 11-12 months.  This latter point is addressed in a previous post Who to Blame for Rising CO2?

After a change in priorities, updates are now exclusive to HadSST4.  For comparison we can also look at lower troposphere temperatures (TLT) from UAHv6.1 which are now posted for May 2026.  The temperature record is derived from microwave sounding units (MSU) on board satellites like the one pictured above. Recently there was a change in UAH processing of satellite drift corrections, including dropping one platform which can no longer be corrected. The graphs below are taken from the revised and current dataset.

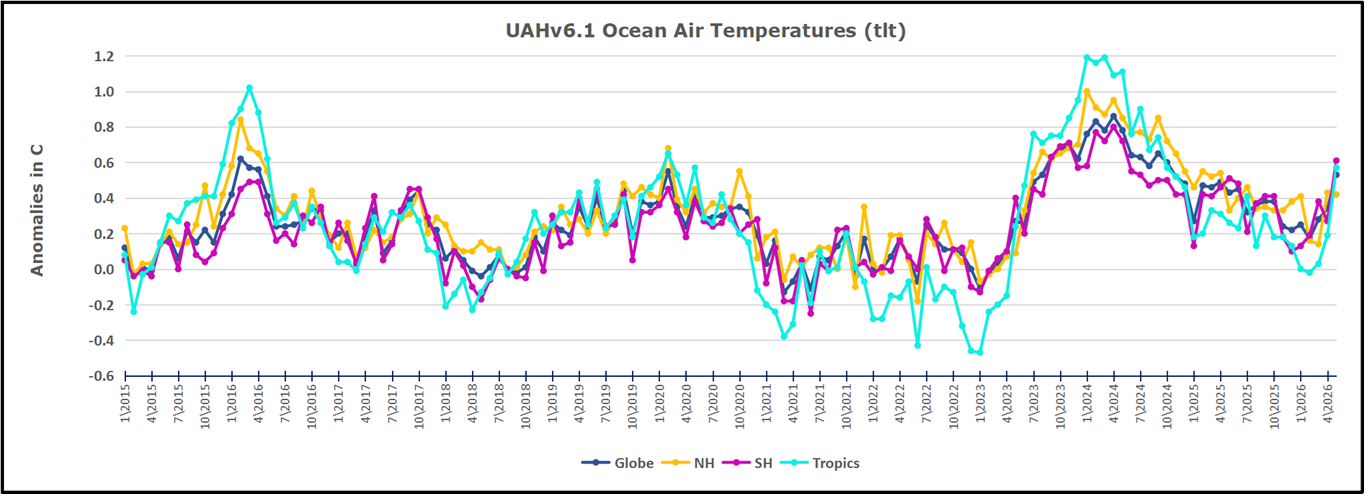
The UAH dataset includes temperature results for air above the oceans, and thus should be most comparable to the SSTs. There is the additional feature that ocean air temps avoid Urban Heat Islands (UHI).  The graph below shows monthly anomalies for ocean air temps since January 2015.

After sharp cooling everywhere in January 2023, there was a remarkable spiking of Tropical ocean temps from -0.5C up to + 1.2C in January 2024.  The rise was matched by other regions in 2024, such that the Global anomaly peaked at 0.86C in April. Since then all regions have cooled down sharply to a low of 0.27C in January.  In February 2025, SH rose from 0.1C to 0.4C pulling the Global ocean air anomaly up to 0.47C, where it stayed in March and April. In May drops in NH and Tropics pulled the air temps over oceans down despite an uptick in SH. At 0.43C, ocean air temps were similar to May 2020, albeit with higher SH anomalies. In November/December all regions were cooler, led by a sharp drop in SH bringing the Global ocean anomaly down to 0.02C. In 2026, ocean warming is evident, with Tropics and SH pulling up Global ocean air temps despite little rise in NH ocean.

Land Air Temperatures Tracking in Seesaw Pattern

We sometimes overlook that in climate temperature records, while the oceans are measured directly with SSTs, land temps are measured only indirectly.  The land temperature records at surface stations sample air temps at 2 meters above ground.  UAH gives tlt anomalies for air over land separately from ocean air temps.  The graph updated for May is below.

Here we have fresh evidence of the greater volatility of the Land temperatures, along with extraordinary departures by SH land.  The seesaw pattern in Land temps is similar to ocean temps 2021-22, except that SH is the outlier, hitting bottom in January 2023. Then exceptionally SH goes from -0.6C up to 1.4C in September 2023 and 1.8C in  August 2024, with a large drop in between.  In November, SH and the Tropics pulled the Global Land anomaly further down despite a bump in NH land temps. February showed a sharp drop in NH land air temps from 1.07C down to 0.56C, pulling the Global land anomaly downward from 0.9C to 0.6C. Some ups and downs followed with returns close to February values in August.  A remarkable spike in October was completely reversed in November/December, along with NH dropping sharply bringing the Global Land anomaly down to 0.52C, half of its peak value of 1.17C 09/2024. In 2026 January and February Global land rebounded up to 1.14C, led by a NH warming spike. That NH spike was reversed in March and April back down to 0.43C.  Now in May the Global land anomaly is back up to o.53C with all regions around that value.

The Bigger Picture UAH Global Since 1980

The chart shows monthly Global Land and Ocean anomalies starting 01/1980 to present.  The average monthly anomaly is -0.02 for this period of more than four decades.  The graph shows the 1998 El Nino after which the mean resumed, and again after the smaller 2010 event. The 2016 El Nino matched 1998 peak and in addition NH after effects lasted longer, followed by the NH warming 2019-20.   An upward bump in 2021 was reversed with temps having returned close to the mean as of 2/2022.  March and April brought warmer Global temps, later reversed

With the sharp drops in Nov., Dec. and January 2023 temps, there was no increase over 1980. Then in 2023 the buildup to the October/November peak exceeded the sharp April peak of the El Nino 1998 event. It also surpassed the February peak in 2016. In 2024 March and April took the Global anomaly to a new peak of 0.94C.  The cool down started with May dropping to 0.9C, later months declined steadily until  August Global Land and Ocean was down to 0.39C. then rose slightly to 0.53 in October, before dropping to 0.3C in December.  Now in May 2026 the anomaly is back up to 0.53C.

The graph reminds of another chart showing the abrupt ejection of humid air from Hunga Tonga eruption.

TLTs include mixing above the oceans and probably some influence from nearby more volatile land temps. Clearly NH and Global land temps have been dropping in a seesaw pattern, nearly 1C lower than the 2016 peak. Since the ocean has 1000 times the heat capacity as the atmosphere, that cooling is a significant driving force. TLT measures started the recent cooling later than SSTs from HadSST4, but are now showing the same pattern. Despite the three El Ninos, their warming had not persisted prior to 2023, and without them it would probably have cooled since 1995. Of course, the future has not yet been written.

UAH March 2026 SH Warmer Ocean Offset by NH Cooler Land

The post below updates the UAH record of air temperatures over land and ocean. Each month and year exposes again the growing disconnect between the real world and the Zero Carbon zealots. It is as though the anti-hydrocarbon band wagon hopes to drown out the data contradicting their justification for the Great Energy Transition. Yes, there was warming from an El Nino buildup coincidental with North Atlantic warming, but no basis to blame it on CO2.

From Science Matters

By Ron Clutz

The post below updates the UAH record of air temperatures over land and ocean. Each month and year exposes again the growing disconnect between the real world and the Zero Carbon zealots.  It is as though the anti-hydrocarbon band wagon hopes to drown out the data contradicting their justification for the Great Energy Transition.  Yes, there was warming from an El Nino buildup coincidental with North Atlantic warming, but no basis to blame it on CO2.

As an overview consider how recent rapid cooling  completely overcame the warming from the last 3 El Ninos (1998, 2010 and 2016).  The UAH record shows that the effects of the last one were gone as of April 2021, again in November 2021, and in February and June 2022  At year end 2022 and continuing into 2023 global temp anomaly matched or went lower than average since 1995, an ENSO neutral year. (UAH baseline is now 1991-2020). Then there was an usual El Nino warming spike of uncertain cause, unrelated to steadily rising CO2, and now dropping steadily back toward normal values.

For reference I added an overlay of CO2 annual concentrations as measured at Mauna Loa.  While temperatures fluctuated up and down ending flat, CO2 went up steadily by ~66 ppm, an 18% increase.

Furthermore, going back to previous warmings prior to the satellite record shows that the entire rise of 0.8C since 1947 is due to oceanic, not human activity.

gmt-warming-events

The animation is an update of a previous analysis from Dr. Murry Salby.  These graphs use Hadcrut4 and include the 2016 El Nino warming event.  The exhibit shows since 1947 GMT warmed by 0.8 C, from 13.9 to 14.7, as estimated by Hadcrut4.  This resulted from three natural warming events involving ocean cycles. The most recent rise 2013-16 lifted temperatures by 0.2C.  Previously the 1997-98 El Nino produced a plateau increase of 0.4C.  Before that, a rise from 1977-81 added 0.2C to start the warming since 1947.

Importantly, the theory of human-caused global warming asserts that increasing CO2 in the atmosphere changes the baseline and causes systemic warming in our climate.  On the contrary, all of the warming since 1947 was episodic, coming from three brief events associated with oceanic cycles. And in 2024 we saw an amazing episode with a temperature spike driven by ocean air warming in all regions, along with rising NH land temperatures, now dropping well below its peak.

Chris Schoeneveld has produced a similar graph to the animation above, with a temperature series combining HadCRUT4 and UAH6. H/T WUWT

See Also Worst Threat: Greenhouse Gas or Quiet Sun?

March 2026 UAH Temps: SH Ocean Warms, NH Land Cools

With apologies to Paul Revere, this post is on the lookout for cooler weather with an eye on both the Land and the Sea.  While you heard a lot about 2020-21 temperatures matching 2016 as the highest ever, that spin ignores how fast the cooling set in.  The UAH data analyzed below shows that warming from the last El Nino had fully dissipated with chilly temperatures in all regions. After a warming blip in 2022, land and ocean temps dropped again with 2023 starting below the mean since 1995.  Spring and Summer 2023 saw a series of warmings, continuing into 2024 peaking in April, then cooling off to the present.

UAH has updated their TLT (temperatures in lower troposphere) dataset for March 2026. Due to one satellite drifting more than can be corrected, the dataset has been recalibrated and retitled as version 6.1 Graphs here contain this updated 6.1 data.  Posts on their reading of ocean air temps this month are ahead the update from HadSST4.  I posted recently on February 2026 NH and Tropic SSTs Warm Slightly. These posts have a separate graph of land air temps because the comparisons and contrasts are interesting as we contemplate possible cooling in coming months and years.

Sometimes air temps over land diverge from ocean air changes. In July 2024 all oceans were unchanged except for Tropical warming, while all land regions rose slightly. In August we saw a warming leap in SH land, slight Land cooling elsewhere, a dip in Tropical Ocean temp and slightly elsewhere.  September showed a dramatic drop in SH land, overcome by a greater NH land increase. 2025 has shown a sharp contrast between land and sea, first with ocean air temps falling in January recovering in February.  Then in November and December SH land temps spiked while ocean temps showed litle change. In February 2026 NH land temps doubled, from Dec. 0.53C up to 1.14C last month.  Despite SH land changing little, and Tropical land cooling, the Global land anomaly jumped up from 0.53 to 0.93C.  That reversed in March with both NH land and Global land anomaly back down to 0.63C. That cooling offset SH Ocean warming doubling from 0.19C to 0.38C.

Note:  UAH has shifted their baseline from 1981-2010 to 1991-2020 beginning with January 2021.   v6.1 data was recalibrated also starting with 2021. In the charts below, the trends and fluctuations remain the same but the anomaly values changed with the baseline reference shift.

Presently sea surface temperatures (SST) are the best available indicator of heat content gained or lost from earth’s climate system.  Enthalpy is the thermodynamic term for total heat content in a system, and humidity differences in air parcels affect enthalpy.  Measuring water temperature directly avoids distorted impressions from air measurements.  In addition, ocean covers 71% of the planet surface and thus dominates surface temperature estimates.  Eventually we will likely have reliable means of recording water temperatures at depth.

Recently, Dr. Ole Humlum reported from his research that air temperatures lag 2-3 months behind changes in SST.  Thus cooling oceans portend cooling land air temperatures to follow.  He also observed that changes in CO2 atmospheric concentrations lag behind SST by 11-12 months.  This latter point is addressed in a previous post Who to Blame for Rising CO2?

After a change in priorities, updates are now exclusive to HadSST4.  For comparison we can also look at lower troposphere temperatures (TLT) from UAHv6.1 which are now posted for March 2026.  The temperature record is derived from microwave sounding units (MSU) on board satellites like the one pictured above. Recently there was a change in UAH processing of satellite drift corrections, including dropping one platform which can no longer be corrected. The graphs below are taken from the revised and current dataset.

The UAH dataset includes temperature results for air above the oceans, and thus should be most comparable to the SSTs. There is the additional feature that ocean air temps avoid Urban Heat Islands (UHI). The graph below shows monthly anomalies for ocean air temps since January 2015.

After sharp cooling everywhere in January 2023, there was a remarkable spiking of Tropical ocean temps from -0.5C up to + 1.2C in January 2024.  The rise was matched by other regions in 2024, such that the Global anomaly peaked at 0.86C in April. Since then all regions have cooled down sharply to a low of 0.27C in January.  In February 2025, SH rose from 0.1C to 0.4C pulling the Global ocean air anomaly up to 0.47C, where it stayed in March and April. In May drops in NH and Tropics pulled the air temps over oceans down despite an uptick in SH. At 0.43C, ocean air temps were similar to May 2020, albeit with higher SH anomalies. In November/December all regions were cooler, led by a sharp drop in SH bringing the Global ocean anomaly down to 0.02C. January and February saw continued Tropical cooling and NH cooling as well pulling Global ocean air temps lower. Now in March 2026 SH ocean warmed pulling up the Global ocean air anomaly.

Land Air Temperatures Tracking in Seesaw Pattern

We sometimes overlook that in climate temperature records, while the oceans are measured directly with SSTs, land temps are measured only indirectly.  The land temperature records at surface stations sample air temps at 2 meters above ground.  UAH gives tlt anomalies for air over land separately from ocean air temps.  The graph updated for March is below.

Here we have fresh evidence of the greater volatility of the Land temperatures, along with extraordinary departures by SH land.  The seesaw pattern in Land temps is similar to ocean temps 2021-22, except that SH is the outlier, hitting bottom in January 2023. Then exceptionally SH goes from -0.6C up to 1.4C in September 2023 and 1.8C in  August 2024, with a large drop in between.  In November, SH and the Tropics pulled the Global Land anomaly further down despite a bump in NH land temps. February showed a sharp drop in NH land air temps from 1.07C down to 0.56C, pulling the Global land anomaly downward from 0.9C to 0.6C. Some ups and downs followed with returns close to February values in August.  A remarkable spike in October was completely reversed in November/December, along with NH dropping sharply bringing the Global Land anomaly down to 0.52C, half of its peak value of 1.17C 09/2024. In January and February Global land rebounded up to 1.14C, led by a NH warming spike. That was reversed in March back down to 0.63C despits some SH land warming.

The Bigger Picture UAH Global Since 1980

The chart shows monthly Global Land and Ocean anomalies starting 01/1980 to present.  The average monthly anomaly is -0.02 for this period of more than four decades.  The graph shows the 1998 El Nino after which the mean resumed, and again after the smaller 2010 event. The 2016 El Nino matched 1998 peak and in addition NH after effects lasted longer, followed by the NH warming 2019-20.   An upward bump in 2021 was reversed with temps having returned close to the mean as of 2/2022.  March and April brought warmer Global temps, later reversed

With the sharp drops in Nov., Dec. and January 2023 temps, there was no increase over 1980. Then in 2023 the buildup to the October/November peak exceeded the sharp April peak of the El Nino 1998 event. It also surpassed the February peak in 2016. In 2024 March and April took the Global anomaly to a new peak of 0.94C.  The cool down started with May dropping to 0.9C, later months declined steadily until  August Global Land and Ocean was down to 0.39C. then rose slightly to 0.53 in October, before dropping to 0.3C in December, and slightly higher now in February and March 2026.

The graph reminds of another chart showing the abrupt ejection of humid air from Hunga Tonga eruption.

TLTs include mixing above the oceans and probably some influence from nearby more volatile land temps. Clearly NH and Global land temps have been dropping in a seesaw pattern, nearly 1C lower than the 2016 peak. Since the ocean has 1000 times the heat capacity as the atmosphere, that cooling is a significant driving force. TLT measures started the recent cooling later than SSTs from HadSST4, but are now showing the same pattern. Despite the three El Ninos, their warming had not persisted prior to 2023, and without them it would probably have cooled since 1995. Of course, the future has not yet been written.

HadCRUT Has Now Fully Removed 0.15°C From The 1940s Warmth ‘Blip’ As Proposed In 2009 E-mails

The amplitude of the recorded warmth in the 1940s was always a problem for purveyors of the human-caused global warming narrative. So the 1940s temperatures have been artificially cooled to make this less of a problem.

Road Sign – Oops!

From NoTricksZone

By Kenneth Richard 

The amplitude of the recorded warmth in the 1940s was always a problem for purveyors of the human-caused global warming narrative. So the 1940s temperatures have been artificially cooled to make this less of a problem.

In 2009, overseers of the HadCRUT global temperature data discussed “correcting” the “1940s warming blip” in e-mails that they later tried to hide from Freedom Of Information Act (FOIA) investigators.

“So, if we could reduce the ocean blip by, say, 0.15 degC, then this would be significant for the global mean — but we’d still have to explain the land blip.”

“I’ve chosen 0.15 here deliberately.”

“It would be good to remove at least part of the 1940s blip, but we are still left with ‘why the blip?’.”

Image Source: Climate Gate E-mails (FOIA)

And, just as they had said they would do, 0.15°C of warmth has gradually been removed from the 1940s HadCRUT global temperature data over the last 15 years. They have “corrected” the data to align with their narrative.

Image Source: climate4you.com

What’s also noticeable here in this HadCRUT-changes-temperature-data chart provided by climate4you is just how much warmth has been added to 21st century temperatures since 2008.

The HadCRUT3 global temperature trend was recorded as 0.03°C per decade during the global warming hiatus years of 2000-2014 (Scafetta, 2022).

This was increased to 0.08°C per decade by version 4, as the overseers of the HadCRUT data conveniently added 0.1°C to 0.2°C to the more recent anomalies.

Today, in HadCRUT5, the 2000-2014 temperature trend has been adjusted up to 0.14°C per decade when using the computer model-infilling method.

So, within the last decade, a 15-year temperature trend has been changed from a pause to a strong warming. After all, when the observations don’t fit the narrative, it is time to change the observations.

Image Source: Scafetta, 2022

Earth’s Mean Annual Temperature Was Warmer 31,000 Years Ago…The North Pole 22°C Warmer

In sum, none of these studies support the conclusion that CO2 concentrations are a driver of surface temperatures. Earth’s mean annual temperatures have been much warmer (or colder) than today, regardless of the CO2 concentration.

From NoTricksZone

By Kenneth Richard on 17. April 2023

Earth’s average annual temperature fluctuated by as much as 35°C (at high latitudes) from one millennial-scale period to the next during the last glacial period.

A recently-published 2-part study (Smul′skii, 2022a and 2022b) utilizes established orbital and insolation data to calculate Earth’s average temperature today (0 k years ago), 14.4°C, and at 25°N, 45°N, 65°N, 80°N, 0°, -25°S, -45°S, -65°S, and -80°S during 3 paleo epochs: 15.9 k years ago, 31.3 k years ago, and 46.4 k years ago.

Global annual temperature of Earth: 14.4°C – the same as a century ago

Consistent with dozens of other calculations, Smul′skii (2022a) determined the mean annual temperature of the modern period, which includes 1991-2018, ranges between 14.07 and 14.41°C.

This calculation is similar to what Jones et al. determined as Earth’s temperature in a 1999 study: 14.0°C.

Image Source: Jones et al., 1999

Kramm et al., (2020) reported the generally agreed-upon global temperature from 1877 to 1913 from dozens of calculated results was also about 14.4°C.

HadCRUT, Berkley, and NASA GISS indicate the 1991-2018 period’s global annual surface temperature has also been 14.5°C. Thus, as these geoscientists conclude, there  has been “no change in the globally averaged near-surface temperature over the past 100 years”.

Image Source: Kramm et al., 2020

The global annual temperature was warmer than today during the last glacial period

Even though atmospheric CO2 concentrations were said to be about 200 ppm 31.3 k years ago, or during the last glacial, Earth was significantly warmer than it is today – especially at the higher latitudes.

At 65°N, for example, the mean annual temperatures were 0.66°C 31.3 k years ago, but -5.6°C today. In other words, it was 6.3°C warmer during the last glacial at this latitude.

At 90°N, mean annual temperatures were -2.65°C 31.3 k years ago, but -25.3°C today. The modern North Pole is thus ~22°C colder than it was during the “Karginsky Interglacial” (31.3 k years ago). At 90°S, mean annual temperatures were ~27°C warmer than today (-31.1°C vs. -4.1°C) 31.3 k years ago.

Image Source: Smul’skii, 2022b

Averaged over the entire Earth, the mean annual temperature was 0.4°C warmer than modern (14.8°C) 31.3 k years ago, and -0.4°C colder than modern (14.0°C) 46.4 k years ago, or during the coldest period in the last 200,000 years.

Mean annual temperature swings ranging from -3.4°C at 80°N 111.8 k years ago to -40.9°C at 80°N 46.4 k years ago suggest millennial-scale climate variations as high as 35°C occur naturally in the Earth’s climate system.

Other paleoclimate studies also document a warm period 31.3 k years ago

These global to regional temperature variations are consistent with independent paleoclimate research. For example, about 31.3 k years ago (“31,436 – 31,178 cal BP”) temperatures in the Russian Altai mountains (49°N) were thought to be 5.9°C warmer than today (Ganyushkin et al., 2018) given the presence of tree remains at much higher altitudes (500 m) than the modern tree line dating to that period.

Image Source: Ganyushkin et al., 2018

Scientists document a Siberian Arctic with “warmer-than-today temperatures (by up to 4 – 4.5°C)…between about 39 and 31 cal kyr BP” (Wetterich et al., 2021).

Image Source: Wetterich et al., 2021

There were ~5°C warmer glacial climates (July) than today throughout Northern Asia during the millennia between 50 k and 20 k years ago (Tarasov et al., 2021).

“…reconstructed mean July temperatures above 12°C for most of the last cold stage [glacial] in the study area [throughout Northern Asia], where modern mean July temperatures are about 7°C”.

The widespread presence of grazing mammoths, horses, bison, deer, antelope, gazelle…in Siberia and Alaska and well north of the Arctic circle imply “year-round grazing grounds.” This requires warmer temperatures and more pervasive ice-free grass-grazing ranges than exist today.

Image Source: Tarasov et al., 2021

In the North Pacific ~35 k to 18 k years ago temperatures ranged between 10 and 16°C versus 9.1°C today (Max et al., 2020).

Image Source: Max et al., 2020

In southern California temperatures reached 22-23°C 31 k to 24 k years ago, whereas they are only 18°C today (Feakins et al., 2019).

Image Source: Feakins et al., 2019

In the Southern Hemisphere, the Southern Ocean’s surface temperatures peaked at 13.6°C about 22 k years ago. From 35 to 30 k years ago temperatures ranged from 12-13°C versus 8.5°C today (3.5 to 4.5°C warmer). There were “higher SST during the 40-24 kyrs period than during the Holocene” (Civel-Mazens et al., 2021).

Image Source: Civel-Mazens et al., 2021

It was 2-5°C warmer than today in the South Atlantic from about 65 k to 30 k years ago, “prompting us to exclude atmospheric pCO2 as a direct driver of SST variations in the southern WTA [Western Tropical Atlantic]”  (Hou et al., 2020).

Image Source: Hou et al., 2020

In sum, none of these studies support the conclusion that CO2 concentrations are a driver of surface temperatures. Earth’s mean annual temperatures have been much warmer (or colder) than today, regardless of the CO2 concentration.