Wrong, Reno Gazette Journal, a Flawed Climate Study Doesnโ€™t Prove Future Desertification for Reno

The Reno Gazette Journal (RGJ) reports in โ€œClimate models project Reno-Sparks could be a desert by late century,โ€ that climate change is poised to dramatically reshape the worldโ€™s ecosystems, with forests giving way to savannas, deserts, and other major vegetation shifts occurring by the end of the century. This is false.

From ClimateRealism

By Anthony Watts

The Reno Gazette Journal (RGJ) reports in โ€œClimate models project Reno-Sparks could be a desert by late century,โ€ that climate change is poised to dramatically reshape the worldโ€™s ecosystems, with forests giving way to savannas, deserts, and other major vegetation shifts occurring by the end of the century. This is false. The study does not observe ecosystem changes occurring today, but instead projects hypothetical future vegetation changes using climate models that rely on the now-discredited and retracted RCP 8.5 worst-case emissions scenario, making the scientific study used to write the RGJ newspaper article invalid.

Readers would never know it from RGJโ€™s coverage that the scientific model used to generate the studyโ€™s alarming findings was pronounced as implausible by the Intergovernmental Panel on Climate Change (IPCC) in April. Yet the information about that climate model retraction is easy to understand and readily available if they bothered to look.

Figure. The climate model known as RCP8.5, long promoted as the โ€˜business-as-usualโ€™ climate scenario, has been officially declared implausible by the international committee responsible for the Intergovernmental Panel on Climate Change (IPCC) climate scenarios. The new highest scenario projects end-of-century warming approximately 1.4 degrees Celsius lower than RCP8.5, a fundamental reduction in the projected upper bound of climate risk. Graphic by Anthony Watts.

The RGJ article discusses recent research published in PeerJ as though scientists have determined what Earthโ€™s landscapes will look like decades from now, rather than having speculated about possible changes based on withdrawn climate modelโ€™s output. In reality, the researchers modeled where future climate conditions might become suitable for different vegetation types under several greenhouse gas emissions scenarios. Those projections are only as reliable as the assumptions built into the climate models that drive them.

One of those assumptions is perhaps the biggest flaw in both the study and RGJโ€™s reporting of it.

The researchers based their projections on three emissions scenarios from the older CMIP5 generation of climate models, including RCP 8.5. The problem is that RCP 8.5 was never intended to represent the most likely future. It was developed as a high-end, worst-case scenario to explore what might happen if global emissions continued rising rapidly through massive coal expansion and little technological progress. That emissions scenario was impossible.

Yet RGJ never tells readers that the studyโ€™s most dramatic projections depends on a retracted scenario that never, in reality, reflected the worldโ€™s actual greenhouse gas emissions trajectory.

The study authors explain that they deliberately chose to use the older and now retracted CMIP5 climate models because many of the newer CMIP6 models produced warming responses that appeared unrealistically sensitive to greenhouse gases. That admission should remind readers that climate modeling remains a sometimes arbitrary and unproven science. If researchers are still debating which climate models produce realistic results, it is difficult to justify presenting century-scale vegetation projections as settled science. It renders the outcome as no better than a coin-flip.

Another important point largely missing from RGJโ€™s coverage is that the study does not predict forests will disappear.

Instead, the researchers model what they call potential vegetation. In other words, they estimate the types of ecosystems that climate conditions alone might support in the future. That is a very different exercise from predicting what will happen in the real world.

Real forests, as opposed to those in climate models, respond to far more than temperature, rainfall, or greenhouse gas concentrations. Soil conditions, wildfire, insects, disease, human land management, ecological succession, and the ability of species to adapt all influence how ecosystems change over time. These difficult to model or predict factors are routinely excluded from climate models.

The authors openly acknowledge these limitations. They state that their model does not include vegetation-climate feedbacks, snowfall effects, ecological succession, or the influence of rising atmospheric carbon dioxide on plant growth. They also acknowledge that their statistical model is imperfect and explicitly state that they โ€œacknowledge our inability to predict the futureโ€ with certainty.

One glaring omission deserves particular attention.

The study excludes the well-established COโ‚‚ fertilization effect, even though decades of research have shown that increasing atmospheric carbon dioxide generally promotes plant growth and improves water-use efficiency for many species. In fact, deserts have been shrinking as increased atmospheric carbon dioxide helps plants become more resilient. The authors concede that excluding this process could lead them to overestimate biome changes, particularly in tropical regions, and they note that recent IPCC assessments have identified evidence of increasing woody vegetation associated with higher COโ‚‚ concentrations.

According to the researchers, more than 99 percent of Earthโ€™s land surface will remain within the same broad biome classification the are currently within under their projections for the future, with significant changes confined to relatively limited areas. That important context is also largely absent from RGJโ€™s article.

As a result, perhaps the greatest irony of RGJโ€™s headline is that is it far more dramatic and alarming than the results reported with confidence in the study it is touting.

The failure here extends beyond the RGJ article. It is also a failure of the peer-review process. PeerJ reviewers should have asked why researchers were still relying on RCP 8.5 to produce some of their most alarming projections when the IPCC admitted that the scenario never reflected possible emissions trends. Instead, the paper passed peer review with little apparent scrutiny of one of its most fundamental assumptions, an assumption that has been acknowledged to be false.

Likewise, the RGJ failed to ask the obvious question that any competent science reporter should have asked: Are these projections based on realistic assumptions? Instead, it accepted the studyโ€™s conclusions at face value and presented speculative model output as though it reflected an accurate forecast of Renoโ€™s future.

In addition, if RGJ had done a little independent fact checking, its reporters would have noticed that Renoโ€™s long-term climatic temperature trend is based on one highly biased weather station located in the middle of Reno International Airport. A recent experiment conducted at the airport proved that station reads abnormally warm, reducing Renoโ€™s chances of becoming a desert in the future.

Good science depends on testing assumptions against reality. Good journalism depends on questioning scientific claims before presenting them to the public as proven. In this case, both the PeerJ journal and the Reno Gazette Journal failed their respective tests of quality. In both cases, readers were misled. Bad science bred bad journalism.

New Study: Antarctic Ice Sheet Melt Will Lead To Widespread Cooling, Sea Ice Expansion

Scientists have counter-intuitively determined that a melting Antarctic ice sheet serves to mitigate global warming.

From NoTrickZone

Byย Kenneth Richardย 

Scientists have counter-intuitively determined that a melting Antarctic ice sheet serves to mitigate global warming.

The anticipated accelerated melting of the Antarctic ice sheet (AIS) will mean massive amounts of freshwater will enter the Southern Ocean (SO) over the next one hundred years.

According to a new studyโ€˜s panoply of SOFIA (Southern Ocean Freshwater Input from Antarctica) models, a melting AIS will, in turn, cool the SO and Antarctica (the latter by 1ยฐC or more) as well as lead to further expansion of the Southern Hemisphereโ€™s sea ice.

More specifically, as a consequence of future Antarctic ice sheet melt, over the next century the entire 40-70ยฐS region will cool ~0.7ยฐC and sea ice will expand by approximately 2 million kmยฒ (per Figure S1 from the study). The lead author already published a 2022 paper documenting โ€œthe Southern Ocean (50ยฐSโ€“70ยฐS) sea surface temperature has a significant and robust cooling trend during 1982โ€“2020,โ€ so the cooling trend has been ongoing for over 40 years already.

The authors of the present study maintain the โ€œresponse to an increased Antarctic sea ice extent and ocean surface cooling results in global atmospheric impacts,โ€ not just local or regional ones. Specifically, the effect of SO cooling includes a (a) reduction in the global warming rate, (b) troposphere-wide cooling, (c) Eastern tropical Pacific cooling, (d) a delay in the anticipated weakening of the AMOC, (e) a northward shift of the ICTZ (Inner-Tropical Convergence Zone), and (f) a โ€œweakening of the jet stream on its equatorward flank in both hemispheres.โ€

In other words, the key to reducing the global warming โ€œproblemโ€ and its presumed side effects may be to cheer on (or hope for) an accelerated AIS melting over the next century.

โ€œSince most of these responses act opposingly to global warming mechanisms diagnosed from model experiments lacking Antarctic freshwater, our results support the notion of a potential delay of anthropogenic climate change through SO [Southern Ocean] processes.โ€

Image Source:ย Xu et al., 2025

For those who say a future accelerated Antarctic ice sheet melt will lead to concerning sea level rise, scientists contend this โ€œproblemโ€ may be self-correcting as well.

According to the IPCC and climate models, if Antarctica were to ever warm (and it has not warmed in the last 70 years), this warmth would add more precipitation and thus ice mass to the Antarctic ice sheet (IPCC AR4, Krinner et al., 2007, Palerme et al., 2017). The warming-induced ice mass expansion contributes to a reduction in Antarcticaโ€™s contribution to sea level rise by 2100. Specifically, a warming Antarctica reduces sea level rise by -1.2 mm/yr.

So a warming Antarctica leads to ice mass gains and a reduction in sea level rise, and a melting ice sheet leads to widespread cooling and sea ice expansion. Either way, the alarmist narrative loses.

Image Source:ย IPCC AR4
Image Source:ย Krinner et al., 2007
Image Source:ย Palerme et al., 2017

Do CMIP5 models skillfully match actual warming?

The CLINTEL Declaration states that the world has warmed โ€œsignificantly less than predicted by (the) IPCCโ€. Yet, a simple check of the models versus observed warming demonstrates that โ€œclimate models published since 1973 have generally been quite skillful predicting future warmingโ€, as Zeke Hausfatherโ€™s team at Berkeley Earth recently analysed.

From Climate Etc.

by Nic Lewis

Why matching of CMIP5 model-simulated to observed warming does not indicate model skill

A well-known Dutch journalist, Maarten Keulemans ofย De Volkskrant, recentlyย tweetedย an open letter to the Nobel-prizewinning physicist Professor Clauser in response to his signing of theย Clintel World Climate Declarationย that โ€œThere is no climate emergencyโ€, asking for his response to various questions. One of these was:

The CLINTEL Declaration states that the world has warmed โ€œsignificantly less than predicted by (the) IPCCโ€. Yet, a simple check of the models versus observed warming demonstrates that โ€œclimate models published since 1973 have generally been quite skillful predicting future warmingโ€, as Zeke Hausfatherโ€™s team at Berkeley Earth recently analysed.

The most recent such analysis appears to be that shown for CMIP5 models in aย tweetย by Zeke Hausfather, reproduced in Figure 1. While the agreement between modeled and observed global mean surface temperature (GMST) warming over 1970โ€“2020 shown in the Figure 1 looks impressive, it is perhaps unsurprising given that modelers knew when developing and tuning their models what the observed warming had been over most of this period.

Figure 1. Zeke Hausfatherโ€™s comparison of global surface temperature warming in CMIP5 climate models with observational records. Simulations based on the intermediate mitigation RCP4.5 scenario of global human influence on ERF through emissions of greenhouse gases, etc. were used to extend the CMIP5 Historical simulations beyond 2005.

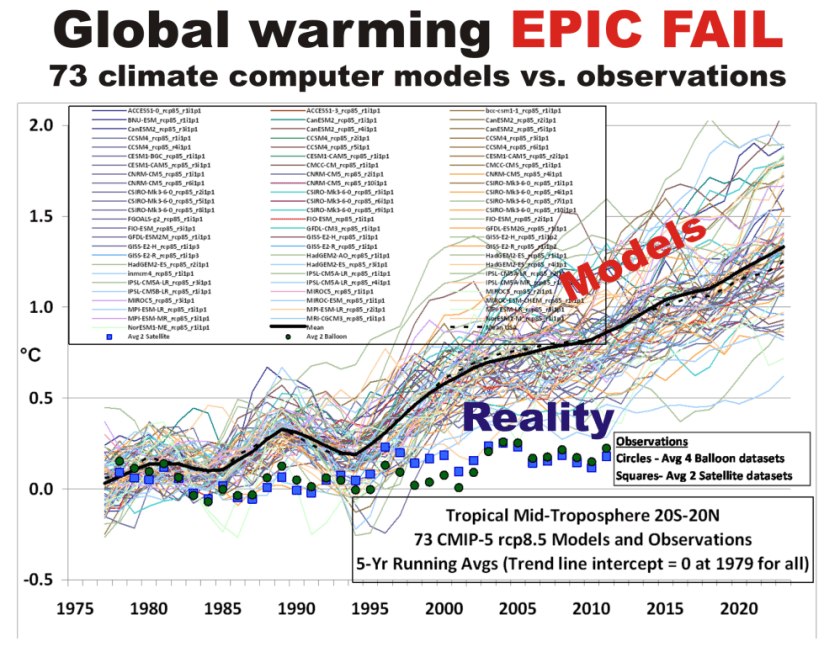
It is well-known that climate models have a higher climate sensitivity than observations indicate. Figure 2 compares equilibrium climate sensitivity (ECS) diagnosed in CMIP5 models and in the latest generation, CMIP6, models with the corresponding observational estimate on the same basis inย Lewis (2022)ย of 2.16ยฐC and (likely range 1.75โ€“2.7ยฐC). Only one model has an ECS below the estimate in Lewis (2022), and most models have ECS values exceeding the upper bound of its likely range. CMIP6 models are generally even more sensitive than CMIP5 models, with half of them having ECS values above the top of the 2.5โ€“4ยฐC likely range given in the IPCCโ€™s 2021 Sixth Assessment Report: The Physical Science Basis (AR6 WG1).

Figure 2.ย  Red bars: equilibrium climate sensitivity in CMIP5 and CMIP6 models perย Zelinka et al. (2020)ย Tables S1 & S2 estimated by the standard method (ordinary least squares regression over years 1โ€“150 of abrupt4xCO2 simulations). Blue line and blue shaded band: best estimate and likely (17%-83% probability) range for ECS in Lewis (2022), derived from observational evidence over the ~150 year historical period but adjusted to correspond to that estimated using the aforementioned standard methodย  for models.

So, how is it possible that Hausfather gets an apparently good match between models and observations in the period 1970-2020? Does it imply that the models correctly represent the effects of changes in โ€œclimate forcersโ€, such as the atmospheric concentration of greenhouse gases and aerosols, on GMST, and accordingly that their climate sensitivities are correct?

The key question is this. Matching by CMIP5 climate models, in aggregate, with observed GMST changes would only be evidence that models correctly represent the effects of changes in โ€œclimate forcersโ€, such as the atmospheric concentration of greenhouse gases and aerosols, on GMST if resulting changes in their combined strength in models matched best estimates of the actual changes in those forcers. The standard measure of strength of changes in climate forcers, in terms of their effect on GMST, is their โ€œeffective radiative forcingโ€ (ERF), which measures the effect on global radiative flux at the top of the Earthโ€™s atmosphere once it and the land surface have adjusted to the changes in climate forcers (see IPCC AR6 WG1 Chapter 7, section 7.3)

It is therefore important to compare changes in total ERF as diagnosed in CMIP5 models during their Historical and RCP4.5 scenario simulations over 1970โ€“2020 with the current best estimates of their actual changes, which I will take to be those per IPCC AR6 WG1 Annex III, extended from 2019 to 2020 using the almost identical Climate Indicator Project ERF time series.

Historical and RCP4.5 ERF (referred to as โ€œadjusted forcingโ€) in CMIP5 models was diagnosed in Forster at al. (2013), for the 20 models with the necessary data. I take the mean ERF for that ensemble of models[1] as representing the ERF in the CMIP5 models used in Figure 1.

Figure 3 compares the foregoing estimates of mean ERF in CMIP5 models with the best estimates given in IPCC AR6. Between the early 1980s and the late 2000s CMIP5 and AR6 ERF estimates agreed quite closely, but they diverged both before and (particularly) after that period. The main reason for their divergence since 2007 appears to be that aerosol ERF, which is negative, is now estimated to have become much smaller over that period than was projected under the RCP4.5 scenario. Updated estimates of aerosol ERF also appears likely to account for about half of their lesser divergence prior to 1983, with the remainder mainly attributable to differences in ERF changes for land use and various other forcing agents.

Figure 3. Effective radiative forcing (ERF) over 1970โ€“2020 as estimated in CMIP5 models (mean across 19 models) and the best estimate given in the IPCC Sixth Assessment Scientific Report (AR6 WG1). The ERF values are relative to their 1860โ€“79 means.

The IPCC AR6 best estimate of the actual  ERF change between 1970 and 2020 is 2.53 Wmโˆ’2. The linear trend change over 1970โ€“2020 given by ordinary least squares regression is 2.66 Wmโˆ’2, while the change between the means of the first and last decades in the period, scaled to the full 50 year period, is 2.59 Wmโˆ’2.

By comparison, the mean ERF change for CMIP5 models between 1970 and 2020 is 1.67 Wmโˆ’2. The linear trend change over 1970โ€“2020 is 1.92 Wmโˆ’2, and the scaled change between the first to last decadesโ€™ means is 1.76 Wmโˆ’2.

It is evident that the AR6 estimate of the actual 1970โ€“2020 ERF change is far greater than that in CMIP5 models. Based on the single years 1970 and 2020, the AR6-to-CMIP5 model ERF change ratio is 1.51. Based on linear trends that ratio is 1.39, while based on first and last decadesโ€™ means it is 1.46. The last of these measures is arguably the most reliable, since single year ERF estimates may be somewhat unrepresentative, and due to intermittent volcanism the ERF has large deviations from a linear relationship to time. As there is some uncertainty I will take the ratio as being in the range 1.4 to 1.5.

So, CMIP5 models matched the observed 1970โ€“2020 warming trend, but the estimated actual change in ERF was 1.4 to 1.5 times greater than that in CMIP5 models. On the assumption that both the CMIP5 model ERF estimates and the IPCC AR6 best estimates of ERFs are accurate, it follows that:

  • CMIP5 models are on average 1.4 to 1.5 times as sensitive as the real climate system was to greenhouse gas and other forcings over 1970โ€“2020[2]; and
  • CMIP5 models would have over-warmed by 40โ€“50% if their ERF change over that period had  been in line with reality.

It seems clear that the ERF change in CMIP5 models over 1970โ€“2020 was substantially less than the IPCC AR6 best estimate, and that CMIP5 models substantially overestimated the sensitivity of the climate system during that period to changes in ERF. Moreover, the divergence is increasing: the ratio of AR6 to CMIP5 model ERF changes is slightly higher if the comparison is extended to 2022.

In conclusion, Maarten Keulemansโ€™ claim that โ€œa simple check of the models versus observed warming demonstrates that โ€œclimate models published since 1973 have generally been quite skillful predicting future warmingโ€ is false.

Contrary to the impression given by Zeke Hausfatherโ€™s rather misleading graph, CMIP5 models have not been at all skillful in predicting future warming; they have matched the illustrated 1970โ€“2020 observed warming (which was past rather than future warming until the late 2000s, when CMIP5 models were still being tuned) due to their over-sensitivity being cancelled out by their use of ERF that increased much less than the IPCCโ€™s latest best estimates of the actual ERF increase.

Nic Lewis               5 September 2023


[1] ex FGOALS-s2, the Historical and RCP simulations of which were subsequently withdrawn from the CMIP5 archive.

[2] There are some caveats to the conclusion that CMIP5 models were oversensitive by a factor of 1.4 to 1.5 times:

  • the ensemble of CMIP5 models used in Forster et al. (2013) might not have been a representative subset of the entire set of CMIP5 model. However, there appears to be little or no evidence suggesting that is the case;
  • despite their careful compilation, the AR6 best estimates of the evolution of ERF might be inaccurate;
  • the CMIP5 model forcings derived by Forster et al. (2013) might be inaccurate. There are reasons to suspect that their method might produce ERF estimates that are up to about 10% lower than the methods used for IPCC AR6. However, Forster et al. present some evidence in favour of the accuracy of their method. Moreover, the agreement in Figure 2 between the CMIP5 and AR6 ERF time series between 1983 and 2007 (with divergences before and after then largely attributed to differences in particular forcing agents) is further evidence suggesting that the Forster et al. (2013) CMIP5 ERF estimates are fairly accurate; and
  • due to the heat capacity of the ocean mixed layer, GMST is more closely related to average ERF exponentially-decayed over a few years rather than to ERF in the same year. Using exponentially-decayed ERFs would somewhat reduce the 1.4 low end estimate given above for the ratio of AR6 to CMIP5 model ERF 1970โ€“2020 increase estimates, perhaps by ~10%.