The Great Lakes Aren’t Suffering from Climate Change, Milwaukee Journal Sentinel

A recent article by the Milwaukee Journal Sentinel (MJS) titled “Extreme heat. Warmer water. More ticks. Fewer fish. Climate change report brings grim news,” claims that the Great Lakes region is suffering from climate change, especially in the realm of extreme heat and unstable lake water levels. This is false. Heat is not becoming more extreme in the Midwest, nor are the Great Lakes’ levels unusual.

Waves crashing on a shoreline with a cloudy sky above, featuring a wooden jetty along the beach.

From ClimateRealism

By Linnea Lueken

A recent article by the Milwaukee Journal Sentinel (MJS) titled “Extreme heat. Warmer water. More ticks. Fewer fish. Climate change report brings grim news,” claims that the Great Lakes region is suffering from climate change, especially in the realm of extreme heat and unstable lake water levels. This is false. Heat is not becoming more extreme in the Midwest, nor are the Great Lakes’ levels unusual.

The MJS references a climate change report written by the Environmental Law and Policy Center (ELPC), which the paper says, “brings grim news.” The ELPC is a renewables-promotion organization, that stands against nuclear, coal, and gas, in favor of wind and solar.

The MJS lists several areas of “grim news,” but for the sake of brevity this Climate Realism post will address just a few of them.

The writer of MJS’s story begins her story by saying that people used to consider the Great Lakes region a “climate haven,” protected from extreme weather. This is obvious nonsense. Thousands of people, seasonal snowbirds included, leave that area for sunny places like Florida and Arizona every winter. The region is famous for its “Lake effect,” blizzards and storms. No place is a climate haven. A previous Climate Realism post debunked the same claim made about Asheville, NC, in the aftermath of devastating hurricane-related floods there in 2024. Extreme weather happens everywhere at some time or another, choosing the Midwest, you get hot summers prone to extreme thunderstorms and tornadoes, and winters with severe snow.

The MJS goes on to say that average temperatures have increased in the Midwest since the 1900s, which is true. However, the MJS misses the fact that this trend is not driven by an increase in very hot days. The MJS claims this is the case, saying “dangerously hot days are happening more often,” but this statement is false. Data from the National Oceanic and Atmospheric Administration shows a decline in the number of days experiencing “very hot” conditions since the early part of the 20th century. That goes for Wisconsin, Illinois, Michigan, Ohio, Indiana, and Iowa. (Figure 1 demonstrating this for Wisconsin, for example)

A graph displaying climate data for Wisconsin, showing fluctuations in temperature over time, with orange bars representing a specific metric and black lines indicating trends.
Figure 1: Annual number of “days with a maximum temperature of 95°F or higher. Orange bars are showing averages over 5-year periods, with the last bar a 6-year average. Dots are yearly values, and the horizontal line shows the long-term average. Chart from Frankson, R., K.E. Kunkel, S.M. Champion, and L. Sun, 2022: Wisconsin State Climate Summary 2022.

What is happening is there has been a decline in the number of “very cold” days, or days with maximum temperatures of 0°F or lower.

Additionally, nighttime temperatures are trending upwards on average, which the study and MJS admit but misunderstand and ignore the importance of this fact. MJS says higher temperatures both day and night occur “especially in urban heat islands where surfaces like parking lots, sidewalks and streets absorb and hold onto heat.” But that is not a small concession, rather that is a fundamental point. It is mostly nighttime temperatures that are influenced by UHI, as discussed in detail by meteorologist Anthony Watts over at Climate at a Glance, here.

Oddly, MJS also claims “another alarming trend given extreme nighttime heat can actually be deadlier than daytime heat.” The MJS presents no evidence this is true, because there is none. More importantly it misses a larger point. Cold temperatures are deadlier than heat. If nighttime lows are trending upwards, this should save lives on balance.

Citing the report, MJS also claims that climate change is causing “greater fluctuations in lake levels” and that overall, water levels are rising. This is ironic, in 2013, climate alarmists warned warn that computer models forecasts that Great Lakes would gradually lose water from climate change. And in 2024, the Washington Post warned again of falling Great Lakes water levels. Now, alarmists claim that water levels are rising in general but also see-sawing unnaturally. The truth is there is no consistent trend in water levels on the Great Lakes, nor are they waxing and waning in an unusual fashion. Throughout the limited “official” record of Great Lakes water levels, data show water levels have always varied widely over time.

As a final note, the authors of the study the MJS reports on, the ELPC, released a similar report in 2019. This one predicted that corn and soybean production would crash by mid-century. Since then, as a brief illustration on how flawed the models used by the study’s authors are, Wisconsin corn yields hit an all time high two years running in 2021 and 2022.

The MJS and the ELPC are interested in promoting climate alarmism, they are not interested in accurately reporting the unalarming truth about the Great Lakes region, a truth grounded in hard data that shows no trends in worsening weather or climate induced harms to people in the region. The MJS story is simply bad journalism, and the report it builds its misleading story around isn’t science at all, rather it is propaganda meant to promote a net-zero fossil fuel agenda, favoring the wider forced adoption of ever more wind and solar energy.

Wrong, The Hill, Climate Driven Corn Insurance Cost Projections Mislead the Public

In a recent editorial from The Hill titled “Climate change could deliver considerable blows to US corn growers, insurers: Study”, the author claims that climate change will cause a dramatic increase in crop insurance claims: a 22 percent rise by 2030 and a 29 percent jump by mid-century. The available evidence refutes this assertion. There is no data indicating corn crop losses are or will increase due to changing climate conditions.

From ClimateRealism

By Anthony Watts

In a recent editorial from The Hill titled “Climate change could deliver considerable blows to US corn growers, insurers: Study”, the author claims that climate change will cause a dramatic increase in crop insurance claims: a 22 percent rise by 2030 and a 29 percent jump by mid-century. The available evidence refutes this assertion. There is no data indicating corn crop losses are or will increase due to changing climate conditions. These dire predictions are based on flawed models, unverified assumptions, and an overreliance on speculative climate scenarios, rather than actual observed data for corn production, which has regularly set new records during the recent period of modest warming.

As seen below in Figure 1, for over 40 years, average temperatures in the United States have indeed been rising slightly.

Figure 1. United States surface temperature departure from average, 1985-2020. 40 year markers added by A. Watts. Original graph from NOAA.

However, this has not resulted in declining agricultural productivity as climate alarmists frequently suggest. In fact, U.S. corn yields have steadily increased over the same period, according to U.S. Department of Agriculture (USDA) data plotted by Purdue University and shown in Figure 2 below.

Figure 2. Annual U.S. Corn Grain Yields and Historical Trends Since 1866. Data derived from annual USDA-NASS Crop Production Reports. USDA data plotted by Purdue University.

The good news is that according to the USDA data, corn grain yields in the U.S. have steadily increased since the 1950s at a rate of almost 2 bushels per acre per year.

As detailed in this Climate Realism article, higher atmospheric CO2 concentrations have enhanced photosynthesis, particularly benefiting crops like corn. The USDA reports that corn yields have more than doubled since the 1980s, demonstrating the resilience and adaptability of U.S. agriculture. Improvements in seed genetics, better farming practices, and technology have all contributed, making farmers more capable of handling weather variations than ever before.

The Hill article leans heavily on projections generated by an “AI-powered tool” created by researchers at UC Berkeley and the University of Arkansas. However, as highlighted by numerous articles on ClimateRealism, including this detailed analysis, climate models have repeatedly failed to accurately predict weather patterns or crop outcomes over time. The notion that insurance claims will spike due to increased extreme weather events is speculative at best, especially considering the fact that data shows no noticeable trend in worsening weather. Extreme weather events of the types that might impact corn production or yields have not become more frequent or severe in recent decades.

The article’s warnings about “more intense droughts, longer heat waves, and more catastrophic floods” are not supported by current data. As discussed in this post, the National Oceanic and Atmospheric Administration and other authoritative bodies have found no clear trend in increasing drought frequency or intensity in the United States. Furthermore, flood data also contradicts alarmist claims. There has been no upward trend in flood severity or frequency, nationally.

The authors’ suggestion to alter farm policy by incentivizing practices like cover cropping and crop rotation might sound appealing, but even they admit these would lower annual yields. Imposing such policies based on speculative climate risks would harm the very farmers they claim to be trying to protect, reducing productivity in the name of theoretical resilience. Essentially policies like this would be incentivizing inefficiency.

Also, there is no evidence whatsoever that planting cover crops, rotating crops, or other so-called resiliency measures, will avoid losses if droughts or floods do become more frequent or severe. Instead, there would just be insurance payouts for alternative crop losses.

It’s astonishing that The Hill would publish such an article based on shaky, unverified models without at least checking real-world data trends on agricultural productivity and extreme weather. For over four decades, U.S. farmers have thrived even as temperatures have modestly risen. This editorial exemplifies the poor research and blind acceptance of climate alarmism that too often passes for journalism today. Instead of challenging dubious claims, The Hill parrots them, spreading fear and misinformation to the public.

Climate Fact-Check April 2024 Edition

As usual, we warn that these and other “average temperatures” are highly uncertain guesstimates that have no physical meaning and were exclusively invented for the global warming con. Our take on the apparent slight warming that has occurred since 1980 is that it has been driven by the natural phenomena of periodic El Niños, one of which we have been experiencing since mid-2023. On to this month’s fact checks.

From ClimateRealism

By Steve Milloy

Guest Post by: The Competitive Enterprise Institute, The Heartland Institute, the Energy & Environmental Legal Institute, the Committee for a Constructive Tomorrow, and the International Climate Science Coalition, and Truth in Energy and Climate.

Editor’s note: This summary serves as a fact check on the biggest false claims made in the media in April, 2024. 

April 2024 was the warmest month in the NASA satellite record:

But real-time global surface station data report that the cooling trend since January 2015 remains intact, despite about 500 billion tons or so of emissions:

As usual, we warn that these and other “average temperatures” are highly uncertain guesstimates that have no physical meaning and were exclusively invented for the global warming con. Our take on the apparent slight warming that has occurred since 1980 is that it has been driven by the natural phenomena of periodic El Niños, one of which we have been experiencing since mid-2023. On to this month’s fact checks.

Links: The Associated Press article.

Links: The Washington Post article.

Links: The Washington Post article, Great Barrier Reef coral extent.

Links: The Los Angeles Times article, Nature research article.

Links: The Washington Post article, Bengal Basin subsiding, Bangladesh land accretion.

Links: The Washington Post article, rainfall study.

Links: The Washington Post article, European scientists, James Hansen comment.

Links: The Associated Press article.

Links: The Washington Post article, Gavin Schmidt comments.

Links: The Washington Post article, Saudi Arabia research paper.

We’ll close this month with a lesson in “global temperature.” The Associated Press reported in “Broken record: March is 10th straight month to be hottest on record, scientists say” that: “March 2024 averaged 57.9°F, exceeding the previous record from 2016 by 0.18°F.”

But in March 1996, then-NASA chief climate scientist James Hansen claimed the global temperature was 59.7°F during December-January-February of 1995-1996:

“Global temperature” for December-January-February is not the same as March, but March is always warmer than December-January-February. So March 1996 must have been warmer than 59.7°F. Now, if every emission warms the planet, then March 2024 (57.9°F) should certainly have been warmer than March 1996 (59°F). But that does not appear to be the case. Something is clearly amiss with global temperature guesstimating.

Until next month, check out these additional great fact checks.

ClimateRealism.com

WattsUpWithThat.com

See you in June for the May Climate Fact Check!

Originally posted at JunkScience.com, reposted with permission.

Claimed Warming Not a Fact on the Ground

Why didn’t they start with the medieval warming period,
where the temperature was like today? The reason they don’t
is that it wouldn’t scare people into capitulation.

From Science Matters

By Ron Clutz

Jack Hellner writes at American Thinker Taking a look at my hometown data I discover the very opposite of the ‘global warming’ narrative is true.  Excerpts in italics with my bolds and added images.

The following are actual pieces of scientific data related to Springfield, Illinois, where I live:

The warmest day recorded in January is 73 degrees Fahrenheit on January 23, 1909, so every day in January, for the last 115 years, has been colder; the warmest day ever in February is February 24, 1930, when temperatures hit 78 degrees; the warmest day in March was March 21, 1907, when the temperature hit 91 degrees.

The average high temperature in Springfield today is around 36 degrees, and this weekend we are supposed to have highs around 30 degrees below normal, with wind chills around 20 below zero.

So, after 160 years of exponential growth of all the things the green pushers
say cause warming, we are thirty degrees below normal.

Temperatures have always fluctuated cyclically and naturally. Humans have no control over them, and there is no correlation between CO2 content, crude oil use, number of vehicles, and temperatures.

Yet, here is an article from two days ago, full of worthless information and repeated talking points, all to push the radical green agenda to scare people into capitulation:

Yet, here is an article from two days ago, full of worthless information and repeated talking points, all to push the radical green agenda to scare people into capitulation:

Earth shattered global heat record in ’23 and it’s flirting with warming limit, European agency says

Earth last year shattered global annual heat records, flirted with the world’s agreed-upon warming threshold and showed more signs of a feverish planet, the European climate agency said Tuesday.

The European climate agency Copernicus said the year was 1.48 degrees Celsius (2.66 degrees Fahrenheit) above pre-industrial times. That’s barely below the 1.5 degrees Celsius limit that the world hoped to stay within in the 2015 Paris climate accord to avoid the most severe effects of warming.

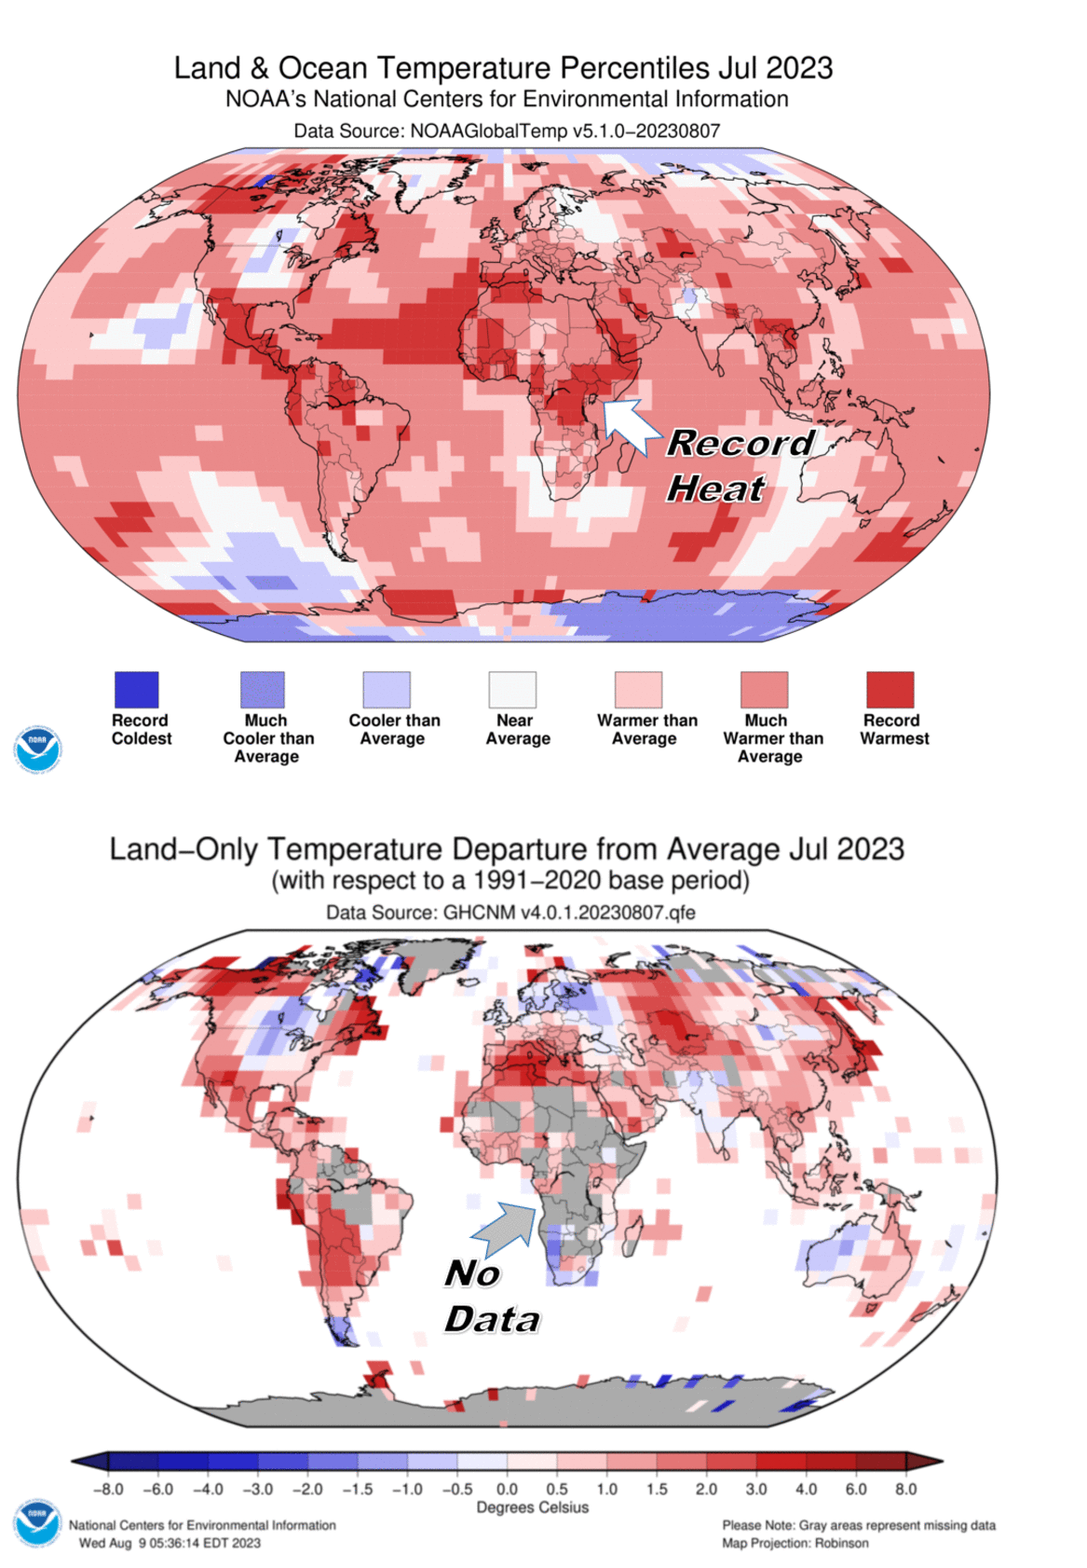
People with common sense and the ability to critically think should have several questions and comments about this article. First, they should point out that it is impossible to get an average global temperature unless they place the weather stations by area throughout the globe.

For example: 70 percent of the earth is covered by water, so 70% of weather stations should be placed over water to get a statistically accurate global temperature. Placing a much higher percentage of weather stations in urban areas, with cement and buildings, obviously skews the statistical results. Basically it is garbage in, garbage out.

Then they should ask why they picked the beginning of the Industrial Revolution as the starting point from which to measure. The Industrial Revolution spanned the period 1760–1840, which was during the little ice age. So, if you pick a cold period to start from, you exaggerate the change to push the agenda.

Why didn’t they start with the medieval warming period,
where the temperature was like today? The reason they don’t
is that it wouldn’t scare people into capitulation.

Why don’t they recognize the cooling period from 1940-1975 as disproving their theory that our use of natural resources causes warming? Because facts haven’t mattered in a long time.

One sentence that I find humorous is where people got together and decided exactly what the earth’s maximum temperature should be: “Earth last year shattered global annual heat records, flirted with the world’s agreed-upon warming threshold….”

Did they have a multiple-choice question? We will be able to adapt. It is pure arrogance when politicians, bureaucrats, the United Nations, and others pretend they can control temperatures, sea levels, and storm activity.

There are too many natural variables that we can’t control or predict. What people will never see in these articles that seek to scare people into capitulation is any actual scientific data that shows a direct link between our use of oil, coal, natural gas, methane, number of gas-powered vehicles, and temperature, or any other climate statistic because… there is none. But they don’t care.

The goal has always been to transfer money and freedom from the people
to the government and green pushers. They are greedy! It is a massive scam!

Temperature records from around the world do not support
the assumption that today’s temperatures are unusual.

As Above, So Below

The term temperature anomaly means a departure from a reference value or long-term average. A positive anomaly indicates that the observed temperature was warmer than the reference value, while a negative anomaly indicates that the observed temperature was cooler than the reference value.

From Watts Up With That?

Guest Post by Willis Eschenbach

I have the world’s best science gig. I can research whatever I want, whenever I want, for as long as I want, and I don’t get paid a dime no matter how hard I work. What’s not to like?

In any case, I got to wondering about how many temperature stations we’d need to get an accurate idea of the average temperature of the earth. Being a data guy rather than a theory guy, I figured I could use the CERES dataset to take a first cut at the question.

Let me preface this by explaining the temperature dataset I use in my analyses. The CERES radiation datasets don’t contain a surface temperature dataset. However, they have an upwelling surface upwelling longwave (thermal) radiation dataset. Because many of my analyses use the CERES dataset, I used the CERES surface radiation dataset to create a surface temperature dataset. I did the calculation using the Stefan-Boltzmann equation and utilizing the gridded surface emissivity from here.

How good is the resulting CERES calculated temperature dataset? Here’s a comparison with the Berkeley Earth, HadCRUT, and Japanese Meteorological Agency datasets. Seasonal variations have been removed from all datasets.

As you can see, the calculated CERES surface temperature agrees with the other three as well as they agree with each other. Turns out it also agrees better than either the HadCRUT or the JMA dataset with the Berkeley Earth dataset… so I use the CERES data in this and my other analyses. However, as indicated by the graph above, it makes no practical difference which dataset is used. Doing the following analysis on the Berkeley Earth gridded temperature dataset gives essentially the same results as using the CERES dataset.

With that as prologue, my scheme was to randomly pick a subset of the 64,800 1° latitude by 1° longitude gridcells that make up the earth’s surface, and see what that subset gave me as an average temperature.

The most interesting results were when I used just one percent of the gridcells (n = 648). Here’s an example of one of the random selections of 1% of the gridcells.

As you might imagine, running the random example many times gave very different average temperatures from different random subsets of 1% of the gridcells. Here’s a histogram of the average temperatures of a typical run of 100 trials using only 1% of the gridcells.

The average temperatures range from 13.5 to 16.5 degrees, so there is little agreement between subsets. No surprise, as I said.

But my next graph was a surprise. I decided to plot the monthly data for some of the individual runs. Here’s an example of ten runs, including the linear trend lines. I’ve removed the seasonal variations from each dataset.

Two things were surprising about this. One was that the trends were all pretty much identical. I expected much greater differences using only 1% of the data.

The other was that the actual monthly results were all so similar, having the same overall shape with just a different average temperature.

To investigate further, I plotted up the anomalies for each of the runs. I created the anomalies by subtracting the average of each run from the values of that run. Here are those results.

Fascinating. Although we can’t get much clarity on the absolute global average temperature from 1% of the data, we can use that same 1% of the data to get a pretty good idea regarding the overall trend and the monthly variations in the global average data. None of the individual 1% runs vary much at all from the global average, and their trends are tightly clustered. I didn’t expect that at all.

Next, I got to thinking about the oft-repeated claims that the Little Ice Age back in the 1600’s – 1700’s was just a Northern Hemisphere phenomenon, or that it’s only based on land records, or both. So, I thought I’d take a look at just the NH land data, to see how random subsets of just the northern hemisphere land matched up with the global data. Of course, since the NH land is much smaller than the globe and it’s land rather than ocean, the temperature swings in the average NH land temperature will be larger than the swings in the entire global average. So in order to compare them, I’ve adjusted for that in the following graph.

Again, most interesting. With knowledge of the temperature in around a hundred twenty randomly selected gridcells out of the 64,800 total gridcells, with the known gridcells located only on land and covering less than a quarter of one percent of the earth’s surface, we can closely approximate both the global temperature anomaly and the global temperature trend.

Any given run may or may not be all that exact a match to the entire globe, but none of them are much different, and their trends only vary slightly … which makes me misdoubt the idea that the Little Ice Age was a local phenomenon.

Seems like a validation of what I modestly call “Willis’s First Rule Of Climate“, which states:

“In climate, everything is related to everything else, which in turn is related to everything else … except when it isn’t.”

Best of life to everyone,

w.

As Always: I ask that when you comment you quote the exact words you are referring to. I can defend my words. I can’t defend your idea of what my words say.