Global warming, climate change, all these things are just a dream come true for politicians. I deal with evidence and not with frightening computer models because the seeker after truth does not put his faith in any consensus. The road to the truth is long and hard, but this is the road we must follow. People who describe the unprecedented comfort and ease of modern life as a climate disaster, in my opinion have no idea what a real problem is.
“European farmers are being told that because of the aim for “net-zero emissions” of greenhouse gases and other so-called pollutants in 2050, their industry is being phased out if they can’t adapt,” Furchtgott-Roth writes.
A recent article in The Daily Signal shows that the fight against climate change is having, and will continue to have, a deleterious impact on farmers and food prices. This unfortunate fact has been demonstrated repeatedly in recent years. Fossil fuels provide the energy and technology necessary for modern large-scale food production.
The article, “Climate Policies Will Shut Down Farmers,” written by Diana Furchtgott-Roth, director of The Heritage Foundation’s Center for Energy, Climate, and Environment, describes the loss of farmers’ livelihoods in Europe, as well as rising food prices, and reduced supplies, as a direct result of policies intended to fight climate change.
“European farmers are being told that because of the aim for “net-zero emissions” of greenhouse gases and other so-called pollutants in 2050, their industry is being phased out if they can’t adapt,” Furchtgott-Roth writes.
This Daily Signal story mostly cites the example of Belgian and Dutch farmers, as their governments are imposing increasingly harsh regulations on nitrogen oxide and ammonia based fertilizer use. A voluntary program promoted by the Dutch government, previously, resulted in a 70 percent reduction in nitrogen runoff. The government now claims that reduction was insufficient. Another 50 percent reduction is being demanded of farmers, and this time it is not going to be voluntary. Estimates are that the plan will force farmers to dispose of half their livestock and potentially cause more than 11,200 farms to close.
In response, farmers have been staging large protests over the rules, pointing out that their industry provides the majority of the meat for European markets.
Farmers and grocers in the UK are similarly upset with government climate policy. As Climate Realism covered in “Thanks, Epoch Times, for Reporting on How Net-Zero Policies Are Destroying British Agriculture,” the British government is paying farmers to stop using their land for crop-growing. Instead, the land is set aside for wilderness. The result, according to local farmers, is an increase in food shortages, with some grocery stores being forced to ration produce when imports are held up.
Furchtgott-Roth points out that it’s not just energy security, “…but also our agricultural production and food security, depend on fossil fuels, and we don’t want to destroy that security. Ammonia is a key component of fertilizer manufacturing and producing it requires natural gas.”
Farming methods that forego using fossil-fuel derived synthetic fertilizers, such as organic farming, require up to 30 percent more land to produce the same amount of food. Studies suggest that, without nitrogen fertilizer, only half of the world’s current population could be fed.
Furchtgott-Roth says as a result of policies driven by climate change alarm and Environmental, Social, and Governance (ESG) concerns, “countries are giving up agricultural productivity and raising food prices. This disproportionately hurts the poor, who spend a higher share of their income on food.”
One of the claims that Climate Realism most frequently debunks is that climate change is harming crop production (see here, here, and here, for a few examples). On the contrary, most crops are doing well and have been seeing improving production and yield over time. It is climate policies, especially those that are limiting the use of fossil-fuel derived fertilizers or increasing the cost of essential gasoline and diesel fuel that diminish farmers’ abilities to keep yields high.
Furchtgott-Roth and The Daily Signal are right to sound the alarm about the real, immediate negative impacts of shortsighted climate policies on the agricultural sector. Banning fossil fuels will not improve crop production, in fact the reverse is true; depriving the world of abundant fossil fuels for farming will prove to be the real crop-killer, with increasing hunger and starvation being the ultimate, entirely avoidable, result.
Linnea Lueken is a Research Fellow with the Arthur B. Robinson Center on Climate and Environmental Policy.
While she was an intern with The Heartland Institute in 2018, she co-authored a Heartland Institute Policy Brief “Debunking Four Persistent Myths About Hydraulic Fracturing.”
Why should we trust scientists or anyone else whose dire predictions of doom and gloom on the climate or global warming have been 100% wrong the last hundred years?
Jack Hellner poses the issue in his American Thinker article. A single multiple choice question for the ‘green’ energy pushers. Excerpts in italics with my bolds and added images.
Here is one burning question for scientists, entertainers, journalists, politicians, bureaucrats, and others who claim they can control the climate:
Which of the following has caused the reservoirs to fill up rapidly in California and elsewhere in the West?
A. The Paris Climate accord.
B. The misnamed “Inflation Reduction Act” in which the Democrats claimed they can control the climate by handing out huge amounts of money to “green” pushers.
C. All the United Nations gabfests where people fly in private jets to stump about the need to cut emissions.
D. Shuttering coal and natural gas utility plants.
E. Transitioning the peasants to cricket and mealworms as “food” to control cow flatulence.
F. Making people buy inefficient, expensive, impractical electric cars powered by the dangerous, highly-flammable pollutant lithium.
G. Sequestering CO2, a clear, innocuous, non-pollutant gas that makes plants thrive and allows the world to be fed.
H. Record rain and snow that came cyclically and naturally.
(I’m sure you guessed, but the correct answer is: H.)
According to scientists, this winter’s downpour in California and other western states turned out to be a positive, as it brought relief to the drought-ridden environments:
All the moisture has helped alleviate dry conditions in many parts of the western U.S. Even major reservoirs on the Colorado River are trending in the right direction.
Of course, the scientific “experts” who somehow failed to predict this record rain and snow, warned of the “stubborn” aridity:
But climate experts caution that the favorable drought maps represent only a blip on the radar as the long-term effects of a stubborn drought persist.
Here is a hint: The Sahara Desert used to be fertile until around 9,000 years ago. A stubborn drought has persisted since then and it was not caused by oil, coal, CO2, cars, methane, or any of the other things “climate experts” blame for causing droughts, flooding, too much snow, too little snow and whatever else with which they want to scare the public.
Why should we trust scientists or anyone else whose dire predictions of doom and gloom on the climate or global warming have been 100% wrong the last hundred years?
Everyone should understand that scientists and others who push the “green” agenda make a lot of money pretending they can control the climate. They would have their spigot of money cranked off if they told the truth that the climate is and has always changed cyclically and naturally. As always, follow the money.
The same people who claim they can control the climate:
Apparently lack the ability to properly regulate banks…and then blame Trump for the problem.
Can’t control or tell the truth about the crisis at the borders…and then blame Trump for the problem.
Can’t tell the truth or control the “spread” of COVID. Why would anyone trust the so-called “experts” at the CDC and the WHO who spread so much misinformation about COVID and destroyed so many businesses and people with their government edicts?
Told so many lies about Obamacare, including the “you can keep your doctor” and “keep your plan” shticks, premiums would go down substantially fib, and that it would lower the deficit. And most of the media still says how great it is.
Can’t educate children — no matter how much money they throw at it — to read or do math at grade level.
Yet we are told that these people can control temperatures, sea levels, and storm activity forever if we just give them trillions of dollars and allow them to destroy industries that produce reasonably priced energy and thousands of other products that have greatly improved our quality and length of life.
They have trouble predicting the climate a few days out and did not predict the record amount of rain and snow in California this yearbut supposedly they can predict temperatures within one degree one hundred years out, with all the natural variables?
Does it sound remotely intelligent to believe these people?
Feel helpless when trying to assess the veracity of “climate doom is looming” claims? Don’t give up trying to understand the relevant basics because you don’t need to be a scientist to do so.
Feel helpless when trying to assess the veracity of “climate doom is looming” claims? Don’t give up trying to understand the relevant basics because you don’t need to be a scientist to do so.
There is a rather simple way to get an idea about what this is all about. Even without a scientific background, most people have at least a good common sense. And that’s all it takes to get a grasp of how energy flows back and forth between earth’s surface and the skies.
Today in Part 5, we look at the linkage between the allegedly CO2-driven rise of air and sea surface temperatures on the one side and the disconnect between these increases and their strangely weak to insignificant impact on rainfall and hurricane intensity”.
Variability of cloud effects vs “greenhouse gas” effects
In the last chapter, we have seen that there are some discrepancies between the global warming trend as claimed by the official climate science and the local evolution of rainfall, which should be a direct consequence of higher temperatures since this causes more evaporation. This seems not to be the case e.g. for Germany, see Fig. 1:
Fig. 1. Germany’s national rainfall statistic for the years 1881 – 2022 with a 5-year moving average trend line, based on data compiled by the German Weatherservice DWD 5)
As already stated in the previous chapter, the 5-year running mean of the German rainfall timeline shows a marked negative trend setting in with the year 2003. That’s contrasting remarkably to the evolution of global temperatures as reported by NASA/GISS, see Fig. 2. Comparable trends (more sun, rising temperatures and less rain) can also be observed in other northern European countries, hinting at a broader regional pattern.
Fig. 2. Graph of the evolution of earth’s near-surface air temperatures from 1880 to 2022 using data from NASA/GISS 6), combined with a screenshot from the same source for the year 2022 showing the arctic and parts of Europe in fiery red.
The text coming with the NASA graph states that compared to the reference period defined as the time between 1951 and 1980, the year 2022 saw an increase of the worldwide temperature level of 0.89 °C. Included in Fig. 2. is also the last (2022) frame of a short animated film highlighting the corresponding regional temperature changes. It shows the arctic, northern Asia and Europe in fiery red suggesting that in these regions, temperatures have actually risen to alarming levels. It is interesting to note that white shades associated with no or only moderate temperature rise are mainly to be found in the northern Atlantic and in the eastern Pacific as well as in the southern oceans all around Antarctica.
Evapotranspiration and rain
The bulk of the world’s evaporation takes place over the surface of the oceans, see Fig 3.
It is interesting to note that while only 23% of global precipitation falls on land, only 35% of the 113,000 cubic km/yr of precipitation that comes down on land originates from the oceans while 65% stems from land-based evapotranspiration sources.
Fig. 3. merits a side note that in order to fight drought, the best levers are to trap as much downpour as possible by preventing it to be prematurely discharged into rivers by drainage systems and to renature wetland systems such as swamps or moors. Further measures should encompass reducing the flow speeds of rivers and streams and sufficient floodplains where water may stay longer even after highwater situations have subsided. Water that evaporates here will contribute to our downpour.
Another important aspect is to enhance plant cover wherever possible. Concrete, stones, gravel, paved surfaces and asphalt cannot evaporate water, and naked earth and sand are hardly better. The galloping urbanization 8) we are currently witnessing is a point of concern. Meadows are good and better still if they are allowed to grow long, and bushes and trees are best. With these facts in mind, the devastation of tropical rainforests as currently happening in many tropical countries around the world and especially in the Amazon region should be urgently stopped, or better still: reversed wherever possible.
Impact of temperature on evaporation
As Fig. 3. shows, 85% of all evaporation takes place over the oceans. This largely exceeds their 71% share of the total surface of the earth. The reason is that land surfaces often reflect a noticeable double-digit share of the sunlight they receive back into space, thus reducing the amount of energy they can trap and transform to warming, transpiration from plant growth or evaporation from open water surfaces. But even in warm and sunny southern Florida at the height of the summer, evapotranspiration rates do not exceed around 80 mm/month (~1000 mm/yr), see Fig. 4:
Fig. 4. Monthly evaporation rates for the contiguous US in June 22. Graphic: NOAA 9)
In stark contrast, ocean water swallows around 94% of the radiative energy reaching its surface. The resulting warming is then feeding evaporation, which is a highly energy-intensive process.
Due to their high absorption rate (=low albedo), the oceans absorb the highest rates of this evaporation are taking place in tropic latitudes because temperature is its predominant parameter. Really high evaporation rates are to be found over waters with a surface skin temperature above ~ 28°C. This the case e.g. in the Red Sea, which sees max evaporation rates of 2,000 to 2,500 mm/yr 10) in the hot season.
Now let’s combine the information presented in Fig. 2 – 4. with the rise of the sea surface temperature of the world’s oceans, see Fig. 5:
Fig. 5. From 1980 to 2020, the global SST of the oceans has risen by around 0.5 °C (0.9 °F). Graphic: NOAA 11)
At current temperature levels, it is expected that a temperature rise of 1°C would result in an increase of water vapor content in the air of about 7% 12). Where does this additional water end up? The usual path is ascension within warm air packages into higher levels of the troposphere (this is the lowest layer of the atmosphere with a thickness of about 8 km at the poles and 18 km over the equator).
Since the temperature of the troposphere falls by about 6.5°C with every km, the dew point of the water vapor is eventually transgressed. At this point, the water vapor condensates to droplets that form clouds. These clouds drift with the winds until the droplets grow to a weight that prevents them from staying in abeyance any longer, starting their journey down to earth as rain. The condensation frees the evaporation energy which is transferred to the air in which the cloud is hovering in, and the rest of the cloud continues its journey.
But there is an additional scenario that may develop as soon as a certain quantitative evaporation limit is overstepped. This threshold is reached when sea surface temperatures climb above a threshold of ~28°C 13). This is the “hurricane ready” limit when the amount of evaporation energy freed up in the ascending clouds starts to initiate a circular upwind turbulence that can lead to the formation of a tropical storm or even a hurricane.
No linkage between SST, rainfall and hurricane energy
Although most of the water evaporated over the oceans will rain down over the oceans again, the 35% share that ocean evaporation has on downpour on land should result in a marked increase of the related figures.
Fig. 6. The worldwide rainfall anomaly from 1901 to 2021 shows only a very weak upward trend of about 1 mm per year. Data: EPA 14) (Note that this graph shows only anomalies, not the full quantities as would be preferable. Given that the source is not the same as for the previous global rainfall graph shown as Fig. 6. in Part 4 of this article, it has not been possible to credibly merge the related datasets). But alas, this outcome does not show up in European countries such as Germany (see Fig. 2.), where rainfall has been downtrending for the past ~20 years. As already stated above, comparable trends (more sun, rising temperatures and less rain) have also be observed in other northern European countries, hinting at a broader regional pattern.
Fig. 7. The precipitation anomaly for the last 120 years for the contiguous US Data: EPA 14)
Fig. 7. shows that the US has clearly fared better than Germany. Starting around 1970, there has been an increase in downpour, although the long-term increase since 1901 is only ~0.5 mm/yr, which is only half of the worldwide trend documented in Fig. 6. Considering the marked upswing in sea surface temperatures, one might wonder whether the other possible outlet – the incidence and severity of hurricanes – might have served as a vent for the excess energy the sun has pumped into our oceans.
In the tabloids, there is indeed a constant background noise about more and higher intensity hurricanes resulting from “global warming” that’s swelling to panic-level volume each time a higher category hurricane is making landfall in the US. The already cited Wikipedia article 12) adorns a graph purporting to show that the number of the highest categories of Atlantic hurricanes has doubled over the last 20 years, see Fig. 8:
Fig. 8. This graphic seems to underscore allegations that the number of Atlantic hurricanes of the highest Saffir-Simpson categories (4 and 5) has noticeably increased in the past 20 years. Graphic: RCraig09 15), CC 4.0
Fig. 8. once again underscores the sad truth that Wikipedia is clearly biased towards the IPCC global warming narrative instead of delivering the scientific facts. The trick here has been to use a willfully shortened timeline and in the selection of just two categories of hurricanes. Other sources provide ample evidence that these settings convey an impression that is not giving the full picture.
Firstly, there is a nice compilation performed by five NOAA staffers 16) who have been looking at Atlantic hurricanes having hit the US territory as far back as 1851. They conclude that over the past 140 years, both the total number of such hurricanes as well as the ones belonging to the highest categories 3 to 5 have diminished, save of a marked peak in the 1940s. Unfortunately, their work was wrapped up and discontinued after 2004.
Secondly, there is a compilation of lecture documents established by the University of Arizona’s Department of Hydrology and Atmospheric Sciences 17) explaining how the frequency and severity of North Atlantic cyclones is influenced by the AMO (Atlantic Multidecadal Oscillation), a climatic swing phenomenon influencing the SST of the northern Atlantic. A full AMO period is 60 – 80 years. The current cycle is in its warm phase since the beginning of the nineties and has triggered an increase in hurricane activity with respect to incidence as well as to severity.
The main trick used with Fig. 8. was to set the start of the hurricane chart to the year 1980, which is in close vicinity to the lowest point of the low phase of the AMO. This is a sure way of producing an alarming message with the onlookers seeing this graph, which happened to be the (probably less than overinformed) readers of the NY Times.
And thirdly, there are scientists such as Dr. Ryan N. Maue who classify cyclones by their ACI (Accumulated Cyclone Energy). In his research covering the years 1970-2022, he identified and classified tropical cyclones on both the northern and the southern hemisphere of the globe, see Fig. 9.
Fig. 9. Survey of global ACI for northern (black circles) and global (blue circles) cyclones categorised by their respective accumulated energy content. Graphic: Dr. Ryan N. Maue18)
Fig. 9. shows that in stark contrast to the impression conveyed by Fig. 8, there has been no long-term increase of the energy released by hurricanes over the past fifty+ years. Looking at the graph of the northern hemisphere, we see a marked lull period stretching from 1973 through to 1990, followed by a rapid rise until 1994. Since then, there is a chaotic up and down around a mean level that is higher than that of the 70ies and 80ies, in line with the evolution of the AMO. The graph does not show any proof of recently increased storm energy levels as claimed by “global warming” protagonists. At this point, it should be emphasized that classifying cyclones by their energy content is certainly a more scientific approach than using the simpler Saffir-Simpson scheme.
The storm energy content provides a direct link to the evaporation energy of the ocean water that is fueling the phenomenon.
We thus have a clear disconnect between the marked rise of earth’s atmospheric and SST temperatures, Fig. 2, 3. and 5., which should have resulted in increased water vapor content in the atmosphere, and the graphs of global rainfall and global tropical cyclone energy (Fig 5. and 8.), which both show no clear upwards trends, if any.
This is not quite in line with the IPCC narrative of water vapor (and hence clouds, rain and hurricanes) mainly act as simple short-lived amplifier or booster following the directives coming from the carbon dioxide “congtrol knob” of rising temperatures. In the next chapter, we will look into this mystery a bit further.
The NA4 focuses on the year 2090 because the 1990 legislation that established the National Climate Assessment wanted predictions for the next century. The NA4 states that it is a “thorough examination of the effects of climate change on the United States.”
This report was originally written in mid-2019 in the hope that it would be published by the Competitive Enterprise Institute which had expressed an interest in its results. After some very slow editorial adjustments, its publication was postponed by the appearance of Covid. When Covid came to an end it was supposed to be published alongside a report by Pat Michaels. But it was left in abeyance when Michaels died last year. It only recently dawned on me that I could probably publish it on this website and I offer my thanks for the opportunity to do so.
Editor’s Note
With the imminent release of the 5th NCA expected sometime in the next few months, we felt this piece would be an excellent lens through which to view the upcoming report.
By Stan Liebowitz, Ashbel Smith Professor, Department of Economics and Finance, School of Management, University of Texas at Dallas
Most of the analysis and disputation regarding climate change is centered on how many degrees the climate is expected to warm over the current century. But an equally important question that has not received as much attention is whether there will be much economic harm from global warming. US legislation has required that the government study how an increase in temperature might affect the US economy in addition to the question of how much warming might take place.[1] These analyses, in the form of National Climate Assessments, take place every four years, with the last one (the fourth) in 2018 and the next one due in 2022.
On November 29, 2018, Black Friday, the federal government published Volume 2 of the Fourth National Climate Assessment (NA4), a 1,500+ page document examining the future economic cost of climate change.[2] The fact that it was made public during a holiday weekend was interpreted by many in the media as ominous evidence that the Trump administration was trying hide the report to limit political damage. The report, which the media nonetheless reported with great fanfare, was described as “dire” in The Atlantic, CNN, and Politico, as predicting “mass deaths and mayhem” by CBS News, “collapse and ruin” by Wired, and as demonstrating that “we’re screwed” according to Gizmodo.[3]
Admittedly, the tone of the NA4 is consistent with these apocalyptic descriptions in the media, describing unending fires, hailstones, storms, droughts, and floods, while showing riveting full-page color pictures of mountainsides blazing at dusk and houses being washed into the sea. That document is still the most recent official analysis of the costs of climate change harm to the US.
But despite all the doomsday descriptions, the projected costs of climate change found in the body of the report imply nothing remotely like doomsday. In fact, the damages estimated by the report are quite paltry in the big picture of things, less than 1 percent of future GDP, as detailed below. Certainly, the climate change damages portrayed in the report are far too small to warrant costly and disruptive actions, such as those proposed in the Biden administration’s version of the Green New Deal.
After the report’s release, Al Gore opined about the NA4’s results: “scientists and experts have made [the costs of climate harm] as stark and clear as possible.”[4] Unfortunately, this was not true. In fact, the lead authors of the NA4 meticulously avoid being “as stark and clear possible” by leading the reader to believe that the costs are much higher than those actually found in the body of the report.
The NA4 Examination of future economic harm.
The NA4 focuses on the year 2090 because the 1990 legislation that established the National Climate Assessment wanted predictions for the next century. The NA4 states that it is a “thorough examination of the effects of climate change on the United States.”[5]
Of course, any predicted future harm depends on the predicted actions that the U.S. and other countries take between now and then to mitigate the effects of climate change. The report discusses several possible types of actions countries could take to limit their emissions of carbon dioxide (CO2) and discusses various scenarios of greenhouse gas concentration levels. The most damaging and least realistic scenario, labelled RCP8.5,[6] assumes that global carbon emissions keep increasing through the end of the century to almost triple their current yearly rate, while overall concentrations more than double.[7] The NA4 also reports, with less emphasis, the harm from a less pessimistic scenario, RCP4.5. The Trump administration criticized the NA4 for focusing on the worst-case scenario (although it should have welcomed the findings given how small the predicted damage is). Since then, it has become more commonly accepted that RCP8.5 is overly pessimistic. In the work that follows, I report the evidence presented by NA4 for both the 4.5 and 8.5 scenarios.
The NA4 report predicts the 2090 economic damage from climate change. It estimates the dollar value of 22 different categories of potential damage from global warming, measured in 2015 dollars. These categories of damage include harms such as those predicted from rising oceans, mortality from excessive heat or poor air quality, costs from climate-related diseases such as West Nile Virus, and repairs for roads or bridges that are damaged by floods or erosion. Predicting anything 70 years into the future is normally considered a fool’s errand, but such prognostications are required when most of the harm is not expected to be manifested until many decades in the future.
These predicted 2090 damages represent the end product of the NA4 report.
What Is the Total Damage and Why Is it Hidden?
The dollar values (measured in 2015 dollars) of the predicted 2090 damages for these 22 categories of potential harm are found in the NA4’s Figure 29.2, reproduced below.[8] Note that in addition to the predicted damages under the RCP8.5 scenario, this figure also includes smaller predicted damages under RCP4.5, now generally acknowledged to be the more likely of the two. The analysis also pessimistically assumes that no technological improvements over the next 70 years will be used to mitigate the effects of climate change. I will assume that these NA4 estimates are correct (although many criticisms can be levelled at them). Thus, for the purposes of this analysis, I am not taking issue with their detailed results but instead with their summarization and presentation of the results.
Figure 29.2 (from NA4)
Strangely, there are two tasks that the NA4 does not undertake. First, the 22 categories of climate-induced harm are never summed to determine the total dollar value of climate-induced damage.[9] Second, these damages are never compared to the approximately $70 trillion GDP (about three and a half times as large as the current GDP) [10] that NA4 believes will exist in 2090.[11]
It is stunning that the NA4 never explicitly total the twenty-two rows of climate-induced costs, since it is the sum of these harms that measures the total economic damage from climate change. Why create a table of harms and not add them together? Surely a single number that encapsulates all of these harms should be essential to any reasonable analysis of the issue.[12]
When the values in the rows are summed, the total 2090 damages are $508 billion annually (or $284 billion for RCP4.5), as seen in Table 1 below. A cost of $508 billion appears to be a huge number, but it needs to be put into perspective. The simplest way to do so is to compare this predicted 2090 cost with the predicted 2090 GDP, as is done in the last row of Table 1, which leads to a clear result that predicted climate change damages in 2090 represent slightly more than seven tenths (or four tenths) of one percent of the GDP. This value would be even lower if any of the advanced technologies certain to be created in the next 70 years were used to help reduce carbon emissions.
Table 1: Adding the Damages and Comparing to GDP
RCP8.5
RCP4.5
Total Damages ($Billions)
$508
$284
Damages as share of $70 trillion GDP
0.73%
0.41%
The tiny size of the damage relative to GDP should be arresting to anyone who has paid attention to the climate change claims. Is a reduction in GDP of seven tenths of 1 percent seventy years in the future really something to seriously worry about? To even ask the question is to answer it. The stock market routinely loses 1 percent in a day and no one thinks it is a calamity. How many stores run advertisements proclaiming their 1 percent-off sales? Would most people even notice an unannounced 1 percent change in their paycheck? Realistically, 1 percent is not the type of value that gets people excited. It would normally be treated as a rounding error, not a value that should cause life-altering decisions.
These small costs should be further diminished because they occur far in the future and therefore should be discounted (converted to “present values” in economics parlance). The amount we should be willing to spend now should be far less than the nominal cost of these damages that occur far in the future.
Yet, the NA4’s discussions of the importance of the damages, to the limited extent they are undertaken, seem intended to mislead readers. Its authors’ main attempt to put these damages in perspective (in the initial summary of the report) is to contrast the three largest categories of 2090 climate-induced damage to the current GDP of small U.S. states, stating, “annual losses in some economic sectors are projected to reach hundreds of billions of dollars by the end of the century—more than the current gross domestic product (GDP) of many U.S. states.”[13] This comparison is disingenuous and wrong.
First, this is disingenuous because it is an irrelevant comparison. What difference does it make if some of these climate costs are larger than GDPs of some states? Some states have GDPs that are very tiny shares of the national GDP. Vermont, for example, generated only 0.16 percent of the 2021 national GDP. The climate change damages are calculated for the entire country, so the entire country’s GDP is the correct comparison, not the GDP of some small states. This is a misleading instance of comparing apples to oranges.
Second, it is a violation of basic economic principles to compare current economic values (state GDPs) to 2090 climate damages. As already mentioned, when comparing current to future values, we need to take present values. Further, the real (inflation-adjusted) GDP is expected to more than triple by 2090. We should want to compare these values in the same time period, as is taught in economics textbooks. We could adjust the value of 2090 damages to the present time in order to compare them to current state GDPs, which, with typical interest rates, would greatly lower the value of the future damages. Or, more simply, we could compare the 2090 state GDPs to 2090 climate costs. Adjusting current state GDPs to 2090 values,[14] and assuming that states kept their relative sizes, only Vermont and Wyoming would have 2090 GDPs less than the largest cost in Figure 29.2, not the “many” states claimed by the NA4.
Although it boggles the mind that the NA4 authors never perform the simple and obvious comparison found in Table 1, their failure was one of omission. Next, I discuss an offense of commission, the replacement of the results discussed in the report’s prior 1400 pages with those from a different study (with conflicting results), without alerting the reader to this switch.
Did the NA4 authors intentionally include misleading results?
Among the most troubling aspects of the NA4 is what appears to be a sleight of hand intended to disguise the unimportance of their estimated damages. It is bad enough to never straightforwardly perform an actual comparison of the predicted costs to the predicted GDP (as I did in Table 1), which is the most natural way to put the costs in perspective. But the NA4 authors go further and insert a diagram (Figure 29.3 which is reproduced nearby) that appears to make this comparison. But the right-hand portion of this diagram is taken from an entirely different study dropped into the NA4 essentially without comment!
Figure 29.3: Estimates of Direct Economic Damage from Temperature Change
The NA4 authors apparently hoped to induce readers to draw their own incorrect conclusions because readers are not told in a clear and direct manner that the diagram is the product of a different analysis. That diagram comes from a 2017 study published in Science, which includes only 5 of the NA4’s 22 categories of harm, but adds the category of “crime” which is predicted to increase with global warming.[15] Any confusion about the provenance of this graphic is important because the Science study estimates that climate change damages would be about six times higher than those found in the NA4 report for comparable increases in temperature. The Science study also considers temperature increases outside the NA4’s expected range.
A casual reader encountering Figure 29.3 and its heading is likely to think that the damage values in the right-hand side of figure are taken from those reported in the prior 1400 pages of analysis and then converted into share of GDP. But it is not. The only size comparison of climate harm relative to GDP made by NA4 authors from their own analysis is the already discussed unsuitable comparison with the current GDP of small states.
The reader might ask: “how can that be, given the inclusion of this diagram?” The answer is that the NA4 authors do not comment on this figure. The only statement by the authors regarding Figure 29.3 is: “Looking at the economy as a whole, mitigation can substantially reduce damages while also narrowing the uncertainty in potential adverse impacts (Figure 29.3).”[16] But the NA4 authors had already made this point in a lengthy discussion of Figure 29.2 (the list of 22 types of economic damage shown previously), particularly its right-most column showing the lower costs for RCP4.5. Figure 29.3 was completely unnecessary to make this point.
In spite of these shenanigans, the NA4 authors have technically protected themselves from a claim that they are trying to mislead readers because they (the NA4 authors) do provide a citation to that Science study which allows them to claim that readers should have understood that the right-hand portion of 29.3 is not based on the NA4 analysis. But to understand this requires that readers go the very end of a 219 word note at the bottom of the figure where it lists sources, and then draw the correct inference that it is not based on NA4 results. In reality, they have hidden this information from most readers.
If the goal of the NA4 authors was to have readers come away believing that the NA4 predicted climate change damages were much larger than the actual NA4 numbers, the authors appear to have succeeded brilliantly. For example, they fooled Steven Koonin,[17] a physicist at New York University and former Undersecretary of for Science in Obama’s Energy Department, who thought that NA4 damages were about six times higher than the actual number because he apparently didn’t realize that the right-hand portion of Figure 29.3 came from a different study. This misreading appeared, ironically, in his opinion article (recapitulated in his very useful recent book) claiming that the NA4 costs were surprisingly low even though the costs he thought were low were inflated by a factor of six.[18]
Also falling into this trap (most likely willingly) were virtually all major media outlets, with many making claims that the NA4 predicted a 10 percent future GDP decline due to climate change—e.g., The New York Times and CBS News.[19] This belief would seem to have necessarily come from seeing the highest circle in the chart because there is no analysis in the rest of the report that might allow a reader to reach that conclusion. Note that it is doubtful that rational people would consider even a 10 percent reduction in GDP 70 years in the future to be large enough to warrant major transformations in our way of life. As Koonin realized (but the Times and CBS did not), even these exaggerated measures of harm are fairly innocuous. A 4% reduction in 2090 GDP (which is Koonin’s understanding of the Science chart) is made back after two years, so that the final GDP is achieved in 2092 instead of 2090. Similarly, a 10% reduction would postpone this level of GDP only until 2095.[20] Of course, as we have seen, the actual predicted NA4 damage is a much smaller 0.7 % or 0.4 % under RCP8.5 or RCP4.5. This means that climate change’s effect is to postpone the 2090 GDP to be reached on March 1, 2090 or May 1 2090, instead of January 1, 2090, for 8.5 and 4.5 respectively.
Given these findings, I find it hard to avoid concluding that the NA4 authors intentionally tried to mislead readers about the small size of the expected climate-induced economic damage. Perhaps there is a more innocent explanation than the one put forward here, but it is far from clear what that might be.
Looking at these damages through a slightly different lens
Finally, the climate harms found in the NA4 can be put into a slightly different perspective other than to just compare it to the GDP. The authors of NA4 use the economic concept “value of a statistical life” (VSL) when measuring some climate harms. VSL measures how much people would pay to avoid a greater risk of death.[21] Using VSL allows us to make a different type of comparison that might provide more intuitive understanding of the size of the predicted climate change damages found in NA4.
For example, people dying from falling is currently an important cause of accidental death in the US. The VSL-estimated damage from people dying after falling, relative to GDP, is more than three times the NA4 estimated harm from climate change relative to GDP, using the more realistic RCP4.5 scenario.[22] Alternatively, the current damage from suicide deaths is four times as great as predicted climate damage (relative to GDP), and deaths due to flu or pneumonia (prior to Covid) cause five times as much damage as predicted climate damage. Damage from all cancer deaths, ignoring treatment costs, is more than fifty times as great as climate change.
The category of death with costs most similar to projected climate change damage is cancer of the esophagus (whose costs are only thirty percent higher). This means that we should consider climate change as a problem similar in size to that of esophageal cancer. Imagine if world leaders were to suggest spending $120 trillion over the next 15 years, an amount currently estimated as the cost of fighting climate change, to combat cancer of the esophagus. Or spending that much to combat accidental falls. It would likely be considered absurd by any rational person.
Although society tries to reduce deaths from falls, suicides, and esophageal cancer, no one has suggested uprooting our entire economy in order to reduce one of these causes of damage. Even efforts to find a cure for all cancer, whose damages dwarf the predicted harm from climate change, do not evoke calls for the type of disruptive economic efforts that are being suggested by the Biden administration and many others to reduce climate change. And remember, these numbers are not mine, but instead come from the National Climate Assessment. All I have done is to put them in perspective.
Conclusion
The Fourth National Climate Assessment is supposed to be a thorough examination of climate change impacts. If the authors have done their job and looked at the most consequential costs due to climate change, the current NA4 should provide their best expectation of the likely harm from climate change in the United States.
As such, the findings of the NA4 report are clear although unreported: The harms from climate change in 2090, assuming 70 additional years of the world belching out carbon emissionswithout any restraint (8.5), are fairly trivial. Even if the NA4 predicted damages were too low by a factor of 10, the expected harm would inflict only mild pain on the economy.
The logical conclusion to draw from the NA4 report is that the problems from climate change are smaller than many other quotidian problems such as deaths due to falling—and are much smaller than serious problems, such as cancer.
Therefore, it is illogical to provide massive resources and efforts to limit the damage from climate change. However, much of the news media have misrepresented the results found in the report, abetted by the NA4 lead authors failing to properly explain the climate change damages found in the Fourth National Climate Assessment.
The fact that the NA4 lead authors failed to be honest with their readers is inexcusable, and not what “scientists” should be doing. I presume that we can expect the same type of product from the next National Climate Assessment. The country and world deserve better.
[2] U.S. Global Change and Research Program, Fourth National Climate Assessment, Volume II: Impacts, Risks, and Adaptation in the United States, November 29, 2018, https://nca2018.globalchange.gov.
[6] RCP stands for Representative Concentration Pathway.
[7] Figure 1.1 in “Multi-Model Framework for Quantitative Sectoral Impacts Analysis, A Technical Report for the Fourth National Climate Assessment” May 2017
[8] Figure 29.2, found in two locations, pages 1349 and 1358.
[9] A footnote to this table claims that it is not a complete list of all climate-induced harms (and it does not look at all possible harms within a category). But if this analysis is to be of value, and if it is the “thorough” analysis it is claimed to be, this listing must contain what the analysts thought were the likely greatest harms from climate change. Thus, it seems reasonable to assume that it is at least a ballpark estimate.
[10] The NA4 projects that the real (inflation adjusted) GDP more than triples by 2090 and most of this is due to increases in per capita GDP since the population, estimated as the median U.N. population projection for the U.S., is expected to grow by less than 50 percent.
[11] This predicted future GDP value is found in NA4’s Technical Report, Figure 1.5.
[12] This point seems to have escaped almost all commentators except, to my knowledge, the Wall Street Journal’s Holman Jenkins. “Press Is the Enemy of Climate” Holman W. Jenkins, Jr., Wall Street Journal, December 4, 2018, https://www.wsj.com/articles/press-is-the-enemy-of-climate-1543966906.
[13] This quote can be found on page 26 of the NA4.
[14] Since total GDP is thought to grow from $20 trillion to $70 trillion, we assume that state shares remain constant and multiply the current state shares by the predicted 2090 GDP to derive the 2090 state GDPs.
[15] The citation is Solomon Hsiang, Robert Kopp, Amir Jina, James Rising, Michael Delgado, Shashank Mohan, D.J. Rasmussen, Robert Muir-Wood, Paul Wilson, Michael Oppenheimer, Kate Larsen, and Trevor Houser, “Estimating economic damage from climate change in the United States,” Science, Vol. 356, Issue 6345 (June 2017), pp. 1362-1369, https://science.sciencemag.org/content/356/6345/1362.
[17] Author of the recent book “Unsettled” which looked critically at the more alarmist aspects of the climate change movement.
[18] Steven Koonin, “The Climate Won’t Crash the Economy,” Wall Street Journal, November 26, 2018, https://www.wsj.com/articles/the-climate-wont-crash-the-economy-1543276899?mod=article_inline. Although Koonin was arguing that the implications of Figure 29.3 were not very dire, based on his view of the amount of warming in 2090, although the Science study has much higher harms than found in the actual NA4 results.
[21] VSL is considerably larger than what a typical person would have earned in a lifetime and is generally thought to be about $7 million per life.
[22] This calculation takes the current number of deaths (found at https://www.worldlifeexpectancy.com/usa-cause-of-death-by-age-and-gender) and multiples those values by $7 million to arrive at the total current loss due to mortality. Those value are then divided by $20 trillion, which is an approximation to the current US GDP.
Cold winter temperatures and high natural gas prices are generating utility bills that are too hot to handle for New Yorkers.
“I looked at my gas bill, and it’s going up — it seems like by the hundreds,” said Cheektowaga resident Ruth Alford to Buffalo’s WUTV in December. Applications for the state’s Home Energy Assistance Program have surged.
New York utility companies estimate residents are paying 20% to 40% more on natural gas bills this winter than last. These increases are in addition to similar large rate hikes last year. ConEdison projects average residents can expect to pay $419 per month for natural gas.
State and federal opposition to natural gas production has artificially depressed supply and is partly responsible for high bills. New York State forbids fracking, and the Biden administration has approved the fewest federal oil and gas drilling permits since the Truman administration.
Additional regulations threaten to make the affordability problem worse. Gov. Kathy Hochul recently proposed a state cap and trade emissions system, and the Biden administration has announced new rules on methane emissions, a byproduct of natural gas production.
High energy prices disproportionately hurt residents on fixed incomes and small businesses with thin profit margins. Before costs spiral any further out of control, a robust climate and energy policy debate is urgently needed.
To help address the problem of unaffordable utility bills, Gov. Hochul recently announced that taxpayers will pay $672 million to bail out the past-due energy bills of 478,000 residential customers and 56,000 small businesses. In her State of the State address, Gov. Hochul also announced she would ban natural gas furnaces in new buildings. The state government recommends residents use clotheslines instead of dryers to reduce energy costs.
Such drastic measures are allegedly needed to stave off the worst effects of climate change. Gov. Hochul claims her energy policies “protect our communities and the next generation of New Yorkers from the growing threats of the climate crisis.” United Nations Secretary-General António Guterres says the planet is “on a highway to climate hell with our foot on the accelerator.”
The threat of climate change supposedly rules out the obvious competing policy solution to this problem: boosting the natural gas supply. This alternative to crushing utility costs, taxpayer bailouts, and natural gas bans requires an energy policy rethink that involves overturning New York State’s fracking ban and ending the regulatory war on fossil fuels.
Can the climate handle it?
The following facts suggest it can: 1) U.S. per-capita carbon dioxide emissions have fallen by nearly one-third since 2005 thanks to the free-market fracking revolution; 2) the U.S. only emits 13% of global emissions, so no net zero regulations it pursues will meaningfully affect temperature without regulations on China, which emits way more than all the developed nations combined; 3) humans can adapt to the slightly warmer temperatures predicted by the scientific community.
Steamboat Institute, as part of its Campus Liberty Tour, is bringing this urgently needed energy and climate policy discussion to Cornell University on March 15, in conjunction with the Cornell Free Speech Alliance. Robert Socolow, professor emeritus at Princeton University, and Steven Koonin, former Undersecretary for Science in the Obama Administration, will debate the following resolution: “Climate science compels us to make large and rapid reductions in greenhouse gas emissions.”
The United Nations claims climate change is a “code red for humanity” with “billions of people at immediate risk.”
That may be true, but not necessarily in the way the U.N. has in mind. As Dr. Koonin argues, “Precipitous climate action is a far greater threat than climate change.” The unaffordable energy bills facing many New Yorkers this winter give credence to his claim and necessitate a long overdue climate and energy policy debate.
Democracy depends on a better-informed public. A public succumbing to fear mongering and lies only opens the door for bad solutions and government tyranny.
Here I will deal with how people are being misled by a toxic mix of scientific truths re-framed by false narratives.
Increasing CO2 undeniably re-directs more energy back to the earth’s surface increasing the earth’s potential warming.
However, as easily demonstrated in this video, increasing CO2 is not causing more drought and wildfires
Physicists have reliably determined that CO2 is increasing the earth’s warming potential by about 2.5 watts per meter squared. That science is indeed settled.
However, how it will affect earth’s climate is definitely not settled. Depending on the earth’s sensitivity, different scientists hypothesize a doubling of CO2 concentrations since the mid 1800s has the potential to raise global temperatures somewhere between 1.5 to 4.5 Celsius.
So far, CO2 has only increased by about 40%.
So, to convince you that a 1 degree rise in a hundred years is deadly & dangerous, politicians like Al Gore repeat claims by alarmists like climate scientist Jim Hansen, that CO2 is adding the equivalent of 600 thousand Hiroshima bombs each day.
To justify that ridiculous scary narrative, they simply multiplied CO2’s 2.5 watts per meter squared by the earth’s 500 trillion square meters of surface area and then multiplied that result by over 86,000 seconds. Finally, they ignore how much energy quickly escapes back to space.
At the 2023 World Economic Forum a desperate Al Gore claimed those bombs were boiling our oceans. He must believe the public is stupid or just too scared to think critically.
The average temperature for the earth’s oceans is about 4ºC, just 4% of the temperature need to boil water! Even the warmest hot spots on tropical ocean surfaces only reach 33% of the boiling point.
If your kids or friends have been terrified by such lies, I suggest doing a real scientific experiment in your own home.
The average ranch house has a living room that is about 31 square meters large. A lamp with a 100-watt light bulb, will provide about 3.2 W/ m2 of energy to that room, a little more energy than currently being added by CO2.
Seal the living room off from the rest of your house and only use that light bulb to warm the room during the winter. It will be very clear that 2.5 watts/square meter is not providing dangerous heat nor preventing dangerous cold.
Click-bait media profits from cherry-picking disasters, fear mongering and misinforming.
For example, in November 2022 CNN announced California’s climate crisis is intensifying and taking a heavy toll on residents.
Reading on, they reported the stark reality of climate change in California is clear: record high temperatures, unrelenting drought and unprecedented wildfires.
I’ve addressed the wildfire misinformation in earlier presentations. Just google “Understanding Wildfires and How We Must Adapt” or “Setting Senator Whitehouse Straight on Climate and Wildfires”
Because climate alarmists can only claim that wildfires are getting worse because rising CO2 is raising vapor pressure deficits and drying out the land, this video focuses on the causes of drought and dryness.
First, using the Palmer Drought everity Index, an EPA time series for the United States contiguous 48 states, shows absolutely no trend in droughts for the last 125 years. The worst drought conditions happened in the 1930s.
Looking at 100-year regional trends, there have been fewer droughts in the eastern half of the United States.
The only region with a significant drying trend is California and the American southwest where drying due to La Nina-like conditions have the greatest impact.
And that drying trend will be greatly reduced with another year of data as California’s 2022-2023 water year is experiencing record high rain and snowfall.
Using tree rings of the Blue Oak, a moisture sensitive tree growing in the Sierra Nevada foothills, rainfall variability can be extended back to the 1300s. Yet again, there is no long-term drying trend. The 21st century is not experiencing any unusual precipitation trends, also called meteorological drought.
Similarly, NOAA modeled the Palmer Drought Severity Index back for the past one thousand years. This metric evaluates agricultural drought and soil moisture nonetheless they determined worse droughts happened when CO2 concentrations were much lower than today
NOAA’s data on California’s annual rainfall since 1900 also shows no trend.
So, there is absolutely no correlation at all with rising greenhouse gases.
There are better correlations with the all-natural Pacific Decadal Oscillation which refers to the 20–30-year switches between El Nino-like and La Nina-like ocean conditions.
Paradoxically the narrative on how rising CO2 concentrations raise temperatures depends partly on increasing moisture, not increasing drought.
Here is the suggested mechanism. First, rising CO2 adds about 2.5 watts of energy and potentially raises air temperatures.
The air holds more moisture as temperatures rise.
Increasing water vapor is a greenhouse gas that amplifies that temperature increase by 1.7 times.
Despite the small temperature change, some very impressionable people who never think critically, become convinced that climate change is causing human extinction.
Those impressionable pawns of climate alarm have been misled by many so-called experts, such as those at the National Science Foundation funded UCAR Center for Science Education.
Their website writes-that global warming is causing “more evaporation, so there is more water in the air, so there will be more intense rainfall causing flooding.
But under the category that all things are possible if you just believe in the government
Their very next paragraph states the opposite dynamic where “more evaporation turning water into vapor causes drought”.
Thus, we are inundated with a pseudo religious scientific claim that with “CO2 all things are possible”.
Our impressionable and vulnerable children then become depressed falsely believing rising CO2 is destroying their future with both floods and drought!
In contrast, drier and warmer weather happens when greenhouse warming is most reduced.
Scientific consensus shows drier land causes higher temperatures, as measured in California’s Death Valley or the deserts of the Sahara and Middle East. Those deserts have been created by atmospheric circulation that brings dry weather.
Wet weather has more clouds and water vapor.
More clouds have a cooling effect by reducing solar heating.
More water vapor promotes more evaporative cooling.
But because water vapor is the most powerful greenhouse gas, absorbing 3 to 4 times more heat than CO2, water vapor increases greenhouse heating.
Still those combined dynamics show wet weather results in cooler temperatures.
Dry weather however brings clear skies and reduced water vapor. That increases solar heating.
Less moisture reduces evaporative cooling further warming the surface.
Reduced water vapor reduces greenhouse warming,
Thus, dry weather increases temperatures when greenhouse warming is most reduced.
Due to powerful moisture effects, there is no need for an increase in solar or greenhouse radiation to account for rising temperatures.
First, to be clear, joules are simply a measure of energy, and watts are a measure of how much energy is delivered each second.
So, to put joules into perspective, it takes 4.18 joules to raise a gram of water by 1 degree Celsius.
But a whopping 2,257 joules are required to convert a gram of liquid water to water vapor. And despite absorbing that much energy, there is no change in temperature, which is why evaporation causes latent or “hidden” heating.
When there is no water to vaporize, all that energy will quickly raise air and soil temperatures. It only takes 1 joule to raise a gram of air by 1 degree Celsius. Because that energy input can be detected as a rising temperature, it is called sensible heat.
It is the shift from latent heat to sensible heat that accounts for the increasing soil and air temperatures as the soil dries. Soil temperature can rise by 10 degrees Celsius as the soil goes from 30% to 0% moisture content.
Air temperatures are primarily governed by contact with the ground. Air that contacts warm surfaces rises, allowing cooler air above to sink and warm. This convection loop determines the air temperatures used in climate science.
Accordingly, several scientific studies show the strong relationship between air and soil temperatures.
Human groundwater extraction lowers the water table and can reduce soil moisture, hasten the arrival of the local wilting point and preventing further transpiration, while shifting temperature control to greater sensible heating.
Stress from ground water depletion further amplifies the Southwest’s vulnerability to dryness and resulting warming
Urbanization further reduces soil moisture and removes cooling vegetation driving the urban heat islands. Climate scientist Dr Roy Spencer has presented evidence from his research showing that Urban Heat Island effects are largely indistinguishable from any theoretical CO2 driven warming.
Similarly, dog lovers concerned about dangerous surface heat that could burn their dogs’ paws present this warning:
When air temperature is at 95 F,
Dry black asphalt reaches 140 F, while lighter colored cement reflecting more sunlight, only reaches 125 F.
As asphalt and cement increasingly covered urbanized areas more surface temperatures increased by 35 to 50f higher than surfaces with living grass.
Weather stations in the Global Historical Climate Network are becoming increasingly urbanized and skewing global temperatures.
Only 13.2% of all GHCN weather stations can be called truly rural, where natural warming is best measured.
In addition, airport weather stations with their asphalt and cement runways and parking lots are increasingly becoming the backbone of weather stations in the climate network. So how often are alarmist scientists and click bait media incorrectly attributing warmer temperatures and natural droughts to rising CO2??
Democracy depends on a better-informed public. A public succumbing to fear mongering and lies only opens the door for bad solutions and government tyranny.
“I am actually a geologist and a republican but your spread of misinformation is disgusting. Anything for a buck. But you know what Rob? Karma is a bitch.” (Howard to Bradley, below)
“Hate speech? Sounds like you cannot handle the arguments against wind and solar and batteries. What about consumers, taxpayers, and basic energy freedom? Classical liberalism and the free market are obviously not your thing. But don’t get angry about it.” (Bradley to Howard, below)
An unpleasant exchange on social media began with my response to a post from DOE Secretary Jennifer Granholm (or one of her handlers):
If there was one takeaway I hope folks took from #CERAWeek last week, it’s that America’s energy future and energy security depends on every sector working in concert to ensure we are prepared to meet and lead the moment.
To which I responded: “More oil and gas and coal … less wind, solar, batteries. I hope that is what the smart money is thinking.”
Then came a reply to my comment from Milton R. Howard, vice president of development at Terra-Gen, LLC. His previous positions are vice-president, wind and solar development at Duke Energy and VP, development for NRG Energy. Tomorrow’s post will review his sizeable wind projects, most in Texas, that played their role in the Great Texas Blackout of February 2021.
Mr. Howard describes his business acumen as follows:
Utilize my energy development, management, sales and environmental experience to create substantial value for Terra-Gen and its investors. My teams and I have successfully developed $4 billion of green-field power generation projects and acquired over $1 billion. I derive immense satisfaction from envisioning growth, making it happen and creating value. In essence I am driven to make things better from an overall economic, social and environmental standpoint. I am passionate and a high achiever but also very much a people person. I thrive on making new contacts, developing relationships, helping others grow/become successful and making this world a better place than I found it.
Then came this exchange:
Howard: Yea thats exactly the message and how energy companies of all energy forms all work together. Smart.
Bradley: Parasite energies win at the expense of the superior energies (and taxpayers). Not very smart except to grab government lucre (boo!).
Howard: [Bradley] is a hired gun to spread misinformation about the renewable industry. Koch Industries has been funding this campaign since around 2009. His organization should be called a Wasted Energy Research. Pathetic job.
Bradley: Vile ad hominem. Hate speech? Sounds like you cannot handle the arguments against wind and solar and batteries. What about consumers, taxpayers, and basic energy freedom? Classical liberalism and the free market are obviously not your thing. But don’t get angry about it.
Howard: Just so full of facts. I am actually a geologist and a republican but your spread of misinformation is disgusting. Anything for a buck. But you know what Rob? Karma is a bitch.
Bradley: You are digging your hole deeper, sir. Why the hate speech? What exactly is my ‘disinformation’? “Anything for a buck” …
So what is wrong with classical liberalism, which I have believed in since being stuck in the gasoline lines in the 1970s? I have written long books and a primer on my views and given talks at the business school and in the economics department of your alma mater, Texas A&M. Learned a lot about climate science from a (now retired) head of the meteorology department at Texas A&M.
Maybe I have better arguments than you do. Is this why you have resorted to personal smears against me?
Bradley: Thousands, actually. Are you continuing down an ad hominem path?
Are you questioning my personal integrity? What exactly are you insinuating by the insults (‘pathetic’ … ‘anything for a buck’) and now this question? And what, specifically, is my ‘disinformation’?
AND THEN HE JUST DISAPPEARED ….
—————-
Milton Howard has a lot to speak for given the Texas electricity debacle and wounded grid from the very projects that he, with government favors all the way, imposed on grid. Tomorrow’s post will list these projects and ask Mr. Howard some hard questions. Meanwhile, perhaps an apology is in order given that he refuses to document his charges and insults. Just moral hit-and-run driving, as a certain philosopher used to say.
The bird carcasses soon pile up wherever the wind industry plies its subsidy-soaked trade. When it comes to wholesale avian slaughter, the offshore industry sets the benchmark.
The bird carcasses soon pile up wherever the wind industry plies its subsidy-soaked trade. When it comes to wholesale avian slaughter, the offshore industry sets the benchmark.
Offshore wind is already meting out a phenomenal death toll on a whole range of seabirds in the waters surrounding Britain and across the North Sea.
Puffins are being pummelled, gannets and gulls ground out of existence, in their thousands. And all to produce (massively subsidised) electricity in chaotic fits and spurts.
Britain led the ‘green’ energy slaughter of seabirds, now the Dutch want in on the act, as Jason Endfield reports below.
Thousands Of Gannets Will Perish As North Sea ‘Wind Parks’ Expand Medium Jason Endfield 25 February 2023
The Netherlands government plans to industrialise the North Sea by building thousands of wind turbines, as it attempts to meet goals proposed under the Climate Agreement.
When Dutch citizens objected to renewable energy projects in their countryside, the government turned its attention to offshore development. But at what cost to the environment?
5000 giant turbines killing 8000+ birds each year… Plans for 5000 giant turbines in the North Sea have caused alarm in some environmental circles, even though the Dutch government has earmarked significant areas of its offshore territory as ‘nature reserves’.
Quite how functional these reserves would be in the midst of an industrialised ‘renewable’ energy zone remains to be seen, and according to a study by Wageningen University, “no one knows what effect extensive wind parks will have, nor what the nature network in the North sea should look like if we want to achieve our climate and nature goals”. It seems likely that the radical plan will go ahead regardless.
The study suggests that an estimated 3650 gulls and 4400 northern gannets will perish every year through collision with fast moving blades, if the target figure of 5000 turbines is achieved. The University’s marine research ecologist Martin Baptist explained, “that is why we are now looking into ways to scare the seabirds away from the turbines.”
Northern Gannet populations at risk… With the UK joining the Netherlands in its aspirations to further develop offshore wind farms in the North Sea, many are now wondering how wildlife can possibly survive in such a vast industrial area.
The UK coast is home to more than half of the entire world population of Northern Gannets, an amber listed species of high conservation concern. These magnificent birds are almost as large as an albatross and can live for many years.
Meanwhile, many species of gull are experiencing rapid population decline.
With such drastic plans to industrialise our seas, the long term survival of some species could be in doubt; there is an immediate and credible threat to birds, cetaceans, bats and other wildlife from offshore renewables, in addition to the potentially profound damage wind farms cause to micro marine ecosystems.
In the quest for ‘green’ energy, such a high level of collateral damage is highly problematic.
Following the money – into earth’s last wilderness… Some scientists and environmentalists have already raised questions over all of these issues, but their concerns have been swept aside as governments wilfully follow their agenda – and the money.
There was a time when the ocean was recognised as the last wilderness on earth, a refuge for many species, safe from humankind’s persistent interference. Alas not any more.
It’s madness to indulge the absurd fantasy that wind energy will save the planet.
Where money is involved, integrity can disappear into the ether, greed is often the primary driver of environmentally questionable projects such as the North Sea ‘wind parks’ – and many similar schemes worldwide.
Labelling them as ‘farms’ and ‘parks’ is a cynical attempt to make them more acceptable to the public. Furthermore, some might say that it is deceitful to promote them as ‘environmentally friendly’, ‘green’ and a solution to the so-called ‘climate crisis’. Medium
There is no question that disadvantaged communities suffer disproportionate environmental impacts but it is important to understand what causes the harms and balance expectations and potential solutions.
The PEAK coalition has stated that “Fossil peaker plants in New York City are perhaps the most egregious energy-related example of what environmental injustice means today.” The influence of this position on current New York State environmental policy has led to this issue finding its way into multiple environmental initiatives. Furthermore, this initiative has spread into other areas of the country. However, the presumption of egregious harm is based on selective choice of metrics, poor understanding of air quality health impacts, and ignorance of air quality trends.
Caveat
There is no question that disadvantaged communities suffer disproportionate environmental impacts but it is important to understand what causes the harms and balance expectations and potential solutions. I believe the concerns about fossil peaker plants are misguided. Moreover, there is no currently available technology that has been proven at the scale necessary that can replace fossil-fired generation in New York City safely, reliably, and affordably. If safety, reliability, and affordability are not prioritized, then it could easily result in an electric system that does not maintain current standards. More importantly, problems associated with them impact disadvantaged communities more than other communities so those concerns must be considered when decisions are made about peaking power plants.
I believe that thePEAK Coalition report entitled: “Dirty Energy, Big Money” is the reason that environmental justice organizations vilify all New York City peaking power plants. I have described this work in three posts. I published a post that provided information on the primary air quality problem associated with these facilities, the organizations behind the report, the State’s response to date, the underlying issue of environmental justice and addressed the motivation for the analysis. The second post addressed the rationale and feasibility of the proposed plan to replace these peaking facilities with “renewable and clean energy alternatives” relative to environmental effects, affordability, and reliability. Finally, I discussed the Physicians, Scientists, and Engineers (PSE) for Healthy Energy report Opportunities for Replacing Peaker Plants with Energy Storage in New York State that provided technical information used by the PEAK Coalition.
A post describing my comments on the New York State Department of Environmental Conservation (DEC) decision to deny the NRG Astoria Gas Turbine Power Replacement Project Title V Permit Application summarizes issues and implications of premature retirements.
In February 2023 I wrote an article about the risks of the zero-risk philosophy of environmental justice advocates who vilify peaking power plants. However noble the concept of eliminating any risks from any source of pollution, if it is construed to mean that anything that might be contributing to bad health must be prohibited, then society basically cannot function. Peaking power plant issues were discussed as an example of this problem in the article. The over-arching concern in the article is that the Environmental Rights Amendment to the New York constitution will inevitably set a high hurdle for permitting a new facility or keeping an existing source in operation. The amendment states: “Each person shall have a right to clean air and water, and to a healthful environment.” It is likely that a debate about what constitutes clean air will ensue for every permit application.
Air Quality and Health Metrics
The Clean Air Act established the primary metric to protect human health and welfare codified in a scientifically-based regulatory program. The National Ambient Air Quality Standards (NAAQS) “provide public health protection, including protecting the health of ‘sensitive’ populations such as asthmatics, children, and the elderly”. My air pollution meteorology career is based on the presumption that air quality that meets the NAAQS is acceptable.
Over my career air quality has improved markedly. The Environmental Protection Agency keeps track of air quality trends in the country. The following graph shows air pollution concentration averages.
There is no graph available for the Northeastern US but the data show similar decreases.
For the most part New York air quality reflects national and regional trends. According to the EPA nonattainment/maintenance status summary, there are multiple counties In New York that do not attain the NAAQS for ozone and New York County does not meet the coarse particulate matter standard. Note that all of New York State meets the inhalable particulate (PM2.5) NAAQS. All the other pollutants are in attainment.
Despite the fact that there have been significant improvements and New York is mostly in attainment with the NAAQS there is another approach to air quality health impacts that regulators and activists have used to claim more reductions are necessary.
Even though New York City is in attainment for inhalable particulates, this pollutant is used as a rationale for shutting down peaking power plants because of claims that reducing inhalable air quality impacts is beneficial. For example, the New York City Department of Health and Mental Hygiene’s (DOHMH) Air Pollution and the Health of New Yorkers report is often referenced in this regard. The DOHMOH report concludes: “Each year, PM2.5 pollution in [New York City] causes more than 3,000 deaths, 2,000 hospital admissions for lung and heart conditions, and approximately 6,000 emergency department visits for asthma in children and adults.” These conclusions are for average air inhalable particulate pollution levels in New York City over the period 2005-2007 of 13.9 µg/m3.
In my comments on the Draft Scoping Plan I explained that the following paragraph from Scoping Plan Appendix G: Section II summarizes the fundamental assumption for these health impacts:
Nevertheless, the health impact functions included in COBRA were developed from a specific population exposed to specific levels and compositions of PM2.5, and conditions in NYS have changed since these functions were developed. For example, the health impact function from the Krewski study was based on examining mortality impacts from 500,000 people in 116 U.S. cities between 1980 and 2000. The levels and compositions of PM2.5 have decreased substantially since 2000, as discussed above, with sharp declines in ammonium sulfate, making ammonium nitrate and secondary organic aerosols relatively more important components of PM2.5 However, the synthesis of the research into PM2.5 impacts on public health conducted for EPA’s draft Integrated Science Assessment for Particulate Matter indicates that the literature provides evidence that the health impact functions may be linear with no threshold below which reductions in exposure to PM2.5 provides no benefits. In other words, even though PM2.5 concentrations have been reduced in NYS in the time since the health impact functions were developed, the evidence suggests that the functions can adequately estimate changes in health impacts even at relatively low levels of PM2.5 Similarly, EPA’s draft Integrated Science Assessment finds that the literature is unclear as to whether changes in the composition of secondary PM2.5 species results in differential changes to health impacts. For this reason, this health analysis, along with most other similar benefits analyses, uses the total change in PM2.5 concentrations to evaluate health impacts rather than looking separately at impacts by the different PM2.5 species.
In brief, the Scoping Plan air quality health assessment depends on a linear no-threshold model. Originally used for radiation assessment, it suggests that each time radiation is deposited in the susceptible target there is a probability of tumor initiation. Note, however, that its use in radiation assessment is controversial.
Even if you accept the inhalable particulate health benefit premise, I don’t think that the arguments made in Dirty Energy, Big Money make a convincing case that the peaking power plants are the primary driver of air quality environmental burdens on neighboring communities. The ultimate problem with this approach is that the argument relies on environmental burdens from ozone and particulate matter air quality impacts. However, ozone is a secondary air pollutant and the vast majority of ambient PM2.5 from power plants is also a secondary pollutant. As a result, there is a lag between the time emissions are released and creation of either ozone or PM2.5. By the time the precursor pollutants convert to ozone or PM2.5 they have moved out of the neighborhood. That means that the peaking power plants do not contribute to the air quality impact problems alleged to occur to the environmental justice communities located near the plants. In fact, because NOx scavenges ozone the peaker plants reduce local ozone if they have any effect at all.
Prioritizing emissions reduction in Disadvantaged Communities should help to prevent the formation or co-pollutant emissions despite a reduction in emissions statewide. A broad range of factors may contribute to high concentrations of pollutants in a given location that create a hotspot. The result can be unhealthy air quality, particularly for sensitive populations such as expectant mothers, children, the elderly, people of low socio-economic status, and people with pre-existing medical conditions.
This contention is based on the arguments in Dirty Energy, Big Money. I have seen indications that there are people who believe that GHG emissions themselves have some kind of air quality impact exacerbated in disadvantaged community hot spots. That is simply wrong – there are no health impacts associated with carbon dioxide emissions at current observed ambient levels. Dirty Energy, Big Money and the Scoping Plan arguments are based on co-pollutant emissions (NOx and PM2.5) that allegedly cause impactful hot spots that result in unhealthy air quality. Note that all facilities in New York State have done analyses that prove that any locations with higher concentrations in the vicinity of power plants do not contravene the NAAQS. Trying to make the cap and invest program, that is appropriate for controlling GHG emissions to mitigate global warming, also address a neighborhood air quality problem already covered by other air quality rules is not in the best interests of a successful cap and invest program.
Conclusion
The argument that peaking power plants are a source of egregious harm to disadvantaged communities is based on selective choice of metrics, poor understanding of air quality health impacts, unsubstantiated health impact analysis, and ignorance of air quality trends.
I maintain that the appropriate metric for determining the impact to human health and welfare is the NAAQS process. Using a linear no-threshold model approach is not an appropriate metric for permitting decisions related to peaking power plants. Appeasing activists who demand zero-risks ultimately means that no emissions will be allowed and that will shut down society.
The argument that peaking power plants affect neighborhoods as portrayed is flawed. The air pollutants that are alleged to be the cause of a significant health impacts in disadvantaged communities near peaking plants are the secondary pollutants ozone and PM2.5. Because it takes time for the conversion from precursor pollutants, they are unlikely to affect adjacent neighborhoods simply because they are blown downwind during the conversion phase.
The biggest flaw in the argument is that activists argue that the health-related impacts are increasing at the same time that PM2.5 concentrations in the atmosphere are decreasing. All the air quality trends are going down. If proponents can show that there have been substantial benefits associated with the observed concentration reductions then I might be more sympathetic to the arguments.
Roger Caiazza blogs on New York energy and environmental issues at Pragmatic Environmentalist of New York. He is a retired electric utility meteorologist with over 45 years-experience analyzing the effects of meteorology on electric operations. He has been involved with peaking power plants in particular for over 20 years both from a compliance reporting standpoint and also evaluation of impacts and options for these sources. This represents his opinion and not the opinion of any of his previous employers or any other company with which he has been associated.


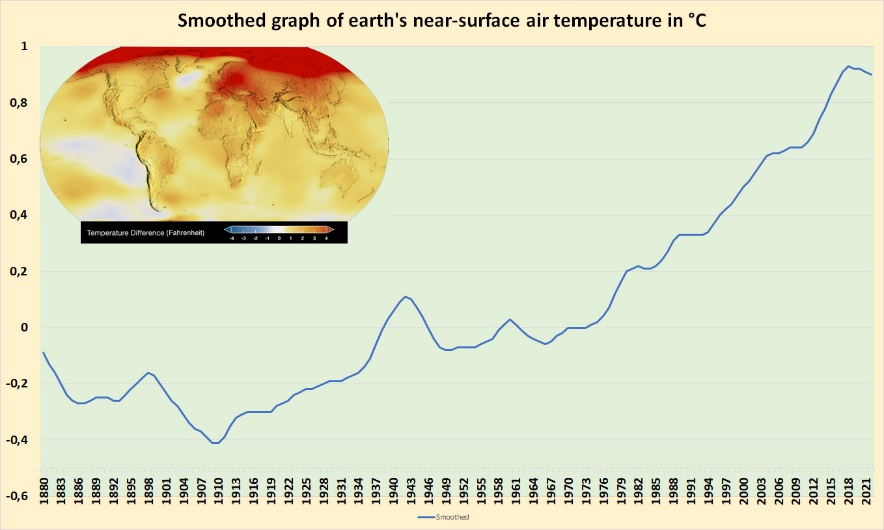


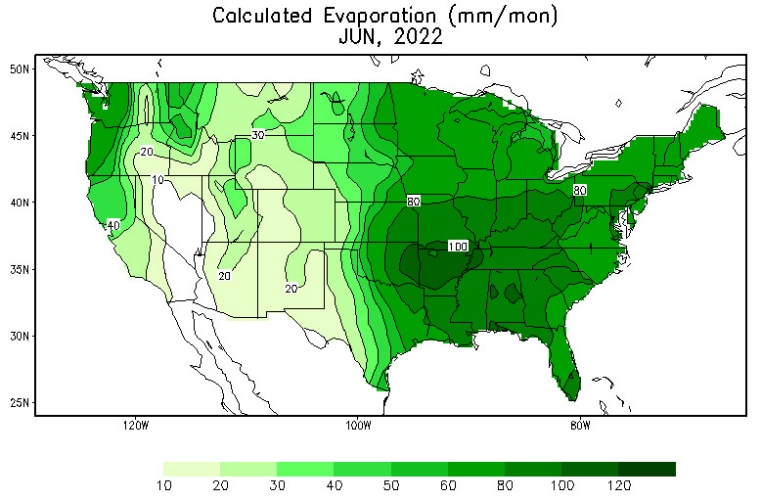


You must be logged in to post a comment.