Oceanic Warming in Two Bands, NH and SH

Heating in the climate system from 2000 to 2023 is most clearly manifested in zonal mean OHC for 0–2000-m depth. It occurs primarily in the top 300 m and is evident in SSTs. The SST changes emphasize surface warming in the NH, but the strongest energy increases are in the SH, where ocean area and volume are greater.

From Science Matters

By Ron Clutz

Chart shows two red heating bands, one in the northern hemisphere and one in the south. A more variable area including high temperatures lies between the two bands.

A paper analyzing changes in Ocean Heat Content (OHC) since 2000 was published at University of Auckland, summarized here:  Unexpected ocean heat patterns show NZ in extreme zone.  Excerpts in italics with my bolds and added images.

The world’s oceans are heating faster in two bands stretching around the globe and New Zealand is in one of them, according to new research led by climate scientist Dr Kevin Trenberth.

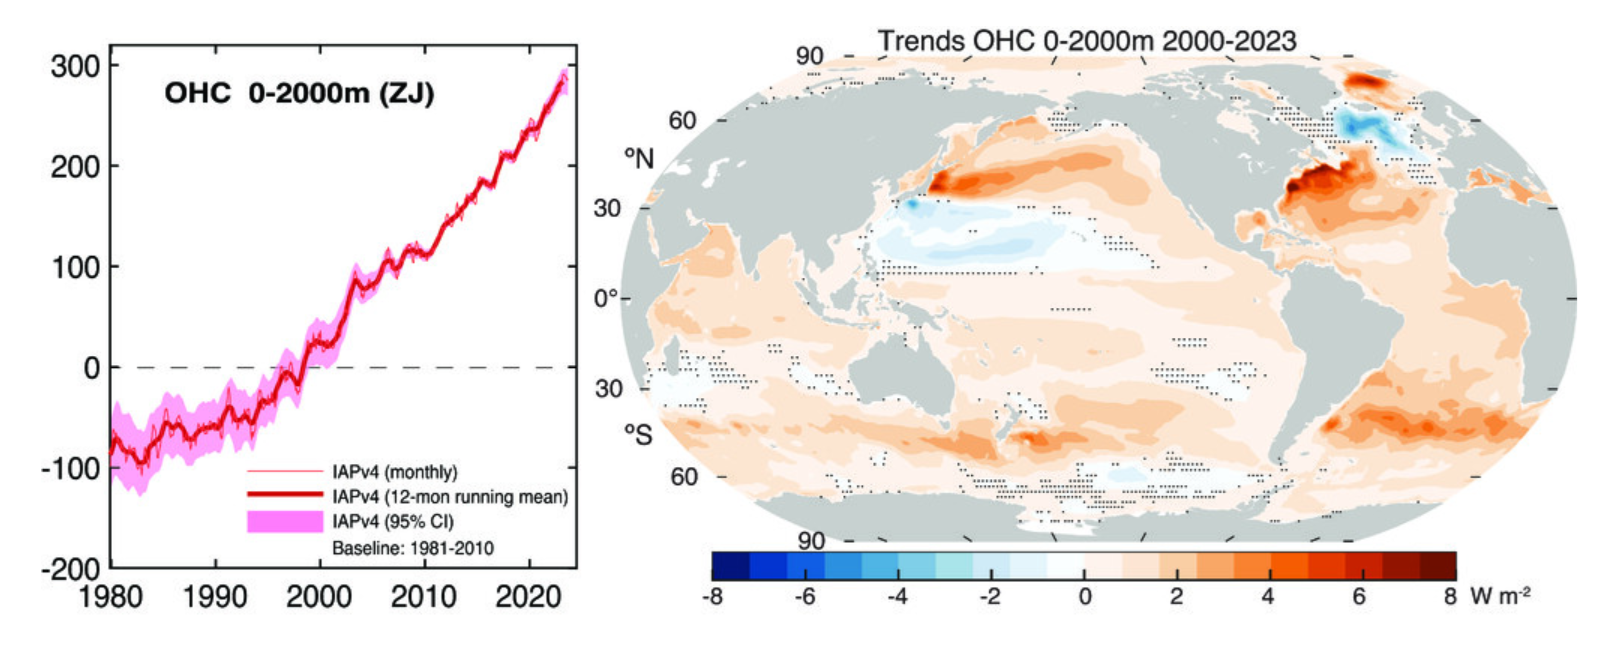
In both hemispheres, the areas are near 40 degrees latitude. The first band at 40 to 45 degrees south is heating at the world’s fastest pace, with the effect especially pronounced around New Zealand, Tasmania, and Atlantic waters east of Argentina.  The second band is around 40 degrees north, with the biggest effects in waters east of the United States in the North Atlantic and east of Japan in the North Pacific.

“This is very striking,” says Trenberth, of the University of Auckland and the National Center of Atmospheric Research (NCAR) in Boulder, Colorado. “It’s unusual to discover such a distinctive pattern jumping out from climate data,” he says. “What is unusual is the absence of warming in the subtropics, near 20 degrees latitude, in both hemispheres.”

The heat bands have developed since 2005 in tandem with poleward shifts in the jet stream, the powerful winds above the Earth’s surface that blow from west to east, and corresponding shifts in ocean currents, according to Trenberth and his co-authors in the Journal of Climate.

Besides the two key zones, sizeable increases in heat took place in the area from 10 degrees north to 20 degrees south, which includes much of the tropics. However, the effect was less distinct because of variations caused by the El Niño-Southern Oscillation climate pattern, Trenberth says.

The scientists processed an “unprecedented” volume of atmospheric and ocean data to assess 1 degree latitude strips of ocean to a depth of 2000m for the period from 2000 to 2023, Trenberth says. Changes in heat content, measured in zettajoules, were compared with a 2000-04 baseline.

The AMS paper is Distinctive Pattern of Global Warming in Ocean Heat Content by Trenberth et al (2025). Excerpts in italics with my bolds and added images.

Fig. 1. (left) Global mean OHC (Cheng et al. 2024a) for 0–2000 m relative to a base period 1981–2010 (ZJ). The 95% confidence intervals are shown (sampling and instrumental uncertainties). (right) Trend from 2000 to 2023 in OHC for 0–2000 m (W m−2). The stippled areas show places where the trend is not significant at the 5% level.

The focus of this paper is from 2000 through 2023, as 2000 is when reliable TOA radiation data became available. Accordingly, the OHC for the 0–2000-m depth is shown not only for the global mean but also as spatial trends over the 2000–23 period (Fig. 1); see methods in section 2. The global values from 1980 show increased confidence after 2005 or so, when Argo data became available globally (Cheng et al. 2017, 2024b). The spatial patterns of trends are of considerable interest because, although the ocean is warming nearly everywhere, by far the greatest increases are in the midlatitudes: in western boundary currents east of Japan in the Kuroshio Extension region of the Pacific and in the Gulf Stream extension in the Atlantic, and nearly everywhere from 35° to 50°S in the Southern Hemisphere (SH). Wu et al. (2012) earlier noted that the warming rate in subtropical western boundary currents in all ocean basins far exceeds the globally averaged surface ocean warming rate. Of particular interest is why the midlatitudes are warming the most.

Conclusions

Heating in the climate system from 2000 to 2023 is most clearly manifested in zonal mean OHC for 0–2000-m depth. It occurs primarily in the top 300 m and is evident in SSTs. The SST changes emphasize surface warming in the NH, but the strongest energy increases are in the SH, where ocean area and volume are greater. In the NH, heating occurs at all latitudes in the Atlantic with some modulation and slightly reduced MHT from the south, but in the North Pacific, strong warming near 40°N is countered by cooling near 20°N. The zonal mean across all oceans is more robust than a focus on any particular ocean basin.

Estimates of TOA radiation, atmospheric energy transports, surface fluxes of energy, and redistribution of energy by surface winds and ocean currents reveal that the patterns of OHC warming are mostly caused by systematic changes in the atmospheric circulation, which alters ocean currents. The coupled atmospheric changes have resulted in a striking pattern of changes in the vertically integrated atmospheric energy divergence which is strongly reflected in surface wind stress and anomalous net surface heat fluxes into and out of the ocean.

In response to the wind changes, the ocean redistributes heat meridionally, especially in western boundary currents in the NH. Hence, the patterns are not directly related to TOA radiation imbalances but arise primarily from coupled atmosphere–ocean changes. In turn, those influence storms and cloudiness, and thus TOA radiation. Changes in atmospheric aerosols and associated clouds may have played a role in the North Pacific and North Atlantic, likely in amplifying SST anomalies, although, because land is warming a lot more than the oceans, advection of warmer air from continents over the northern oceans may also be in play.

In the NH, changes are associated with the western boundary currents, but the associated atmospheric changes require analysis of more than a zonal mean framework, as continents play a major role. Nonetheless, it is clear that the atmosphere and ocean currents are systematically redistributing heat from global warming, profoundly affecting local climates.

My Comment:

The final sentence read literally refers to heat released by oceanic activity under the influence of solar radiation and atmospheric circulations such as jet streams.  However, the term “global warming” can taken by some to mean planetary higher temperatures due to humans burning hydrocarbons.  The leap of faith to attribute human agency to natural processes serves an agenda against society’s traditional energy platform.

Further, the graph showing zettajoules can be misleading.  Ocean heat graphs labelled in Zettajoules make it look scary, but the actual temperature changes involved are microscopic, and impossible to measure to such accuracy in pre-ARGO days.

Since 2004, for instance, ARGO data shows an increase of about two hundredths of a degree.

Tough to ignore examples as to why the weather can’t be “worse than ever”

Again I am not saying I have the answer. But to ignore what should be something that raises questions and shouting down people that bring it up is no way to pursue the true answer. I may not have that answer but I darn sure have some questions

Green meadow horizon and blue sky tranquil landscape scene

From CFACT

By Joe Bastardi

This is a golden age for people who love weather.

We are experiencing oceanic warming which is influencing weather and temperature patterns.   In the case of the interaction with the tropics and the global weather patterns, truth be told, looking at major precip and SLP patterns and their changes in the last 60 years, it is OPPOSITE of how it’s portrayed.

We all know that lower pressure is inherently more unstable, right?   

We all know and love big high pressures to the north and lower pressures to the south right?   Dr. Joel Myers, the founder of ACCU Weather,  had a rule. Lows follow highs. Predict the High you can predict storms. 

The biggest storms are when a stubborn high is moving slower than a storm advancing right at it.  

It’s common sense.

Now I want you to look at the  GLOBAL SLP of the tropical seasons of the 1950s.  I have the same scaling for the last 10 years below it:

Look at the tropical Atlantic and Asia. That’s a lot of low pressure. High pressure is banked up in the eastern US forcing the convergence to the south in the means.

Now look at the last 10 years:

SLP pressures are running higher. That implies less, not more instability in the entire pattern.

And the precip patterns show this in no uncertain terms.

The areas of wet and dry are more vivid in the 1950s ( again same scaling):

last 10 years:

Look at the flips that have occurred in the Southern Atlantic Basin   

Heaviest precip is now around land masses in Africa and Se Asia and Indonesia. 

What is most remarkable is both were periods of the warm AMO yet the Atlantic feedback is much different. This goes directly to my distortion point that says you can’t use the same ideas of cold and warm AMO and PDO and weight them equally. It’s intuitively obvious something is going on there that is pulling the focus away from the tropical oceans. 

And we observe it  in the lack of long-tracked storms hitting the US MAINLAND near their peak.   

Most of the storms that are major and hit the US become hurricanes 2 days away not 5 or more. 

What does this imply? That the total energy of the storm is less despite the ACE and Saffir Simpson scale indicating otherwise  Those metrics need to be expanded. 

Why? Because a longer-tracked storm covers more area so there is a larger diameter of strong winds even if the wind at the center is the same as the storm matures. So when someone tries to say things are getting worse, in a true sense of bundled energy and redistribution that is plainly not the case.  And the means show that. 

It’s the opposite. 

The drier areas are not drier and the wetter areas are not wetter. 

Rising pressures imply more, not less stability. Hence the reason many of the true weather geeks that have watched this for over a half-century more than anything else every day like it was eating and breathing, are bored a lot of the time. 

Can you imagine if we had the technology in the 30,40s 50s we have today? No weather nut would ever sleep there would be so much going on.

But here is the kicker. It does not matter in the end what is causing this, It matters that we research and adapt to the facts in front of us. 

It is more of a problem in forecasting than it is for the human race.  How do models handle situations where there may be more overall energy in the entire system, but spread out in such a way it can inhibit, not increase, total overall events?

Then there is the portrayal of the events.  The easiest thing for me to do is to sell out and say yes it is getting more extreme and who is the guy that for over 50 years has had the knock ( and if right the benefit). of seeing extremes and loving them? So much so that what used to be a positive, knowing the past, is becoming a negative for people that may not know it, or may not want it revealed because of how they want the present portrayed.   

But here is the fact. The good old days were more extreme. People growing up in the 30s thru 50s are leaving this life now, so their library of knowledge that has been a treasure to future generations is no longer that.  And its being swept away and diminished.  

And that is a shame.  But instead of putting tons of money into telling us how bad it is now, or how one thing after another is doomed, why don’t we get down to the real deal, looking at what the warming is doing and how it affects us in forecasting? 

This is not some cherry-pick. And any meteorologist that has any objectivity has got to understand that if the air is more stable and precipitation overall is less extreme, there is something going on that is opposite of what is being pushed, that NEEDS RESEARCH.     

And Simply saying this is worse than ever or that is worse than ever when it suits you (it is a great strategy, make sure no one knows what has happened and simply use the inevitable major weather event to support your argument) is not getting to what my field NEEDS TO KNOW. The actual changes that are the result and an objective look at the good, the bad, and the ugly ( I like the last 2 best more fun to forecast)

Again I am not saying I have the answer. But to ignore what should be something that raises questions and shouting down people that bring it up is no way to pursue the true answer. I may not have that answer but I darn sure have some questions

Author

  • Joe BastardiJoe Bastardi
  • Joe Bastardi is a pioneer in extreme weather and long-range forecasting.
  • He is the author of “The Climate Chronicles: Inconvenient Revelations You Won’t Hear From Al Gore — and Others” which you can purchase at the CFACT bookstore.
  • His new book The Weaponization of Weather in the Phony Climate war can be found here. phonyclimatewar.com