Global warming, climate change, all these things are just a dream come true for politicians. I deal with evidence and not with frightening computer models because the seeker after truth does not put his faith in any consensus. The road to the truth is long and hard, but this is the road we must follow. People who describe the unprecedented comfort and ease of modern life as a climate disaster, in my opinion have no idea what a real problem is.
A decade ago, I was able to get away from a terrible flood that killed more than 500 people in the southern India city of Chennai (formerly known as Madras). The bus taking me from the city barely managed to avoid rising water slowly but inexorably engulfing the roads.
A decade ago, I was able to get away from a terrible flood that killed more than 500 people in the southern India city of Chennai (formerly known as Madras). The bus taking me from the city barely managed to avoid rising water slowly but inexorably engulfing the roads.
My escape was only possible because I had been tracking the movement of a cyclone that had brought the deluge. That flood was not unusual. Once known for its light cotton fabric designs known by the Madras name and most popular in the 1960s, Chennai since has gained notoriety for frequent flooding.
In other articles, I have analyzed how recent floods in Chennai are not attributable to anthropogenic global warming, as some suggest, but rather to poor urban planning that has resulted in inadequate rainwater drainage and construction in areas that had naturally retained water.
Chennai is notorious for something else: its summer heat. Lately, the mainstream media has portrayed the extreme temperatures of the city as a sign of a climate crisis. But readings from a temperature station located near my former Chennai residence debunks this claim.
Dating back to 1855, records from Chennai’s Meenambakkam weather station (MWS) challenge the apocalyptic narrative of the purported runaway global warming dominating headlines. The data reveal a more nuanced story that tells of a modest rise in average annual temperatures over the last 170 years – a period that includes a record high set way back in the 19th century – and a modern warming trend that owes more to asphalt and jet engines than to carbon dioxide.
Since the mid-19th century, the annual average temperature measured at MWS has risen by less than half a degree Celsius – at a tortoise-like pace of 0.294 degrees Celsius per century. This is a fraction of the HadCRUT global model’s 0.65 degrees per century, which is often cited as evidence of a planet in peril. More striking still, the hottest day in this long record didn’t occur in the fossil-fuel-drenched 21st or 20th centuries but rather in May 1892.
This fact alone should give pause to those who paint Chennai (or for that matter most metropolitan cities) as buckling under unprecedented heat driven by global warming.
It is also worth noting the influence of the Urban Heat Island effect (UHI), which is a phenomenon common to all of India’s densely populated cities. Cities trap heat in their concrete jungles, artificially raising local temperatures, as do airports’ vast expanses of pavement and jet exhaust.
The city of Chennai is no exception. The MWS is nestled just 300 meters from the runway of Chennai International Airport.
Before the 1950s, the airport was a sleepy outpost, handling a handful of flights a day. By the 1980s, it had begun its ascent as a hub connecting Europe, Asia, and points beyond. Traffic surged through the 2000s. Today, it’s India’s third-busiest airport, radiating heat mere steps from the Chennai weather station’s sensors.
The station’s readings since the 1980s align suspiciously with the airport’s growth. Before the jet age, temperature increases were quite slow but accelerated after the 1980s. Coincidence? Maybe or maybe not. However, it seems likely that much of the warming denoted as a product of “climate change” in Chennai could be reflecting the transformation of a modest airstrip to an international gateway.
Further, the winter warming at MWS has been nearly negligible, registering just 0.09° Celsius per century. If global warming were the dominant force, we’d expect a more uniform rise across seasons. Instead, the data point to a localized, seasonal skew.
The fact that Chennai’s highest recorded temperature occurred in 1892, long before the era of modern industrialization and urbanization, is a powerful reminder that extreme weather events are not a recent phenomenon. This record, set during the British colonial period, predates the widespread use of fossil fuels and the subsequent rise in atmospheric carbon dioxide levels.
This is a reminder that climate discourse should embrace an evidence-based approach that acknowledges the substantial role of local environmental factors that contribute to temperature trends.
This commentary was first published at BizPac Reviewon March 28, 2025.
Vijay Jayaraj is a Science and Research Associate at the CO2 Coalition, Arlington, Virginia. He holds an M.S. in environmental sciences from the University of East Anglia and a postgraduate degree in energy management from Robert Gordon University, both in the U.K., and a bachelor’s in engineering from Anna University, India.
Why we should observe the ocean to better predict the atmosphere?
I may be embroiled in controversy with the monsoon professionals and modelers by writing this article. However, I would like to trespass and put forth some of my ideas in meeting the challenges to predicting the mysterious Indian southwest monsoon rainfall by including ocean observations.
Monsoon rains in India are mystical and erratic, either with too little water causing drought or far too much flooding! Even worse, extreme rainfall events have been very common in recent years with the number of days with heavy rains increasing and longer dry spells stretching out in between. As a result, normal and steady rains that can reliably penetrate the soil are decreasing. Adding to this, increasing deforestation and urbanization continuously reduce the infiltration capacity of the soil. As a result, groundwater is withdrawn faster than rain can recharge it. This is an alarming situation for a country like India, which gets the maximum share of its water through the rain. In addition, [it is claimed – kh] climate change is now messing with the monsoon, making seasonal rains more intense and less predictable.
Adding to these problems is the predictability or the unpredictability of the monsoon rainfall!
A monsoon is a seasonal reversal in the prevailing wind direction, that is usually initiated by the land sea temperature contrast. The Indian summer monsoon, for example, is triggered when the land gets heated up more than the surrounding sea during the summer creating a pressure gradient between the land and the sea (Figure 1).
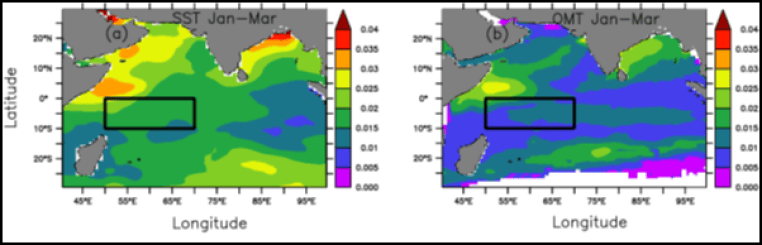
While efforts are underway to improve the understanding of the physics of the problem of monsoon rainfall prediction, it is worthwhile to look again at the efficiency of the input parameters presently used in models and to look for new approaches. Sea surface temperature (SST) is one such parameter that needs to be reconsidered for predicting the Indian summer monsoon rainfall (ISMR). SST is routinely used for predicting the weather phenomena such as monsoons or cyclones, while it is well established that the thermal energy required for atmospheric phenomena comes from the upper ocean, not from the thin layer of the ocean sometimes reflected in SST alone. SST is restricted to a few millimeters of the top ocean layer, particularly when it is estimated from the satellites and is largely influenced by strong winds, evaporation, or thick clouds. Hence, it does not reflect the thermal energy available in the upper ocean. Rapid (of the order of a day to a month) heating (such as strong solar heating) and cooling (such as more evaporation due to strong winds and/or clouds) events can quickly erase the thermal signature of subsurface warm or cold features (Pickard and Emery 1990), leading to SST misrepresenting the ocean thermal energy. In contrast, ocean mean temperature (OMT), which is measured up to a depth of 26o C isotherm or up to a fixed depth, is more stable and consistent, the spatial spread of which is also less compared to SST. This is even evident from the average coefficient of variation, defined as the relative magnitude of the standard deviation to the average (1993–2017) value (Figure 2) for monthly SST (0.02) being double that for OMT (0.01) for the North Indian Ocean.
Figure 2: Coefficient of variation of SST (a) and OMT (b) during 1993–2017. The rectangle represents the south Indian ocean area that has a major influence in ISMR. (courtesy: Venugopal et al. 2017).
The application of ocean thermal energy for cyclone studies was already demonstrated through several studies. For example, Mao et al. 2000 reported that the rate of intensification and final intensity of cyclones are sensitive to the initial spatial distribution of the mixed layer, a proxy for ocean thermal energy, rather than to SST alone. Similarly, Shay et al. (2000), Ali et al. (2007), Mainelli et al. (2008), Ali et al. (2013) and Lin et al. (2013) and Jaimes and Shay, (2015) demonstrated/suggested the importance of ocean thermal energy for cyclone studies.
Similarly, the role of the heat energy available in the sub-surface ocean layers in El Nino studies was confirmed by Smith et al. (1995), Ji et al. (1997) and Latif et al. (1998). They proved that even the El Niño forecast models could be improved by initializing the models with the observed ocean heat content (OHC). OHC is the amount of thermal energy available in the oceans from surface to a fixed depth, say, 100m or 200m given by equation (1).
where ρ is the density of the sea water, Cp is the specific heat capacity of the seawater at constant pressure, p; h1 the top depth, h2 the bottom depth, dz the thickness of the layer and T is the average temperature of the layer in oC. Although in situ temperature profiles are required to estimate this parameter, it can be indirectly inferred from the satellite-derived sea surface height anomaly (SSHA) and SST.
Based on this concept, Venugopal et al. (2018) analysed 25 years of OMT (ocean mean temperature) of the north Indian Ocean (NIO) from 1993 to 2017 spanning 30°S to 30°N and 40°E to 100°E, with a grid spacing of 0.25° × 0.25°. They computed OMT from the Tropical Cyclone Heat Potential (TCHP) and the depth of 260 C (D26) obtained from the National Oceanic and Atmospheric Administration, Atlantic Oceanographic and Meteorological Laboratory (ftp.aoml.noaa.gov). The 26 degree C isotherm is seen at depths varying from 50–100 meters. During January–March, the mean 26 degree C isotherm depth in the Southwestern Equatorial Indian Ocean (SEIO), the rectangular area shown in figure 2 is 59 meters. The researchers analysed 25-year OMT data from 1993 to 2017. They found that unlike SST, OMT of SEIO was able to correctly predict 20 out of 25 years (80% success rate) whether the amount of rainfall during the summer monsoon was more or less than the long-term mean, 887.5 mm. The prediction based solely on sea surface temperature was correct only for 15 out of 25 years (with a 60% success rate). Using this approach the monsoon was predicted to be more than the average during 2018-2022 with an 80% success rate.
In addition to better predictive score, the information on whether the amount of monsoon rainfall will be more or less than the long-term mean will be available by the beginning of April, two months before the southwest monsoon sets in. This is because OMT is analysed by measuring the ocean thermal energy during the period from January to March and the southwest monsoon sets in around June 1 each year in Kerala .
Out of the 10 years of observed rainfall, there are 6 below average and 4 above average rainfall years during 2013-2022 (Figure 3). The all-India monsoon rainfall in 2014, 2015, 2016, 2017, 2018, and 2021 was below average during June–September but above average in 2013, 2019, 2020, and 2022. Except in 2016, all the years were predicted correctly using OMT estimated during January-March. Venugopal et al. (2018) claimed an accuracy of 80% for their 25 years study. Since the predictions during 2018-2022 were also correct, the success rate has now increased from 80% to 83.3%.
With this success rate, our prediction for the all-India June-September 2023 is that total rainfall is likely to be less than 887.5 mm. We have to wait and watch what happens!
# # # # #
List of references:
Ali, M. M., P. S. V. Jagadeesh and S. Jain, Effects of eddies on Bay of Bengal cyclone intensity. Eos, Transactions American Geophysical Union 88(8): 93–95 (2007).
Ali, M. M., T. Kashyap and P. V. Nagamani, Use of sea surface temperature for cyclone intensity prediction needs a Relook. Eos, Transactions American Geophysical Union 94, 177–178 (2013).
Jaimes, B. and L.K. Shay, Enhanced wind-driven downwelling flow in warm oceanic eddy features during the intensification of tropical cyclone Isaac (2012): Observations and theory. J. Phys. Oceanogr. 45, 1667–1689. https://doi.org/10.1175/JPO-D-14-0176.1 (2015).
Ji, M. and A. Leetmaa, Impact of data assimilation on ocean initialization and El Nino prediction. Monthly Weather Review 125(5), 742–753 (1997).
Latif, M., D. Anderson, T. Barnett, M. Cane, R. Kleeman and A. Leetmaa, E. Schneider, A review of the predictability and prediction of ENSO. Journal of Geophysical Research: Oceans 103(C7), 14375–14393 (1998).
Lin, I. I., G. J. Goni, J. A. Knaff, C. Forbes and M. M. Ali, Ocean heat content for tropical cyclone intensity forecasting and its impact on storm surge. Natural Hazards 66(3), 1481–1500 (2013).
Mainelli, M., M. DeMaria, L. K. Shay and G. J. Goni, Application of oceanic heat content estimation to operational forecasting of recent Atlantic category 5 hurricanes. Weather and Forecasting 23(1), 3–16 (2008).
Mao, Q., S. W. Chang and R. L. Pfeffer, Influence of large- scale initial oceanic mixed layer depth on tropical cyclones, Mon. Weather Rev. 128, 4058–4070 (2000).
Pickard, G. L. and W. J. Emery, Descriptive physical oceanography: An introduction. Elsevier (1990).
Shay, L. K., G. J. Goni and P. G. Black, Effects of a warm oceanic feature on Hurricane Opal, Mon.Weather Rev. 128, 1366–1383 (2000).
Smith, T. M., A. G. Barnston, M. Ji and M. Chelliah, The impact of Pacific Ocean subsurface data on operational prediction of tropical Pacific SST at the NCEP. Weather and forecasting 10(4), 708–714 (1995).



You must be logged in to post a comment.