Global warming, climate change, all these things are just a dream come true for politicians. I deal with evidence and not with frightening computer models because the seeker after truth does not put his faith in any consensus. The road to the truth is long and hard, but this is the road we must follow. People who describe the unprecedented comfort and ease of modern life as a climate disaster, in my opinion have no idea what a real problem is.
As a physician-scientist (and pediatrician), I wish to interject some scientific facts into the ongoing politically-charged “global warming/climate change” topic.
As a physician-scientist (and pediatrician), I wish to interject some scientific facts into the ongoing politically-charged “global warming/climate change” topic.
First, the United Nation (UN)’s Intergovernmental Panel on Climate Change (IPCC) recently shocked the global warming community by very discreetly announcing a retraction (27 October 2022) that “their computer-modeling estimates were wrong.”
They see “no ‘climate emergency’ between now and the end of the century.” On the basis of recent science, the UN has halved its prediction of global temperature increases by the year 2100 [1] to only about 2.5°C!
They report that global temperatures over the next 80 years are expected to rise at around the same negligible average pace as the last 80 years — about “0.017 °C per year.”
This estimate is essentially no different from the “0.13 °C per decade” satellite measurements since 1979 [2] reported monthly by Roy W Spencer (meteorologist at University of Alabama in Huntsville).
Therefore, there should no longer be any conflict between the “global warming” alarmists and the non-alarmists! There is no climate emergency!
Second, the ridiculous myth that atmospheric carbon dioxide (CO2) is responsible for global warming cannot be true. As any grade-school science student will tell you, “Plants require CO2 and expel oxygen (O2). Animals and fungi take up O2 and give off CO2. CO2 is necessary for the Cycle of Life on Earth!”
CO2 is a colorless odorless gas, comprising 0.041% by volume in our atmosphere; CO2 is not a pollutant. During the past 800,000 years of ice-core data, there is no consistent correlation between global warming and global-cooling cycles and global atmospheric CO2 levels.
Global atmospheric CO2 was estimated to be ~280 parts-per-million (ppm) before the industrial revolution and has risen to ~420 ppm today. Earth has warmed ~0.13 °C per decade since the end of the Little Ice Age (1300-1850 AD). After each of Earth’s cooling periods, there has always been a warming period — as we have today.
Few people seem to realize that CO2 levels in our lungs reach 40,000-50,000 ppm, which induces us to take our next breath. Each human exhales about 2.3 pounds of CO2 on an average day. (A person engaged in vigorous exercise can produce up to eight times greater CO2.)
Given ~16 respirations per minute for each of the 8 billion people on Earth, this means ~16 billion pounds of CO2 per day produced by all humans. Multiply that by 40 equals ~640 billion pounds of CO2 per day — which approximates the overall CO2 excreted by the total animal and fungal biomass on the planet.
Overall emissions from world-wide industry per day in 2020 were estimated to be ~16 million metric tons of CO2 equivalent. If one metric ton = 2200 lb, then “total industrial emissions” = 35.2 x 109 = 35,200,000,000 (~35.2 billion pounds of CO2 per day). This means that the entire animal and fungal biomass per day puts out more than 18 times as much as all current industrial emissions!
If global atmospheric CO2 was ~280 ppm in 1750, and it’s ~420 ppm today, what is the source of this ~140 ppm increase? Various scientists have estimated that human-associated industrial emissions have contributed perhaps 100 ppm — with “natural causes” accounting for the remaining ~40 ppm of the total increase of ~140 ppm between 1750 and today. Increases in atmospheric CO2 levels have helped “green” the Earth and enhanced crop production substantially.
Lastly, a comment on “eco-anxiety disorder” — commonly seen in pediatrics more than in adult patients. This condition is caused by social media and mainstream media untruthfully predicting the “end of the world as we know it,” due to increasing global temperatures.
This panic can cause increased anxiety, depression, post-traumatic stress disorder, lower birth rates, higher rates of suicide, substance abuse, social disruptions including increased violence, and a distressing sense of loss.
In my opinion, this is a serious form of child abuse. Given the recent confession by UN’s IPCC that no climate emergency is foreseen, and the fact that CO2 is unequivocally not responsible for any of this, alarmists should responsibly admit their mistaken claims — to everyone. And let’s move on, cheerfully, together, realizing we’re now all on the same page!
Dr. Nebert is professor emeritus in the Department of Environmental & Public Health Sciences at University of Cincinnati College of Medicine, and in the Department of Pediatrics & Molecular Developmental Biology (Division of Human Genetics), at Cincinnati Children’s Hospital.
It is published by the East Riding of Yorkshire Council.
According to researcher Brian Williams, the coastline has retreated by about two to three miles since Roman times.which equates to about 1.5m a year.
The East Riding Council publication notes that the recent rate of erosion is similar.
Brian Williams’ website is well worth a look, with a lot more detail and plenty of links to maps and a book by Thomas Sheppard written in 1912 called “The Lost Towns of the Yorkshire Coast”. His website is:
A major winter storm, with winds gusting up to near hurricane strength is moving towards northern California. Dubbed a “bomb cyclone” due to rapid central pressure drop, it more than qualifies for the 24 millibars (mb) in 24 hours “bomb” cyclone designation.
Satellite view of the Northern Hemisphere over the Pacific Ocean show the “bomb cyclone” off the California coast at 11:30AM PST. Credit: NOAA-NESDIS GOES-18 Satellite GeoColor Composite
A major winter storm, with winds gusting up to near hurricane strength is moving towards northern California. Dubbed a “bomb cyclone” due to rapid central pressure drop, it more than qualifies for the 24 millibars (mb) in 24 hours “bomb” cyclone designation.
As of 11AM Wednesday Jan 4th, the central pressure of the storm as it was just off the California coast was 28.33 inches (959.36 millibars) as seen in the graphic below. That pressure is lower than the centrral pressure of many hurricanes.
Image from Windy.com
The National Weather Service (NWS) has produced forecasts for areas of likely flooding that covers much of the Sacramento Valley and the north coast.
Because this winter storm is relatively warm, snow levels are averaging higher, causing rain to fall on snow-laden areas, creating snow-melt which will overwhelm already waterlogged soil, making for fast runoff into creeks and rivers.
Heavy snow expected. Total snow accumulations of 4 to 10 inches, except 6 to 18 inches west of Highway 395. Lowest valleys below 4000-4500 feet elevation are only expected to see up to 3 inches of snow.
…
Snow levels will start off below 4000 feet before briefly increasing to 5000-6000 feet Wednesday afternoon. Snow levels will then fall again to 4500-5000 feet Thursday. This storm will come in 2 parts, and areas east of Highway 395 may see a brief break Wednesday evening.
For the areas Near lake Tahoe, the NWS advises the situation is even worse:
Heavy snow expected. Total snow accumulations of 8 to 14 inches, except 1 to 2 feet above 7000 feet. Localized amounts up to 3 feet are expected for the Sierra crest. Winds gusting as high as 100 mph over Sierra ridgelines with gusts up to 40 mph in the Tahoe Basin.
In addition, widespread damaging winds are forecast from this winter storm.
Image: NWS Sacramento
Winds on the valley floor are expected to gust as high as 60 mph, with higher elevations seeing stronger wind gusts.
Dr. Ryan Maue had this to say on Twitter:
📈Circulation of massive Super #BombCyclone pulls Siberian/Arctic air behind the cold front.
Ahead of storm center is a vigorous atmospheric river 🌧 leading to floods
I have now formally complained to the BBC about this article.
Here is my complaint:
The report states”But punishing weather conditions linked to climate change have eroded so much of the village’s soft sandy rock that her house is now the last one before the cliff edge. “
In fact coastal erosion has been taking place in Happisburgh for thousands of years. There are well established historical links for this fact, for instance:
The recent increase in erosion is due to fact that sea defences built in the 1950s, which worked well, have lately fallen into disrepair.
Your claim of “punishing weather conditions” also does not stand up to scrutiny. The Met Office have recently said that “There’s no evidence of a trend in storminess because of climate change [in the UK]”:
About half of the sea level rise along the Norfolk coast, about 1mm a year, is caused by the land sinking, something which has been occurring since the Ice Age:
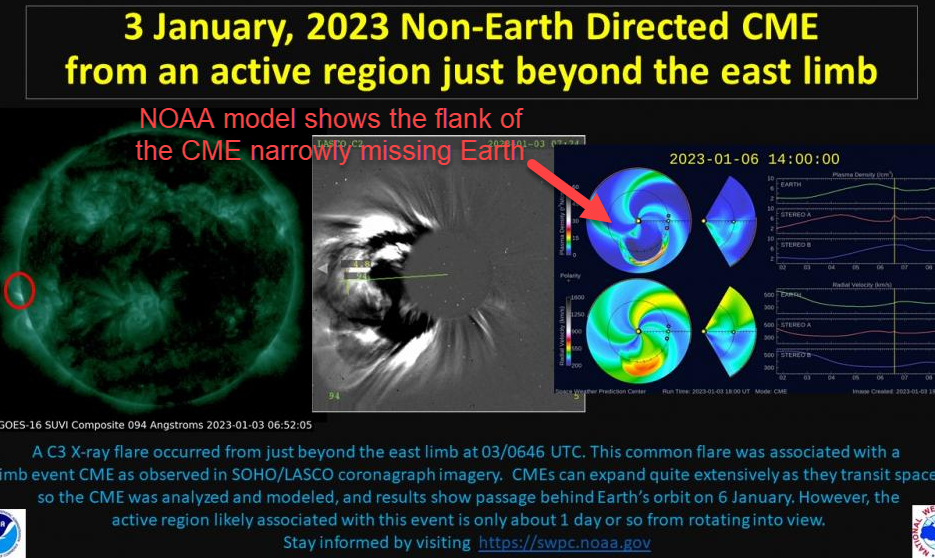
Something just exploded on the farside of the sun. SOHO watched the debris–a very bright and fast CME–billow away from the sun’s southeastern limb on Jan. 3rd
Something just exploded on the farside of the sun. SOHO watched the debris–a very bright and fast CME–billow away from the sun’s southeastern limb on Jan. 3rd:
It won’t hit Earth. NOAA analysts have modeled the CME and determined that the edge of the storm cloud will narrowly miss our planet a few days from now.
NASA’s Solar Dynamics Observatory detected shock waves from the blast wrapping around both of the sun’s poles. This suggests a very powerful explosion–possibly an X-flare. Radiation from the flare was eclipsed by the edge of the sun, reducing its intensity by one to two orders of magnitude, so that Earth-orbiting satellites detected only a C4-class event.
Whatever exploded will soon turn to face Earth. Helioseismic echoes pinpoint its location no more than 2 days behind the sun’s eastern limb:
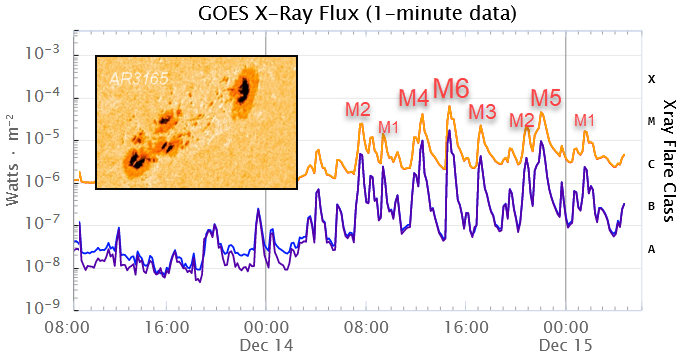
This might be old sunspot AR3163, which spent the last two weeks transiting the farside of the sun. It was big the last time we saw it in December and may have grown even bigger since. Stay tuned! Solar flare alerts:SMS Text.
Why is all of this bad for Milberg Coleman? Because their RICO tactic doesn’t point to anything done by ‘Big Coal & Oil’ and skeptic climate scientists, it instead points an arrow the size of Texas at one of the core promulgators of the “crooked skeptic scientists” accusation.
Bad enough that this lawsuit filing from the Milberg Coleman Bryson Phillips Grossman LLC law firm has a no-win appearance of being either a mismanaged effort guided by the Sher Edling law firm without any disclosure of that partnership, or it appears to be a spectacularly inept and possibly unethical plagiarizing of the accusation content and other bits from the 16 boilerplate copy Sher Edling lawsuits. I detailed all of that in my Part 1 blog post (handily reproduced at WUWT, enabling me to reach a wider reading audience).
Why is all of this bad for Milberg Coleman? Because their RICO tactic doesn’t point to anything done by ‘Big Coal & Oil’ and skeptic climate scientists, it instead points an arrow the size of Texas at one of the core promulgators of the “crooked skeptic scientists” accusation.
Meaning Naomi Oreskes. She’s not just some person who invented the anti-science idea of a “100% scientific consensus” for catastrophic anthropogenic global warming (CAGW), who penned a book essentially claiming skeptic climate scientists’ CAGW denial stemmed from their political beliefs (no joke!), who now claims she has a mountain of evidence that “Exxon Knew” their products caused harm from CAGW but ran disinformation campaigns to hide what they knew (Exxon knew no such thing, but that’s a whole other story).
Meanwhile, what’s does the arrow the size of Texas in this Milberg Puerto Rico filing also inadvertently point to? When you take into consideration that “psychological projection” is a hallmark of far-left liberals, it’s no surprise: Naomi Oreskes’ 2012 La Jolla, California “Establishing Accountability for Climate Change Damages: Lessons from Tobacco Control” workshop. It was a brainstorming effort she created on how the RICO statute could be used against Big Oil’s ‘tobacco industry-like disinformation efforts.’ But remember who it is – and which side of the CAGW it is – who has an apparent stranglehold on disinformation.
Now – speaking of unified disinformation efforts – who were the participants at Oreskes’ La Jolla brainstorming session on how to wage a lawsuit war against Big Oil?
Stanton Glantz, who had document scans about ye olde “reposition global warming memos” at his Legacy Tobacco Documents Library that had literally nothing to do with the tobacco industry. I covered how his Library began to stray from its well-intended singular purpose into the political arena of global warming in a pair of blog posts here and here, and noted in a more recent post how his now disingenuously-named “Industry Documents Library” works with Kert Davies, the problematic fellow I mentioned multiple times in my Part 1 post.
Sharon Eubanks, whose Prepared Written Testimony ‘evidence’ section submitted to a House Oversight Committee regarding the “Fossil Fuel Industry Funds a Deception Campaign is enslaved to ye olde “reposition global warming memos.”
Union of Concerned Scientists (UCS) president Peter Frumhoff, whose organization’s “Deception Dossiers” report is enslaved to ye olde “reposition global warming memos” as evidence of ‘Big Coal’s deception efforts.’
UCS’ Seth Schulman, lead author of the above-noted UCS “Deception Dossiers” report — the one thanking Kert Davies redundantly for his review input.
What’s one of the items Oreskes herself brought up at that 2012 workshop as a tactic to use in a RICO-style lawsuit against energy companies?
Those old newspaper ads she asserts were part of a fraudulent energy company-led ‘disinformation campaign.’
See the pattern here? A collection of people enslaved to a particular narrative about a worthless set of ‘leaked industry memos’ in their claims that the fossil fuel industry and skeptic climate scientists engaged in organized crime activity – racketeering – to enrich themselves while fraudulently telling the public there was no harm from fossil fuels causing catastrophic global warming.
What’s the basic definition of racketeering? Organized criminal activity in which the perpetrators offer a service to solve a nonexistent problem, or offer a service that solves a problem that would not exist without the racket.
Essentially, the racketeering accusation the Gore-Oreskes-Gelbspan mob hurl could be mirror flipped against them: the ‘service’ they offer to solve the ‘man-caused global warming’ problem is to expose the ‘Big Oil / skeptic climate scientists racket,’ forcing civil penalty settlements out of the colluders. The problem, according to skeptic scientists’ hugely detailed climate assessments, is that the Gore-Oreskes-Gelbspan mob cannot prove ‘man-caused global warming’ is actually a problem. But far worse, defamation is a crime. Any cash this mob receives from the accusation – book sales, for example – might be considered a form of fraud. It might be further argued that by saying “Exxon Knew” as far back as the 1960s that burning fossil fuels cause global warming because the “government knew” might also be a form of fraud because neither the government nor Exxon could have known any such thing since concern about global cooling was all the rage back then. Cooling!
…. Patrick Michaels, Robert Balling and Sherwood B. Idso all lent their names in 1991 to its scientific advisory panel.
The Coal Defendants’ publicity plan called for placing these three scientists, along with fellow climate change denier S. Fred Singer (see below), in broadcast appearances, op-ed pages, and newspaper interviews by its public relations firm.
Fred Singer’s name does not appear in any form within either the UCS Dossiers Report or the NYT article. Where does the above appear, almost identically, just without the lawsuit’s “The Coal Defendants’” and “(see below)“wording?
Wikipedia.
What do the #s 1 and 2 footnotes cite for their accusation about Dr Singer’s alleged involvement with the ICE PR campaign?
The #2 footnote goes to “pages 688-693” of Sheldon Brampton’s 2001 “Trust Us, We’re Experts!” book (the actual page numbers for their chapter is 267 through 288), where it does indeed have that accusation regarding Dr Singer. What’s Rampton’s source for that? A June 24, 1991 article in The Energy Daily by Mary O’Driscoll titled “Greenhouse Ads Target ‘Low-income’ Women, ‘Less-educated’ Men” of which I have not yet located a copy. If the actual article contains no evidence proving Dr Singer was involved in that campaign, Rampton could be in a spot of trouble, couldn’t he? (By the way, he’s that Sheldon Rampton who I’ve tagged as being only one degree separated from Ross Gelbspan in several posts at GelbspanFiles, including one detailing how Rampton worked at Wikipedia as an editor). What else is seen on that Rampton book page? Oh, yeah, the never-used ICE ad I mentioned in my Puerto Rico Part 1 dissection which Naomi Oreskes somehow had in her lousy scan photocopies collection. (Rampton’s book predates Oreskes’ earliest known public arrival to the climate issue by two years.)
But what’s Wikipedia’s #1 source about Dr Singer’s alleged involvement with the ICE PR campaign? ………. Wait for it ………………. Naomi Oreskes.
The bigger – and basically fatal – problem for the Milberg Coleman law firm is ….. Dr Singer never had any involvement of any kind with the Western Fuels ICE PR campaign. I had to remind him on one occasion regarding what the ICE campaign was, that’s just how un-associated he was with it.
The most basic of questions arises out of just this one example when this Milberg Puerto Rico filing ineptly cites Wikipedia – which cites one source cascading back further to an unavailable article, while citing another problematic source in its own right which doesn’t actually prove a particular accusation: Are the attorneys or staffer interns at the law firm so incompetent that this instant is no more than a clumsy effort arising from leftist-blinded enviro-political ideology? Or was it fed to them as part of a much larger – albeit maladroit – fraudulent effort that aims to be rewarded by mega-dollar settlements for their initial brainstorming and subsequent contributions into these kinds of lawsuits?
Maladroit. Bungling. That wasn’t the only unsupportable accusation in this filing aimed at Dr Singer and his Science and Environmental Policy Project organization. On PDF file/print page 126 it says, with regard to the meeting that ultimately resulted in a summary leaked to enviro-activists which are now known as the notorious API “victory will be achieved” memos (this filing labels it the “Global Climate Science Communication Team Action Plan {GCSCT Action Plan} ):
The GCSCT Action Plan named the following members as having contributed to the development:
… Candace Crandall, Science and Environmental Policy Project
…. Candace Crandall was the wife of S. Fred Singer …
She was indeed his wife; but as is clearly seen to this day at the bottom of the NYT 1998 article specifically about the API memos (which ironically never assigned any name to the memos at all or quotes the infamous “victory will be achieved” phrase), neither Ms Crandall nor Dr Singer or his SEPP organization was involved with the little 1-day workshop surrounding the API “victory” memos.
You don’t have to be a rocket scientist to find these details.
For the readers who remembered to hold the thought I suggested in Part 1 about this Milberg law firm retyping those “victory will be achieved” memos “for clarity,” consider now who it was that originally had those practically unreadable scan copies in the first place.
More than any prior “#ExxonKnew” lawsuit filing, this Milberg Puerto Rico one is practically in love with the API “victory will be achieved” memos, referring to it no less than 66 times in it and outside of it:
Melissa Sims, one of the attorneys at Milberg Coleman Bryson Phillips Grossman LLC, the law firm representing the Puerto Rico communities, said fossil fuel defendants’ actions were not only similar but directly tied to the tobacco companies, … “The racketeers solicited the same scientists who denied the link between second hand smoke and lung cancer,” Sims told me.
In an internal industry document known as the 1998 Victory Memo, part of a master strategy of deceit assembled by the American Petroleum Institute and cited throughout the complaint, the defendants’ intent was summarized: “Victory will be achieved when average citizens understand uncertainties in climate science.”
“This memo was a multi-faceted approach intended to dupe consumers into believing there was no such thing as climate change and that their products wouldn’t cause the disastrous effects we’re seeing today,” Sims said.
This never-implemented memo set could not, by default, be any sort of ‘multi-faceted master strategy.’ There’s simply no “there” there, as I’ve illustrated more than once using a mirror-flip of them that Greenpeace, Al Gore, Greta Thunberg, and the whole rest of the pro-global warming crowd would love. There was nothing sinister in the memos, and as former API Executive VP / COO William O’Keefe told me in my interview of him, the whole point of the meeting on how to counter the Kyoto Protocol Treaty became academic when everyone realized the U.S. Senate would never sign the treaty.
This Milberg Puerto Rico filing is also in love with castigating the late Dr S Fred Singer. His name is mentioned 40 times, including unsupportable ‘tobacco industry angle’ accusations — plural! — against him that the Milberg attorney just above alludes to. The first of the two ‘tobacco angle’ accusations in this filing cites a New York Timesobituary for Frederick Seitz which contains zero mention of Dr Singer, and the second one cites a Scientific American article hurling the ‘cancer denier’ accusation with zero evidence to support it. As I detailed here, Dr Singer abhorred cigarette smoke, and his sole complaint was how E.P.A had mislabeled second-hand smoke as a Class A carcinogen.
When it comes to unsupportable political assertions and accusations, the above problems and what I covered in Part 1 are just the tip of the proverbial iceberg. A Part 3 continuation on the indisputable accusation errors in this filing would also be very lengthy. Without covering any of the filing’s science assertions.
I’ll end technically where I started in this post, about where the real ‘RICO-teering’ effort appears to be in the global warming political issue, but with this additional note: Naomi Oreskes’ 2012 effort wasn’t a one time event, it appears to be an ongoing thing as reported at the end of this 12/29 Energy in Depth report, where they mention a similar brainstorming 2-day conference led by Oreskes in September 2022. A less than transparent conference, where we have just an audio interview of Oreskes done by Amy Westervelt (yeah, that Westervelt, who made a false statement about the “victory will be achieved” memos, an inexplicable blunder I further detailed here). At the 3:58 point of that audio file, just seconds before Westervelt’s interview, Oreskes introduces Westervelt as “my good friend and colleague,” and then proceeds from the 5:50 point to the 7:20 point to spew essentially outright psychological projection accusations against the people she says spew ‘deception and disinformation,’ while naming fellow colleagues who supposedly expose ‘industry disinformation.’ Oreskes practically hands out a verbal roadmap to investigate where the real racketeering may be in the climate issue.
At her other 12/6/22 audio podcast report “First Climate RICO Filed,” Westervelt says the following, 2:05 point / 2:23 point:
… The plaintiffs in this case are 16 in the Commonwealth of Puerto Rico …
… I started following this case three years ago, and went to Puerto Rico in 2019 with Melissa K. Sims. Sims is senor council for the plaintiffs law firm Milberg …
Interesting, isn’t it, that just over seven weeks after this Sept 2022 semi-transparent conference was held, that we all were blessed with an error-riddled, “reposition global warming” / “victory will be achieved”-enslaved “Puerto Rico v Exxon lawsuit filing that looks like it was giddily slapped together by a team of the ‘usual suspects’ [*ahem*] usual suspects, and their associated vulnerable weak link comrades.
Academic research that promotes improvements to the power greed needs to be evaluated carefully with the understanding that the grid is a complex system full of interactions. Changes to the grid involve numerous hurdles.
The media, individuals, and policy makers are prone to serious misunderstanding of studies, reports and pronouncements coming from academic experts. It is important to carefully read and interpret academic publications to understand what has been studied and what is being claimed.
Far too many dismiss the many wide-ranging formidable challenges inherent in green energy efforts due to their misreading and misunderstanding of academic publications.
This brings to top of mind a “joke” I once heard at a seminar for new power engineers. A Professor of Electrical Engineering was expounding on the differences between engineers and scientists. He explained:
Both engineers and scientists want to understand the world and both want to solve problems. Engineers worry about how much something costs. Scientists don’t worry about the cost; they just want the truth. So, the difference between an engineer and a scientist is that an engineer at least has some common sense.
There’s been a lot of discussion about the differences between scientists and engineers.
The boundaries can get blurry and often are non-existent. In the energy power system arena, perhaps to my past professor’s chagrin, I’m afraid the more important boundary might be between academics and practicing engineers.
Academics can approach the grid with some detachment while practicing engineers must keep it running 24/7/365. Practicing engineers have skin in the game and typically face consequences for errors and shortcomings, while academics and unfortunately many policy makers are more insulated.
This brings to mind Thomas Sowell’s guidance, “It is hard to imagine a more stupid or more dangerous way of making decisions than by putting those decisions in the hands of people who pay no price for being wrong.”
As I like to say, the electric grid is the largest, most wonderful, most complex machine ever. Meeting the electric needs of our nation depends on many specialists and experts in far ranging efforts including generation, transmission, distribution, maintenance, and operations as well as within the many subfields encompassing these broad areas.
The grid must operate seamlessly across a variety of conditions without pause. Recognizing the difference between what theory suggests and practical knowledge demonstrates is critical.
Academics have the luxury of focusing on one or a limited number of problems at a time. The traditional scientific method of hypothesis testing through experimentation is better suited to studies involving limited numbers of variables.
Wicked complex systems full of all sorts of inconvenient interactions and feedback tend not to always work as might be suggested by theory from experimentations. As described in this posting, Balance and the Grid, focusing on just one problem can in the end cause net harm, and in many cases, the feedback can make the outcome of the problem attacked worse.
I will leave it to readers to ponder recent events and see if they can come up with an example where experts focused too narrowly on a single problem and developed solutions which were later shown to have serious repercussions.
The grid and power supply arrangements are an extremely complex system. The interplay and interactions among the components are extensive and complicated.
Change a puzzle piece and the entire puzzle changes. Actions taken to address one problem will typically create new problems and also aggravate other problems.
The negative effects of such system “fixes” may or may not be visible for some time. It’s a rare academic who can successfully grapple with the great complexities of the power system. Specialization is an easier approach. While findings from academics and specialists can have great value, their findings should not be taken to extremes.
The typical course for successful “revolutionary” ideas is that after some struggles to implement working applications they eventually make a modest improvement within some niche of the industry.
Many read academic papers and jump past all the hard work of assessment to the conclusion that whatever is proposed can be done in the near term on widespread level with great benefit. Initial promise is a necessary step but nowhere near a sufficient indicator of eventual success.
But mis- readings of studies often lead to such conclusions.
Consider what happens at the simplest level. An academic will look at a particular energy resource, or set of resources, and calculate how much power could they could theoretically provide.
Comparing this capability to actual needs, it might be stated that this resource could provide X% (all) of an area’s power need.
Although the actual “study” did not look at many of the major items of importance, such as timing of the energy relative to load needs, let alone issues around transmission or distribution of the energy, the paper may be quoted and cited as evidence that this substitution can be done.
Just because a resource can produce enough megawatt hours of energy to replace another “less desirable” resource, does not mean it can be substituted as part of the power system. But the media and others may include that paper as evidence that renewable can replace conventional technology.
It is understandable that not everything can be studied at the same time. Also, there is always the possibility of raising near infinite objections as to what was not considered. That certainly is a ditch on the other side of the road that we could fall in.
But the ditch of concern here is failing to consider the most basic fundamentals around energy provision. Before any large generating resource can be connected to the grid, detailed interconnections studies must be performed to make sure that single resource works adequately with the system.
Assuming that the widespread adoption and integration of many new generating resources can easily be accomplished is naïve. One needs to remain skeptical and questioning around proposals for major change until a myriad of basic requirements of the power supply system have been given due consideration.
Many readers here may have noted the numerous times over the years when I’ve discussed grid concerns, and a reader in the comments had directed me to some article in a prestigious journal from a highly credentialed academic.
I check out the articles and often they are quite good, but usually the article does not even address the concerns that I have raised. Readers will offer me as a rebuttal, some publication showing at some basic level how wind and solar resources may contribute to the grid.
Overwhelmingly the academic articles I read are good. Usually, the authors carefully describe the limitations of their findings and recommendations.
Sometimes they hint as to what remains to be worked out. I’m afraid this does not stop individuals, the media, and some policy makers from ignoring the qualifications and limitations inherent in their findings.
The situation is worse when they leave it to the reader to ferret out the limitations of their findings. In very rare instances some academics will go beyond what has been demonstrated with exaggerated claims. I don’t know if this is done through ignorance, accident, hubris or for purposes of self-advancement.
I am afraid, that unfortunately, overstating findings can lead to greater publicity and personal gain. There is not much to be gained personally from being a cynic; optimism is a better path for self-advancement.
Potential enhancements to the grid are usually sold with great fanfare. Those of you who have had an interest in energy and the grid should think back over the years to all the articles you have read which touted some major breakthrough which was going to be a game changer. Such game changers at best are very slow to arise, if ever, in the energy industry.
Thinking back a few decades, power electronics were becoming available in many applications that collectively were going to change the industry. Power electronics involve providing high voltage capability to semiconductor devices, combined with sophisticated computer controls.
The technology was proven and in use on high voltage DC lines. Theoretically other applications could solve a lot of problem making the grid smarter, correcting voltages and controlling and directing flows on transmission lines.
The research papers looked good.
While the touting of these technologies may have gone overboard, I did not read anything particularly dishonest or false.
The problem was that many read of the potential and did not see anything to suggest that this technology should not be adopted immediately on a widespread manner to improve the system. Many bright capable people read up on the potential and foresaw near term change and benefit.
My Board wanted a report on how we would be using this “new” capability. The devil was in the details, however. The challenges and costs associated with power electronic applications were more burdensome at that time than the problems they would solve in our area.
Years later I found it was worth tens of millions to install a large power electronic device called a Static Var Compensator (SVC) to have on standby to prevent a potential voltage collapse problem that had emerged on the grid.
Today power electronics play many important roles in the grid. They are a major part of what makes a grid “smart”. They enable asynchronous wind and solar generation to be converted to alternating current on the grid.
Power electronics support voltages and help keep the system stable in many ways in varying situations. But they did not take the industry by storm in a short time frame as envisioned by the early reports.
They were first employed in niches where they provided particular benefits. As experience was gained and improvements made, they grew to become more and more important. They key to adoption was that installations were built on successive successes. I suspect top-down mandates to broadly use such devices might have actually hindered development and adoption.
The path for innovation for the grid is most likely to follow the model of power electronics. Academics propose and refine an approach for the enhancement of the grid and/or power supply.
Detailed serious evaluations of the approach take place and maybe additional research is warranted. Engineers determine specific areas where the new approaches might be most successful and the approach can be employed or tested. Project successes will be followed by further improvements and refinements and led to greater expansion as warranted.
That model seems preferable to this one: Academics propose and refine an approach for the enhancement of the grid and/or power supply (or a complete transition of the grid).
The media and policy makers determine it is worthwhile. Policy makers and the public push for sweeping changes that are mandated. Everyone struggles to implement the new approach broadly in a sweeping near universal manner.
Conclusions
Language is often imprecise.
For instance, when readers see a statement stating “Solar and wind could attain penetration levels of X”.
What the statement really means is “Based on the factors I looked at and ignoring a vast number of critical requirements I have not looked at, solar and wind may be able to replace fossil resources at a level of X. But probably not.” Unfortunately, the statement is often interpreted as “Solar and wind can attain penetration levels of X with no significant concerns.”
Similarly, when a study quotes a cost, it should be understood that unless specified differently, the cost is for the specific problem at hand, invariably there will be many other costs added to implement this approach often dwarfing the provided number.
If a study quotes a figure in the billions to provide connections for infrastructure to connect distant wind and solar to load centers and/or allow for diversity, you can be fairly certain that additional improvements to the underlying systems will rival or exceed the reported cost.
For those without a strong technical background, it’s hard sometimes to tell what is meant by various terms. There are many definitions of capacity factor.
The difference between power and energy is critical though not always grasped. It’s understandable that individuals might be confused by academic studies and articles concerning the grid.
Media reporters should do better. The results may be tragic when exaggerated and misunderstood findings influence policy makers and impact policy.
Look for a follow up piece titled, Academics and the Grid: Part 2 Are they Studying the Right Things? It will provide additional context and support for the central ideas here.
Thanks to Roger Caiazza for review and helpful comments
Postscript: I decided to write on this topic when somebody sent me this link as evidence that wind and solar could “easily” be made reliable. Perhaps some of the readers may be interested in discussing in the comment some hurdles not brought out in the article. Similarly, it looks like some of the optimism as to near term Fusion might need some tempering as well.
The U.S. depends on China for more than half of the minerals and metals deemed critically important for our nation’s economic health and military readiness. While China has made mineral production and processing a strategic priority, the U.S. has done the reverse.
The U.S. depends on China for more than half of the minerals and metals deemed critically important for our nation’s economic health and military readiness. While China has made mineral production and processing a strategic priority, the U.S. has done the reverse. Mining in the U.S. has been pushed to the margins.
As recently as the 1990s, the U.S. was the world’s largest producer of rare earth minerals. Today we have just one rare earth mine remaining and the U.S. must ship its ore to China for processing. Demand for rare earths is massive and growing. The Massachusetts Institute of Technology says a wind turbine rated at 3.5 megawatts of electricity contains 1,300 pounds of rare earths.
There is just one lithium mine left in the U.S., one for nickel, one for cobalt, one for manganese. These raw materials are vital to the manufacture of batteries used in electric vehicles and the transmission of solar and wind power on the nation’s electricity grid.
The problem isn’t a lack of mineral resources in the U.S. The National Mining Association says the U.S. is home to $6.2 trillion worth of mineral reserves.
Our country is 100-percent import-dependent on 18 minerals and metals considered “critical” by the defense or interior departments. And we are at least 50 percent reliant on many more minerals and metals. The reality is we rely on China, Russia, Afghanistan and other adversaries for two-thirds of the minerals and metals we import.
Make no mistake, the magnitude of America’s import dependency is as immense as it is ominous. Minerals and metals are the key to the entire clean energy transition from fossil fuels to renewable energy. With the production of more EVs and wind turbines and solar panels, competition between countries for scarce minerals and metals will become intense. The International Energy Agency says global demand for minerals and metals could grow as much as six-fold by 2040.
Let’s be clear: As the need for minerals grows, we could wake up to the formation of a minerals cartel similar to the one OPEC created to boost oil prices.
Despite the enormous stakes, nothing has been done to make America’s own minerals on public lands more accessible to mining companies. A complex permitting process is the problem, requiring companies to wait 10 years or more to get government approval to mine in public lands. This is shackling the transition to EVs and clean energy technologies with huge, growth-killing costs.
During negotiations over the climate bill, President Biden agreed to push for permitting reform that would cover a number of things, including mining, but proposed legislation is stalled in Congress. One problem is opposition from anti-mining environmentalists who claim that recycling is the answer. But recycling is five times more expensive than mining.
Missing is any awareness of the enormous quantities of minerals and metals that US manufacturers require. Without the creation of new mines, the minerals crisis is going to put the energy security in the U.S. at risk.
Despite the need for more domestic production, the Biden Administration is floating the idea of using government subsidies to open new mines overseas. Undersecretary of State Jose Fernandez told Axios the Administration is considering financing “around a dozen” mining projects around the world. The money would be provided by the U.S.
Export-Import Bank and the Development Finance Corporation, with possibly some funds distributed by the Mineral Security Partnership, a Biden Administration program that was created to leverage international relations to address U.S. mineral supply concerns. But paying for foreign mining would redirect emphasis on mineral production away from the U.S. and toward foreign countries.
We should stop pretending that domestic mining is unessential. The best way to keep the competition for minerals from erupting into a conflict with China is for the U.S. to do what has served it so well for over a century: to offer a viable alternative to imports based on increased domestic mining.
Congress should approve without delay a bill that would streamline the permitting process.
Danny Ervin is a Professor of Finance in the Perdue School of Business at Salisbury University.
We’ll say this for Paul Ehrlich —at least he’s consistent. In 1968 the Stanford biologist famously declared that “the battle to feed all humanity is over,” at a time when the Earth’s population was about 3.5 billion.
We’ll say this for Paul Ehrlich —at least he’s consistent. In 1968 the Stanford biologist famously declared that “the battle to feed all humanity is over,” at a time when the Earth’s population was about 3.5 billion.
Today we have a population of eight billion (better fed than ever), yet there was Mr. Ehrlich, on CBS’s “60 Minutes” Sunday night still predicting that “humanity is very busily sitting on a limb that we’re sawing off.” [emphasis, links added]
The CBS narrator acknowledged that the green revolution in agriculture disproved Mr. Ehrlich’s prediction of mass famine.
Mr. Ehrlich is 90 years old and looking spry. When he was born in 1932, life expectancy for an American baby was 61 years. For Americans who will be born in 2023, it’s 79.11 years.
One explanation is that much of what Mr. Ehrlich considers to be a population “crisis” is simply because people are living longer and much less likely to die as infants.
Another way of putting it is that Mr. Ehrlich is living proof that we are living through what his intellectual nemesis, Julian Simon, liked to call an “epidemic of life.” We’d say that’s a cause for celebration.
Importantly, the theory of human-caused global warming asserts that increasing CO2 in the atmosphere changes the baseline and causes systemic warming in our climate. On the contrary, all of the warming since 1947 was episodic, coming from three brief events associated with oceanic cycles.
The post below updates the UAH record of air temperatures over land and ocean. But as an overview consider how recent rapid cooling completely overcame the warming from the last 3 El Ninos (1998, 2010 and 2016). The UAH record shows that the effects of the last one were gone as of April 2021, again in November 2021, and in February and June 2022 Now at year end 2022, we have again global temp anomaly matching zero warming since 1995. (UAH baseline is now 1991-2020).
For reference I added an overlay of CO2 annual concentrations as measured at Mauna Loa. While temperatures fluctuated up and down ending flat, CO2 went up steadily by ~55 ppm, a 15% increase.
Furthermore, going back to previous warmings prior to the satellite record shows that the entire rise of 0.8C since 1947 is due to oceanic, not human activity.
The animation is an update of a previous analysis from Dr. Murry Salby. These graphs use Hadcrut4 and include the 2016 El Nino warming event. The exhibit shows since 1947 GMT warmed by 0.8 C, from 13.9 to 14.7, as estimated by Hadcrut4. This resulted from three natural warming events involving ocean cycles. The most recent rise 2013-16 lifted temperatures by 0.2C. Previously the 1997-98 El Nino produced a plateau increase of 0.4C. Before that, a rise from 1977-81 added 0.2C to start the warming since 1947.
Importantly, the theory of human-caused global warming asserts that increasing CO2 in the atmosphere changes the baseline and causes systemic warming in our climate. On the contrary, all of the warming since 1947 was episodic, coming from three brief events associated with oceanic cycles.
Update August 3, 2021
Chris Schoeneveld has produced a similar graph to the animation above, with a temperature series combining HadCRUT4 and UAH6. H/T WUWT
With apologies to Paul Revere, this post is on the lookout for cooler weather with an eye on both the Land and the Sea. While you will hear a lot about 2020-21 temperatures matching 2016 as the highest ever, that spin ignores how fast the cooling set in. The UAH data analyzed below shows that warming from the last El Nino was fully dissipated with chilly temperatures in all regions. May NH land and SH ocean showed temps matching March, reversing an upward blip in April, and then June was virtually the mean since 1995.
UAH has updated their tlt (temperatures in lower troposphere) dataset for December 2022. Posts on their reading of ocean air temps this month came ahead of updated records from HadSST4. I have previously posted on SSTs using HadSST4 Ocean Temps Dropping November 2022This month also has a separate graph of land air temps because the comparisons and contrasts are interesting as we contemplate possible cooling in coming months and years. Sometimes air temps over land diverge from ocean air changes. However, in December temps in all land and ocean regions dropped sharply.
Note: UAH has shifted their baseline from 1981-2010 to 1991-2020 beginning with January 2021. In the charts below, the trends and fluctuations remain the same but the anomaly values change with the baseline reference shift.
Presently sea surface temperatures (SST) are the best available indicator of heat content gained or lost from earth’s climate system. Enthalpy is the thermodynamic term for total heat content in a system, and humidity differences in air parcels affect enthalpy. Measuring water temperature directly avoids distorted impressions from air measurements. In addition, ocean covers 71% of the planet surface and thus dominates surface temperature estimates. Eventually we will likely have reliable means of recording water temperatures at depth.
Recently, Dr. Ole Humlum reported from his research that air temperatures lag 2-3 months behind changes in SST. Thus the cooling oceans now portend cooling land air temperatures to follow. He also observed that changes in CO2 atmospheric concentrations lag behind SST by 11-12 months. This latter point is addressed in a previous post Who to Blame for Rising CO2?
After a change in priorities, updates are now exclusive to HadSST4. For comparison we can also look at lower troposphere temperatures (TLT) from UAHv6 which are now posted for September. The temperature record is derived from microwave sounding units (MSU) on board satellites like the one pictured above. Recently there was a change in UAH processing of satellite drift corrections, including dropping one platform which can no longer be corrected. The graphs below are taken from the revised and current dataset.
The UAH dataset includes temperature results for air above the oceans, and thus should be most comparable to the SSTs. There is the additional feature that ocean air temps avoid Urban Heat Islands (UHI). The graph below shows monthly anomalies for ocean air temps since January 2015.
Note 2020 was warmed mainly by a spike in February in all regions, and secondarily by an October spike in NH alone. In 2021, SH and the Tropics both pulled the Global anomaly down to a new low in April. Then SH and Tropics upward spikes, along with NH warming brought Global temps to a peak in October. That warmth was gone as November 2021 ocean temps plummeted everywhere. After an upward bump 01/2022 temps reversed and plunged downward in June. After an upward spike in July, ocean air everywhere cooled in August and also in September. Now in December 2022, sharp cooling everywhere brings the global anomaly to zero.
Land Air Temperatures Tracking Downward in Seesaw Pattern
We sometimes overlook that in climate temperature records, while the oceans are measured directly with SSTs, land temps are measured only indirectly. The land temperature records at surface stations sample air temps at 2 meters above ground. UAH gives tlt anomalies for air over land separately from ocean air temps. The graph updated for December is below.
Here we have fresh evidence of the greater volatility of the Land temperatures, along with extraordinary departures by SH land. Land temps are dominated by NH with a 2021 spike in January, then dropping before rising in the summer to peak in October 2021. As with the ocean air temps, all that was erased in November with a sharp cooling everywhere. Land temps dropped sharply for four months, even more than did the Oceans. March and April 2022 saw some warming, reversed In May when all land regions cooled pulling down the global anomaly. In July, Tropics and SH land rose sharply, NH slightly, pulling up the Global land anomaly. Note the sharp drop in SH land temps in August and September, while NH Land rose, leaving the Global anomaly unchanged. Nov. and Dec. saw steep declines in air temps over land.
The Bigger Picture UAH Global Since 1980
The chart shows monthly Global anomalies starting 01/1980 to present. The average monthly anomaly is -0.06, for this period of more than four decades. The graph shows the 1998 El Nino after which the mean resumed, and again after the smaller 2010 event. The 2016 El Nino matched 1998 peak and in addition NH after effects lasted longer, followed by the NH warming 2019-20. A small upward bump in 2021 has been reversed with temps having returned close to the mean as of 2/2022. March and April brought warmer Global temps, reversed in May and the June anomaly was almost zero. With the sharp drop in Nov. and Dec. temps, there is only about 0.1C increase since 1980.
TLTs include mixing above the oceans and probably some influence from nearby more volatile land temps. Clearly NH and Global land temps have been dropping in a seesaw pattern, nearly 1C lower than the 2016 peak. Since the ocean has 1000 times the heat capacity as the atmosphere, that cooling is a significant driving force. TLT measures started the recent cooling later than SSTs from HadSST3, but are now showing the same pattern. It seems obvious that despite the three El Ninos, their warming has not persisted, and without them it would probably have cooled since 1995. Of course, the future has not yet been written.


You must be logged in to post a comment.