Global warming, climate change, all these things are just a dream come true for politicians. I deal with evidence and not with frightening computer models because the seeker after truth does not put his faith in any consensus. The road to the truth is long and hard, but this is the road we must follow. People who describe the unprecedented comfort and ease of modern life as a climate disaster, in my opinion have no idea what a real problem is.
A team of scientists is looking to dump chemicals into waters off the coast of Massachusetts this summer to research whether doing so could be an effective counter to ocean acidification and climate change, according to The Wall Street Journal.
A team of scientists is looking to dump chemicals into waters off the coast of Massachusetts this summer to research whether doing so could be an effective counter to ocean acidification and climate change, according to The Wall Street Journal.
The project would see researchers from the Woods Hole Oceanographic Institution (WHOI) pour approximately 6,000 gallons of sodium hydroxide — a component of lye — into waters ten miles away from Martha’s Vineyard, Massachusetts, in August 2024, according to the WSJ. The research project, estimated to cost about $10 million in total, will receive taxpayer funds from the National Oceanic and Atmospheric Administration (NOAA) provided the Environmental Protection Agency (EPA) signs off on releasing the chemicals.
The underlying concept is to see if the basic sodium hydroxide can reduce the acidity of ocean waters and make those waters more efficient repositories of carbon dioxide, according to the WSJ. Sodium hydroxide is a common ingredient in soaps and cleaning solutions, and it can be harmful to humans in high concentrations, according to the Tennessee Department of Health. (RELATED: Eco-Activists, Climate Scientists Quietly Met To Discuss Tinkering With The Sun)
“When you have heartburn, you eat a Tums that dissolves and makes the liquid in your stomach less acidic,” Adam Subhas, a WHOI scientist who is poised to serve as the project’s main investigator, told the WSJ. “By analogy, we’re adding this alkaline material to seawater, and it is letting the ocean take up more CO2 without provoking more ocean acidification. Everything that we’re seeing so far is that it is environmentally safe.”
NOAA will provide some of the funding for the project, which is also being supported financially by private donors and two philanthropic organizations, according to the WSJ. Neither NOAA nor WHOI immediately responded to requests for comment, which included inquiries about the identities of the organizations and donors backing the project.
“EPA will follow the permitting process as described in the Marine Protection, Research, and Sanctuaries Act regulations before reaching a final determination to approve or deny the permit application,” a spokesperson for the agency told the Daily Caller News Foundation. “Once EPA receives a complete permit application, the agency will provide notice to the public and will invite public comment on the permit application and EPA tentative determination on whether to issue a permit.”
WHOI’s intention to test the efficacy of tinkering with ocean chemistry reflects a wider emergent trend of climate scientists pushing so-called “geoengineering” projects, according to the WSJ. The basic idea of geoengineering is altering some physical or chemical aspect of an environmental system in order to counteract climate change.
Other geoengineering projects that are being considered or funded by the government, private sector or major donors include systems that shoot particles 60,000 feet into the air to reflect sunlight and cool the atmosphere, and another project that aims to enlarge and brighten clouds to increase reflectivity, according to the WSJ.
All content created by the Daily Caller News Foundation, an independent and nonpartisan newswire service, is available without charge to any legitimate news publisher that can provide a large audience. All republished articles must include our logo, our reporter’s byline and their DCNF affiliation. For any questions about our guidelines or partnering with us, please contact licensing@dailycallernewsfoundation.org.
The eruption of the Hunga Tonga-Hunga Ha’apai volcano on January 15, 2022, produced the largest underwater explosion ever recorded by modern scientific instruments, blasting an enormous amount of water and volcanic gases higher than any other eruption in the satellite era.
The eruption of the Hunga Tonga-Hunga Ha’apai volcano on January 15, 2022, produced the largest underwater explosion ever recorded by modern scientific instruments, blasting an enormous amount of water and volcanic gases higher than any other eruption in the satellite era.
Two research papers have now detailed how that water vapor rapidly affected the Earth’s stratosphere between 10 and 31 miles above the surface, causing an unexpectedly large loss of ozone and an unexpectedly rapid formation of aerosols.
“Up until now, sulfur has been the primary focus of research on eruptions,” said Elizabeth Asher, a CIRES research scientist now working at NOAA’s Global Monitoring Laboratory. Asher led one of the two recent studies while at the NOAA’s Chemical Sciences Laboratory. “Studying Hunga Tonga showed that other gases, like water vapor, can have a profound impact on these outcomes.”
Hunga Tonga offered a unique opportunity to observe the immediate atmospheric impacts of a massive volcanic eruption. When news broke of the eruption, Karen Rosenlof, a senior climate scientist at the Chemical Sciences Laboratory, immediately contacted colleagues on the island of La Réunion, which sits in the Indian Ocean 8,000 miles away from Hunga-Tonga but lay directly in the path of the dispersing eruptive plume. Only days later, Asher and several colleagues from CIRES, the University of Houston, and St. Edward’s University were on flights bound for La Réunion carrying miniaturized atmospheric instruments in their baggage.
The rapid deployment of balloon-borne observations at Réunion Island confirmed the unprecedented amount of water vapor – an estimated 150 million tons – that was injected into the stratosphere by the eruption. The balloon payloads also carried instruments to measure ozone and sulfur dioxide, in addition to carrying a POPS (portable optical particle spectrometer) particle instrument to determine the abundance of injected aerosol, which was used to calculate the rate at which new aerosol particles were formed downwind of the volcano.
The rapid response observations by NOAA and partner scientists provided insights that would have been impossible if the measurements were a month later.
“Our measurements showed that stratospheric ozone concentrations decreased rapidly – by as much as 30% in air with the highest water vapor concentrations – in the immediate wake of the eruption,” said Stephanie Evan, a scientist from the Laboratoire de l’Atmosphère et des Cyclones in France and lead author of the other recent study, published in the journal Science. Evan and colleagues continued to measure ozone concentrations depleted by around 5% across the Indian and Pacific oceans two weeks following the eruption.
This graphic depicts how the ejection of water vapor from Hunga-Tonga volcano accelerated ozone depletion in the stratosphere. Credit: Chelsea Thompson/Chemical Sciences Laboratory
Scientists have long understood fundamentally that chlorine-containing molecules react with sulfate aerosols containing water vapor in the stratosphere converting them to an active form that destroys ozone. According to Rosenlof, however, these were the first measurements that captured the effect.
While Evan examined the impacts to ozone, Asher focused her attention on the particle measurements collected by the POPS. Volcanic aerosols are profoundly important for global climate, as demonstrated by the 1991 Mt. Pinatubo eruption that cooled the planet by 0.5°C (0.9°F) for nearly two years. They can also act as surfaces upon which rapid chemical reactions can take place, leading to the destruction of ozone.
By combining data from the balloon measurements with global satellite data, Asher and colleagues found that a large, dense layer of aerosol particles formed in the stratosphere faster than had ever been seen before. These findings were published in the Proceedings of the National Academy of Sciences.
“The tremendous amount of water vapor that this volcano sent to the stratosphere led to a rapid production of sulfate aerosol particles that we were able to observe within days of the eruption,” explained Asher. Under normal atmospheric conditions, sulfate aerosols form from sulfur dioxide on a timescale of about a month. In this case, rapid measurements provided critical clues for determining the chemical and microphysical processes required to cause these effects – clues that would have vanished if the measurements had been taken a month later.
Such measurements are critical for furthering scientific understanding of aerosol processes in the stratosphere, which remain one of the largest sources of uncertainty in climate predictions. Volcanic eruptions in particular are of significant interest because they are considered natural analogs for stratospheric aerosol injection — a proposed method of climate intervention that would spread reflective particles like sulfur dioxide in the stratosphere to intercept solar radiation and cool the Earth’s surface.
For more information, contact Chelsea Thompson, Chemical Sciences Laboratory: chelsea.thompson@noaa.gov.
Meteorologist finds 96 percent of NOAA temperature stations located in ‘urban heat islands,’ including next to exhaust fans and on ‘blistering-hot rooftops.’
Meteorologist finds 96 percent of NOAA temperature stations located in ‘urban heat islands,’ including next to exhaust fans and on ‘blistering-hot rooftops.’
Failure to maintain that level could lead to several catastrophes, including increased droughts and weather-related disasters, more heat-related illnesses and deaths, and less food and more poverty, according to NASA.
Failure to maintain that level could lead to several catastrophes, including increased droughts and weather-related disasters, more heat-related illnesses and deaths, and less food and more poverty, the National Aeronautics and Space Administration (NASA) cautions. TheEpoch Times has the story.
After the agreement, global spending on climate-related projects increased exponentially.
In 2021 and 2022, the world’s taxpayers spent, on average, $1.3 trillion each year,according to the nonprofit advisory group Climate Policy Initiative.
That’s more than double the spending rate in 2019 and 2020, which came in at $653 billion per year, and it’s significantly up from the $364 billion per year in 2011 and 2012, the report found.
NOAA’s climate monitoring stations found that the Earth’s average land and ocean surface temperature in 2023 was 1.35 degrees Celsius above the preindustrial average.
“Not only was 2023 the warmest year in NOAA’s 174-year climate record—it was the warmest by far,” said Sarah Kapnick, NOAA’s chief scientist.
But a growing chorus of climate scientists are saying the temperature readings are faulty and that the trillions of dollars pouring in are based on a problem that doesn’t exist.
More than 90 percent of NOAA’s temperature monitoring stations have a heat bias, according to Anthony Watts, a meteorologist, senior fellow for environment and climate at the Heartland Institute, author of climate website Watts Up With That, and director of a study that examined NOAA’s climate stations.
“And with that large of a number, over 90 percent, the methods that NOAA employs to try to reduce this don’t work because the bias is so overwhelming,” Mr. Watts told The Epoch Times.
“The few stations that are left that are not biased because they are, for example, outside of town in a field and are an agricultural research station that’s been around for 100 years … their data gets completely swamped by the much larger set of biased data. There’s no way you can adjust that out.”
He is the principal research scientist at the University of Alabama, the U.S. Science Team leader for the Advanced Microwave Scanning Radiometer (AMSR-E) on NASA’s Aqua satellite, and the recipient of NASA’s Exceptional Scientific Achievement Medal for his work with satellite-based temperature monitoring.
John Shewchuk, a certified consulting meteorologist, said the problems with temperature readings go beyond heat bias. The retired Lt. Col. was an advanced weather officer in the Air Force.
“After seeing many reports about NOAA’s adjustments to the USHCN [U.S. Historical Climatology Network] temperature data, I decided to download and analyze the data myself,” Mr. Shewchuk told The Epoch Times.
“I was able to confirm what others have found. It is obvious that, overall, the past temperatures were cooled while the present temperatures were warmed.”
The urban heat island effect causes higher temperatures in areas where there are more buildings, roads, and other forms of infrastructure that absorb and then radiate the sun’s heat, according to the Environmental Protection Agency (EPA).
The agency estimates that “daytime temperatures in urban areas are 1–7 degrees Fahrenheit higher than temperatures in outlying areas, and nighttime temperatures are about 2–5 degrees Fahrenheit higher.”
Consequently, NOAA requires all its climate observation stations to be located at least 100 feet away from elements such as concrete, asphalt, and buildings.
However, in March 2009, Mr. Watts released a report that showed that 89 percent of NOAA’s stations had heat bias issues due to being located within 100 feet of those elements, and many were located by airport runways.
“We found 68 stations located at wastewater treatment plants, where the process of waste digestion causes temperatures to be higher than in surrounding areas.”
The report concluded that the U.S. temperature record was unreliable, and, because it was considered “the best in the world,” global temperature databases were also “compromised and unreliable.”
Following the report, the U.S. Office of Inspector General (OIG) and the U.S. Government Accountability Office confirmed Mr. Watt’s findings and said NOAA was taking steps to address the issues.
“NOAA acknowledges that there are problems with the USHCN data due to biases introduced by such means as undocumented site relocation, poor siting, or instrument changes,” the OIG report states.
“All of the experts thought that an improved, modernized climate reporting system is necessary to eliminate the need for data adjustments.”
Despite the assurances, Mr. Watts had doubts about NOAA addressing the issues and in April and May of 2022, he and his team revisited many of the same temperature stations they’d observed in 2009.
“There are two main biases in the surface temperature network for the United States, and most likely the world, that I have identified,” Mr. Watts said.
“The biggest bias is the urban heat island effect. What happens is that because heat is retained by the surfaces and released into the air at night, the night’s low temperature is not as low as it could be if the thermometer were outside of town and in a field.”
Over the years, he said, more and more infrastructure has been built up around the thermometer locations, and at night, the asphalt and concrete release the absorbed heat and push up the temperature.
“You can look at any set of climate data, no matter who produces it, and you can see this effect. The low temperatures are trending upward much faster, and the high temperatures are virtually unchanged. But it’s the average temperature that’s being used to track climate change,” Mr. Watts said.
He said that even though both NOAA and NASA claim they can adjust their data to account for the urban heat island effect, the bias is impossible to overcome because the problem impacts 96 percent of surface stations.
He said the few thermometers located at climate stations not experiencing a heat bias show half the rate of warming currently being reported.
NOAA concocted an array of “Selected Significant Climate Anomalies and Events” for year 2023 that are shown below as prominently featured in their Annual 2023 Global Climate Report.
NOAA concocted an array of “Selected Significant Climate Anomalies and Events” for year 2023 that are shown below as prominently featured in their Annual 2023 Global Climate Report.
Of the 25 highlighted entries on NOAA’s “Selected Significant Climate Events” diagram 13 are related to cyclone and hurricane events across the various oceans of the Northern and Southern hemispheres that occurred during the year 2023.
These 13 highlighted isolated events suggest that 2023 experienced many extreme weather hurricane and cyclone events that will no doubt be hyped by climate alarmists with flawed claims of “extreme hurricane and cyclone climate events” having occurred in year 2023.
However, the context of these highlighted events fails to provide a complete and comprehensive global history of the cyclone and hurricane tropical events for the year 2023 with these highlighted events grossly misrepresenting the totality of the year 2023 cyclone and hurricane outcomes across the global oceans.
Unlike the NOAA year 2023 concocted and prominently featured “Selected Significant Climate Events” diagram which falsely hypes the extent of the year 2023 global hurricane and cyclone season outcomes the data from the Colorado State University Tropical Meteorology Project clearly establishes that the year 2023 was a very unremarkable and “normal” year for cyclones and hurricanes across the globe.
Climate alarmist claims that hype the year 2023 hurricane and cyclone season as being an “extreme weather outcome” are absurd and incompetent as is NOAA’s “Selected Significant Climate Events” hurricane diagram portrayal.
Equally disturbing in the NOAA prominently feature “Selected Significant Climate Events” diagram are the highlights noted for both the Arctic and Antarctic global regions.
Instead of identifying the significant 8 yearlong (2016 to 2023) and 17 yearlong (2007 to 2023) inclusive periods of downward temperature anomaly trends respectively for these regions, NOAA hypes sea ice extent issues that are unaddressed in its report.
The reality of the sea ice extent issues for the arctic and Antarctic regions are addressed here and here.
The Arctic Region highest average temperature anomaly was 3.00 degrees C that occurred in year 2016 as shown below from NOAA’s Global Time Series data with a clear downward temperature anomaly trend since 2016 to 2.55 degrees C in 2023 (ignored and concealed by alarmists).
The Arctic’s year 2023 average temperature anomaly was 0.45 degrees C below its prior highest average temperature anomaly year of 2016.
The Antarctic Region highest average temperature anomaly was 0.65 degrees C that occurred in 2007 as shown below from NOAA’s Global Times Series data which clearly shows a downward temperature anomaly trend since year 2007 (ignored and concealed alarmists) .
The Antarctic’s year 2023 average temperature anomaly was 0.50 degrees C below its prior highest average temperature anomaly year of 2007 at 0.15 degrees C.
The Arctic and Antarctic global regional year 2023 long term significant downward temperature anomaly trends of 0.45 degrees C and 0.50 degrees C respectively were ignored in the “Selected Significant Climate Anomalies” diagram while the year 2023 North America and Europe global regional increase and decrease anomaly outcomes of 0.02 and 0.01 degrees C respectively are highlighted as being “Selected Significant Climate Anomalies” merit worthy.
Additionally, NOAA’s prominently featured diagram fails to highlight the largest temperature anomaly change of all 16 global regions with that being the reduction of 0.8 degrees C for the East N Pacific region (over a 9 year inclusive period of 2015 to 2023) as shown below.
Rather than address this large year 2023 average temperature anomaly reduction NOAA’s “Selected” diagram highlight for the East N Pacific global region is adorned with a flawed claim that Hurricane Dora exacerbated the fire in Lahaina with that flawed assessment addressed in more detail here.
Also, the Hawaiian global region large year 2023 average temperature anomaly reduction of 0.66 degrees C is unaddressed in the NOAA’s “Selected” highlighted diagram. This large reduction (over a 9 year inclusive period) of 0.66 degrees C from 2015 is shown below.
NOAA’s year 2023 average temperature anomaly data for its 16 global regions had 4 global regions which had by far the largest incremental changes from their prior record high average temperature anomaly values (all of them reductions) with these regions being:
Arctic – a reduction of 0.45 degrees C from year 2016
Antarctic – a reduction of 0.5 degrees C from year 2007
Hawaiian – a reduction of 0.66 degrees from 2015
East N Pacific – a reduction of 0.8 degrees C from 2015
Yet none of these significantlylargest by far year 2023 average temperature anomaly reductions is addressed in the prominent NOAA’s “Selected Significant Climate Anomalies and Events” diagram for any of these regions while upward average temperature anomaly changes as small as 0.02 degrees C (North America) are highlighted.
The NOAA “Selected Significant Climate Anomalies and Events” diagram misrepresents many significant global anomalies and events for year 2023.
So I open my electronic window onto the world this morning, and I find lots of wailing and gnashing of teeth about a projected sea level rise in the US state of Maine.
So I open my electronic window onto the world this morning, and I find lots of wailing and gnashing of teeth about a projected sea level rise in the US state of Maine. Seems there’s something called the “Maine Climate Council”, which has un-named “scientists” advising it. Here, per the Portland [Maine] Press Herald, is an interactive map that you can use to scare yourself silly by choosing a given sea level rise and seeing who goes underwater. To give you an idea of how high they want you to dial up the alarmism, the article says (emphasis mine):
For reference, Maine sea levels are projected to rise between 1.1 and 3.2 feet by 2050 and between 3 and 9.3 feet by 2100, depending on how successful and quick we are at curbing global emissions rates, according to the scientists who advise the Maine Climate Council.
Now, folks who follow my work know that I’ve done a lot of analyses of sea level claims. And this one set my bad number detector ringing louder than Representative Bowman’s fire alarm.
And sadly, the hype runs deep in the study of the sea level. For example, in my post Munging The Sea Level Data, I demonstrated that the claims of modern acceleration in sea level rise come entirely from a totally invalid splicing of two sets of satellite-measured sea levels. Here’s the money graph from that post.
Figure 1. The four satellite records that are combined to claim acceleration.
Note that the earlier two satellites show a sea level rise of about 2.6 mm/year, which is in line with tide station data. But the latest two satellites show a rise that’s about 50% higher. And the unethical “scientists” using this satellite data fraudulently splice them all together, spread peanut butter over the splice so it can’t be seen, and scream “MASSIVE 50% ACCELERATION IN SEA LEVEL RISE!! EVERYONE PANIC!”. The fraud is shown below.
Figure 2. The artificial claimed “sea level acceleration”.
Grrr … the amount of flat-out lying by climate alarmists knows no bounds … but I digress.
Returning to Maine, NOAA has records from five tide gauges on the Maine coast. A couple of them are around a century long. And guess what?
Despite our total lack of success at “curbing global emissions rates” over the last century, not one of them shows the slightest sign of any acceleration in sea level rise.
Figure 3. Maine sea level records.
So I thought I’d project those records out to 2050, and compare them with the “scientists” claim that by 2050 the sea level in Maine would rise by 1.1 to 3.2 feet (335 to 975 mm, or 13 to 38 inches). Here’s the result. The “whisker bars” show the uncertainty in the projected rise.
Figure 4. Projected sea level rise to 2050, using the historical trends of the five cities, and also showing the rise that is projected by the “scientists who advise the Maine Climate Council”.
Yeah, that’s totally legit … not much else to say about that, except that when you hear someone talking about “climate change” and “sea level rise”, hang on to your wallet, because you’re being had.
Here, it’s a gloriously raining Sunday morning, with the football playoffs on TV (not the round ball kind) and our daughter, son-in-law, and two young grandkids whom my gorgeous ex-fiancée and I live with laughing and running around this big old house I built with my own hands … truly, dear friends, I’m the luckiest man in the world.
NOAA concocted an array of “Selected Significant Climate Anomalies and Events” for year 2023 that are shown below as prominently featured in their Annual 2023 Global Climate Report.
NOAA concocted an array of “Selected Significant Climate Anomalies and Events” for year 2023 that are shown below as prominently featured in their Annual 2023 Global Climate Report.
Of the 25 highlighted entries on NOAA’s “Selected Significant Climate Events” diagram 13 are related to cyclone and hurricane events across the various oceans of the Northern and Southern hemispheres that occurred during the year 2023.
These 13 highlighted isolated events suggest that 2023 experienced many extreme weather hurricane and cyclone events that will no doubt be hyped by climate alarmists with flawed claims of “extreme hurricane and cyclone climate events” having occurred in year 2023.
However, the context of these highlighted events fails to provide a complete and comprehensive global history of the cyclone and hurricane tropical events for the year 2023 with these NOAA highlighted events grossly misrepresenting the totality of the year 2023 cyclone and hurricane outcomes across the global oceans.
Provided below is data from the Colorado State University Department of Atmospheric Science Tropical Meteorology Project that addresses in full and complete detail (access the Basin Archives global oceans data base) the historical tropical cyclone statistics for year 2023 across all the global oceans along with comparisons provided of the year 2023 outcomes with prior decades of recorded annual hurricane and cyclone data.
The graphs below reflect data regarding the Accumulated Cyclone Energy (ACE) for each year indicated with this metric representing the complete annual energy resulting from all storms experienced with the total duration and intensity determining each storm’s total ACE contribution.
The first graph provides the year 2023 Global historical cyclone ACE outcome compared to ACE data for the last 44-year inclusive period going back to 1980.
The data demonstrates no consistent increasing trend of ACE during this period with the year 2023 representing only the 10th highest ACE during this period.
The next graph provides the year 2023 Northern Hemisphere ACE outcome compared to ACE data for each year going back the last 53 years to 1971.
The data demonstrates no consistent increasing trend of ACE during this period with the year 2023 representing only the 11th highest ACE during this period.
The next graph provides the year 2023 Southern Hemisphere ACE outcome compared to ACE data for each year going back the last 44 years to 1980.
The data demonstrates no consistent increasing trend of ACE during this period with the year 2023 representing only the 15th highest ACE during this period.
The next 2 graphs provide the year 2023 Northeast and Northwest Pacific Ocean ACE outcomes compared to ACE data for each year going back the last 53 and 74 years respectively to 1971 and 1950.
The data demonstrates no consistent increasing trend of ACE during these periods with the year 2023 representing only the 14th and 22nd highest ACE during these periods.
One of the NOAA “Selected Significant Climate Events” includes a flawed claim that “Hurricane Dora (located in the Northwest Pacific Ocean) exacerbated a wildfire on the island of Maui in Hawaii that destroyed the historic town of Lahaina.”
This claim is completely false as addressed here and here.
Hurricane Dora was located 700 miles south of Maui and played no significant role in the fire.
The massive fire was the direct result of incompetence by Hawaiian Electric which delayed for years $190 million dollars of planned and required maintenance on known distribution and transmission line defects (it spent only $250,000 on these projects) while spending tens of millions on increasing nondispatchable unreliable solar and wind projects dictated by renewable energy activist politics.
The next graph presents the year 2023 South Pacific Ocean ACE outcome compared to ACE data for each year going back the last 44 years to 1980.
The data demonstrates no consistent increasing trend of ACE during this period with the year 2023 representing only the 33rd highest ACE during this period.
The next 2 graphs present the year 2023 North and South Indian Ocean ACE outcomes compared to ACE data for each year going back the last 52 and 44 years respectively to 1972 and 1980.
The data indicate a recent increasing trend in the North Indian Ocean and no consistent increasing trend in the South Indian Ocean with the year 2023 ACE being 2nd highest in the North Indian Ocean and 5th highest in the South Indian Ocean during these respective periods.
The next graph presents the year 2023 North Atlantic Ocean ACE outcome compared to ACE data for each year going back the last 173 years to 1851
The data demonstrates no consistent increasing trend of ACE during this period with the year 2023 representing only the 33rd highest ACE during this period.
Furthermore, there was only 1 land falling North Atlantic major hurricane that struck the U.S. in 2023 as shown below and addressed here.
The data shows there is no increasing trend of landfalling major hurricanes on the Continental U.S. from North Atlantic major hurricanes during the period from 1900 through 2023.
Unlike the NOAA year 2023 concocted and prominently featured “Selected Significant Climate Events” diagram which falsely hypes the extent of the year 2023 global hurricane and cyclone season outcomes the data from the State University of Colorado Tropical Meteorology Project clearly establishes that the year 2023 was a very unremarkable and “normal” year for cyclones and hurricanes across the globe.
Climate alarmist claims that hype the year 2023 hurricane and cyclone season as being an “extreme weather outcome” are absurd and incompetent as is NOAA’s “Selected Significant Climate Events” hurricane diagram portrayal.
Every time they have to ramp up the alarm, as their efforts to scare us fail.
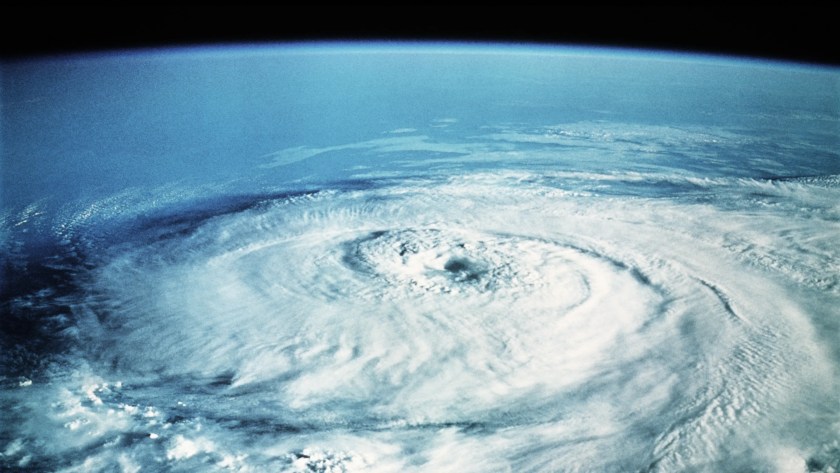
So let’s be very clear about one thing – this is not a hurricane, which specifically is a tropical cyclone, something that feeds off the warmth of the ocean. According to NOAA, they need the following conditions to form:
This new storm, Isha, is actually an Extratropical Cyclone, which gets its power from the temperature difference between cold polar air and warm tropical air. In other words, a common or garden depression, which can be small and weak, or big and powerful:
The claim that Isha has hurricane force winds is particularly disingenuous. Sustained (average) winds of 74 mph over the open ocean are nothing unusual at all at this time of year, and will be much stronger than anything hitting land, even on top of The Needles. And sustained winds are not gusts.
Gusts of 50 to 60 mph are generally expected inland, again nothing unusual. The worst of the winds are expected in the west of Scotland and West Wales:
If we look at the latest Met Office forecast for Sunday evening, Glasgow might get gusts of 52 mph, but average winds are much lower at 25 mph.
It looks a bit windier down in Aberystwyth, gusts of 61 mph and average winds of 33 mph. No doubt a few locations will see stronger winds, but this is just another gale of the sort we see every winter. A hurricane it ain’t!
The NASA GISS global average temperature anomaly for November 2023 was released (provided below) which shows an El Niño driven value of 1.44 degrees C (2.592 degrees F) with the November outcome hyped in an L A Times article as being “a new monthly record for heat” and the “hottest November”.
The NASA GISS global average temperature anomaly for November 2023 was released (provided below) which shows an El Niño driven value of 1.44 degrees C (2.592 degrees F) with the November outcome hyped in an L A Times article as being “a new monthly record for heat” and the “hottest November”.
This GISS anomaly value represents a November global absolute average temperature of 59.792 degrees F.
The prior highest measured GISS November global average temperature anomaly was in the year 2020 with a value of 1.10 degrees C (1.98 degrees F) which represents a November global absolute average temperature of 59.18 degrees F – a difference of 0.612 degrees F which the Times has hyped as being the “hottest November”.
The highest prior GISS measured EL Nino year average temperature anomaly was in 2016 at 1.37 degrees C (2.466 degrees F) which represents an absolute temperature of 59.666 degrees F – a difference of 0.126 degrees F (1/8th of a degree F) from the November 2023 EL Nino driven anomaly value.
The climate alarmist propaganda media misleadingly exaggerate the small average temperature anomaly differences between these measurements by deliberately concealing the specific numerical value of such differences and instead hyping these carefully hidden small differences as being “a new monthly record for heat” and the “hottest November” even when the latest measured GISS global anomaly value is only 1/8th of a degree F changedfrom the highest prior year 2016 EL Nino value.
The L A Times climate alarmist article continues to conceal and downplay the overwhelming importance of the large year 2023 El Niño event with the obvious impact that such a naturally occurring global wide climate event has in hugely increasing both absolute and anomaly temperature measurement outcomes around the world.
The Times article ridiculously hypes (shown below) that November 2023 is the “sixth straight month to set a heat record” that “has truly been shocking” with people “running out of adjectives to describe this” when the NASA GISS data shown above clearly establishes that this many month-long pattern of increasing anomalies is completely consistent with the year 2016 Global El Nino event which experienced 7 straight months of increasing anomalies from October 2015 through April 2016.
The GISS November 2023 global average temperature anomaly represents a mathematically derived composite average value of all global average temperature anomaly measurement data representing an extraordinary array of five disparate global climate regions (shown below) along with the huge disparate climate behavior differences present in the global hemispheres with their unique and far flung oceans, continents, mountains, deserts, rain forests, low lands, etc.
The mathematically contrived global average temperature anomaly result is created through a composite menagerie of widely disparate climate region data outcomes that apply to no specific region or location anywhere on earth.
Additionally, climate alarmist hyped claims of “limiting global warming to 2 degrees C (temperature anomaly value) above pre-industrial times” are based on a climate model referred to as RCP8.5 that was rejected by Working Group I, The Physical Science, of the UN International Panel on Climate Change (IPCC) Assessment Report (AR6, 2021).
The climate alarmist propaganda media erroneously misrepresent the contrived global average temperature anomaly data in support of their hyped climate alarmists claims while ignoring and concealing extensive anomaly and absolute temperature measurement data that conflicts with their highly contrived global average temperature anomaly driven methodology.
Extensive NOAA anomaly and absolute temperature measurement data is readily available for the Contiguous U.S that addresses both average temperature anomaly measurements as well as maximum absolute temperature measurements.
The graph below shows NOAA’s average temperature anomaly measurements through November 2023 for the Contiguous U.S. which clearly demonstrates there is no increasing trend in the average temperature anomaly data for the Contiguous U.S. using the most accurate USCRN temperature measurement stations that went into operation in 2005.
The NOAA November 2023 El Niño year average temperature anomaly value is 1.44 degrees F compared to the prior November 2016 El Niño year average temperature anomaly value of 4.88 degrees F.
Furthermore, the highest measured NOAA Contiguous U.S. November average temperature anomaly value from the USCRN temperature measurement stations was also the November 2016 El Niño year outcome of 4.88 degrees F compared to the November 2023 El Nino year value of 1.44 degrees F.
The next highest NOAA Contiguous U.S. November average temperature anomaly outcomes following the 4.88-degree F year 2016 value occurred (highest to lowest order) in the years 2020, 2009, 2017, 2021, 2005, 2015 and then 2023 respectively.
Thus, the November 2023 Contiguous U.S. average temperature anomaly value is only the 8th highest measured by the USCRN for the month of November.
The L A Times alarmist article conceals the most relevant Contiguous U.S. year 2023 climate average temperature anomaly data available from its readers with that data clearly showing the lack of any record-breaking climate anomaly outcomes in the Contiguous U.S. region.
Instead, the Times article hypes a contrived global average temperature anomaly outcome that applies nowhere on earth while at the same time falsely positing that this contrived global anomaly outcome is relevant to the Contiguous U.S. region.
The NOAA climate data shown below provides the November 2023 absolute maximum temperature measurements for the period 1895 to 2023 in the Contiguous U.S. that establishes the November 2023 outcome is only the 109th highest out of 129 maximum November temperature measurements recorded during the 1895 to 2023 period.
The NOAA data below provides the maximum November 2023 year to date interval temperatures in the Contiguous U.S. for the period 1895 to 2023 establishing that the year 2023 January through November absolute maximum temperature is only the 115th maximum temperature interval out of 129 maximum interval temperature measurements.
The NOAA data below provides the absolute maximum temperatures for all months between 1895 and November 2023 for the Contiguous U.S. establishing that month of November 2023 is only the 592nd highest maximum temperature out of 1547 absolute maximum temperatures measured with the highest ever measured maximum temperatures occurring in the dust bowl era of the 1930s.
NOAA has extensive temperature measurement data available for 9 U.S. Regions as shown in their Map below with access to this data obtained through NOAA’s Regional Time Series option at the links noted for the above graphs.
Without belaboring this analysis any further all NOAA’s 9 Contiguous U.S. climate regions measured data establish that November 2023 does not represent the highest absolute maximum temperature for any of these regions regardless of whether one is evaluating just the month of November, the January to November period interval or all months over the period 1895 through November 2023.
NOAA also has data available for all 48 Contiguous U.S. states as well as for Alaska using NOAA’s Statewide Time Series option available at the links noted above.
NOAA data for California establishes that November 2023 does not represent the highest absolute maximum temperature regardless of whether one is evaluating just the month of November, the January to November period interval or all months over the period 1895 through November 2023 as shown below where November 2023 is only the 602nd of 1547 absolute maximum temperature outcomes during 1895 to November 2023 period.
NOAA’s extensive and readily available climate data for the Contiguous U.S. (both average temperature anomaly and absolute maximum temperature measurements) clearly shows that climate alarmist propaganda claims of a “climate emergency” (including such claims in the L A Times) are unsupported by NOAA average temperature anomaly and absolute maximum temperature climate data measurements.
Additionally, this extensive NOAA data is deliberately concealed by climate alarmists while at the same time erroneously misrepresenting the critical climate science differences between maximum absolute temperature and average temperature anomaly data measurements.
The Sun is approaching its solar maximum, the apex of its 11-year solar cycle. As it approaches that, as we’ve already seen over the last couple of years, we can expect more and greater activity from our solar system’s center. But that’s the thing, this solar-cycle might be far more intense than anyone expected.
The Sun as imaged on 29 November by NASA’s Solar Dynamics Observatory in 171 angstroms. (NASA SDO)
A new study has found that the impending peak in the Sun’s activity cycle will likely arrive significantly sooner than previously predicted.
According to an analysis by astrophysicists Priyansh Jaswal, Chitradeep Saha, and Dibyendu Nandy at the Center of Excellence in Space Sciences India, solar maximum is likely to hit in January 2024.
This is much, much sooner than the initial official prediction, which found solar maximum would take place in July 2025.
The finding suggests that there may be better ways of predicting the Sun’s behavior than the methods used for the official predictions for the current solar cycle, solar cycle 25.
Solar cycles are somewhat mysterious – it’s not entirely clear what drives them – but they are very normal.
Simply put, every 11 years or so, the Sun’s magnetic field reverses polarity. This is accompanied by a rise and fall of solar activity – sunspots, solar flares, and coronal mass ejections.
The Sun as seen by the Solar Dynamics Observatory on November 29. That’s a lot of eruptions, hey? (NASA SDO)
The point at which the poles switch places is known as solar maximum, characterized by a peak in activity. Solar minimum follows several years later; the Sun deescalates its activity before ramping up to the next maximum.
We track and predict when this will occur based on the number of sunspots that speckle the face of the Sun. However, this method has never been an exact science; we know roughly when solar maximum will occur, but official predictions are more of an estimate than a precision pinpoint.
The last solar minimum, marking the end of solar cycle 24, took place in 2019. Solar cycle 24 was relatively quiet, as solar cycles go; the NOAA prediction was that solar cycle 25 would follow suit, with subdued activity, and a peak in July 2025.
The Sun on November 29 in 211, 193, and 171 angstrom wavelengths. (NASA SDO)
Some scientists called it. Robert Leamon of NASA and Scott McIntosh of the US National Centre for Atmospheric Research predicted that solar maximum would be stronger than others believed, and take place in mid to late 2024. Last month, the NOAA revised its prediction, announcing that the maximum is now expected between January and October of 2024.
We’ve been getting by pretty well so far, but solar activity is tied to space weather – eruptions from the Sun can have an impact on Earth, and while our recourse is limited, there might still be ways to try and protect ourselves. So more accurate predictions of the solar cycles would be a nice thing to have.
Leamon and McIntosh based their analysis of the Sun on its internal magnetic activity, tracing larger patterns of behavior back over a long period of time. Jaswal and his colleagues have done something similar, studying decades-old data and linking magnetic activity to something known as the Waldmeier effect.
Sunspots freckling the face of the Sun on 29 November. (NASA SDO)
Formulated in 1935, the Waldmeier effect relates to sunspots and the length of the solar cycle. Basically, the faster sunspot activity ramps up, the faster solar maximum arrives. So, the stronger the cycle, the shorter it is.
Jaswal and his team looked at the rate at which the Sun’s poles weaken, studying data that dates back to 1976. They found that the rate of decay of the solar dipole correlates very neatly with the Waldmeier effect.
This means that they could use the Waldmeier effect to predict when the polar magnetic fields would weaken to zero and switch places – solar maximum.
Their findings predicted a timeframe around January 2024. There’s still some uncertainty and wiggle room, but if solar maximum takes place at this time, we’ll know that they’re onto something.
In all, however, the evidence so far suggests that we need to be looking more closely at the Sun’s magnetic activity, rather than just what’s happening on the surface.
CNN published an article this weekend raising alarm about “disappearing” snowfall during the past 50 years, all the while burying the negligible amount of snow decline. By CNN’s own data, snowfall has declined merely 2 percent during the past half-century, which is statistically insignificant and barely measurable.
Moreover, 1973 was an above-average snowfall year, so choosing 1973 as the starting point is dishonest. Finally, CNN failed to mention that snow cover trends have been flat for decades and are actually rising during the past 30 years.
All these facts show that CNN – like climate activists do regarding so many climate issues – is crying ‘the sky is falling’ over essentially nothing.
“Snowfall is declining globally as temperatures warm because of human-caused climate change, a new analysis and maps from a NOAA [National Oceanic and Atmospheric Administration] climate scientist show,” reads the article’s opening paragraph. The article then asserts that less snow somehow “threatens to disrupt food and water for billions of people.”
However, there is no decline at all in precipitation. In fact, NOAA reports there has been an increase in precipitation in recent decades. Instead, precipitation is merely shifting – on the very edge of wintry late fall and early spring – from snow to rain. How does more precipitation and longer growing seasons threaten to disrupt food and water for billions of people?
Worse, only after five paragraphs of alarm does CNN quietly note that snowfall has declined just 2 percent during the past half century. That is an almost indistinguishable small amount that can barely be measured. At that pace, it would take 250 years for a mere 10 percent of our current snowfall to then be falling as rain.
Still further, the snowfall data show an increase in snowfall in many American ski destinations like Vermont, New Hampshire, Maine, and Utah. The lion’s share of the modest snow decline is in the U.S. Southeast, which does not receive much snowfall, anyway.
The choice of 1973 as a starting point is also suspect. Rutgers University Global Snow Lab tracks global snow cover going back to November 1966, when satellites first began to track global snow cover. The year 1973 had unusually high snow extent, even for the early years of snow measurement. If current snowfall was compared to1967, which was the first full year of the satellite record, CNN would be reporting on an increase rather than decrease in snowfall, and CNN would likely be crying alarm and blaming increasing snowfall on global warming, also. The same holds for an analysis beginning in 1990 or 2000, with snow cover modestly increasing since then.
In short, there is no declining snowfall crisis. There is only a crisis of media dishonesty regarding all things climate change.
James Taylor is the President of the Heartland Institute.
Taylor is also director of Heartland’s Arthur B. Robinson Center for Climate and Environmental Policy.
Taylor is the former managing editor (2001-2014) of Environment & Climate News, a national monthly publication devoted to sound science and free-market environmentalism.




You must be logged in to post a comment.