โ€˜The Future of CCS Can No Longer Be Assumedโ€™ (a supporter rethinks โ€ฆ)

Martin Jagger, a climate activist specializing in carbon capture & storage, recently wrote a sobering post on the progress of this technology in addressing the assumed- to- be climate crisis. This problematic approach is another example of the tears- in-the- ocean choices of climate mitigation policy.

Industrial scene featuring large pipes, equipment, and smokestacks, with text overlay discussing CCS (Carbon Capture and Storage) and its future.
AI generation by Meta

From Master Resource

By Robert Bradley Jr.

โ€œToday, global operating nameplate capture capacity is approximately 60 million tonnes a year. If fully utilised, that would represent gross capture equivalent to roughly 14-15 hours of annual global energy and industrial emissions. Actual verified net storage is lower.โ€ (- Martin Jagger, below)

Martin Jagger, a climate activist specializing in carbon capture & storage, recently wrote a sobering post on the progress of this technology in addressing the assumed-to-be climate crisis. This problematic approach is another example of the tears-in-the-ocean choices of climate mitigation policy.

โ€œFor twenty years,โ€ he begins, โ€œI have argued that CCS has an important role to play in managing emissions from industries where practical alternatives remain limited.โ€ The progress to date has been small, and the effect on global emissions minuscule. He explains:

Today, global operating nameplate capture capacity is approximately 60 million tonnes a year. If fully utilised, that would represent gross capture equivalent to roughly 14-15 hours of annual global energy and industrial emissions. Actual verified net storage is lowerโ€ฆ. Closing even the gap between todayโ€™s operating capacity and the announced [EIA estimated] 2030 pipeline would require an extraordinary acceleration in permitting, financing, construction, commissioning and sustained operating performance.

The interest and potential investment are there, he believes, but โ€œdeliveryโ€ is small and problematic.

โ€ฆ announcements are not delivery, storage resources are not injection capacity, and nameplate capacity is not independently verified climate impact. The next phase of CCS must therefore be more demanding than the last. By 2030, success should no longer be measured primarily by the number of projects announced, memoranda signed, licences awarded or billions committed. It should be measured by verified net tonnes securely stored, year after year. That requires a tougher delivery model.

He alludes to the problem of getting from hyperbole to practice.

We have largely solved the problem of attracting interest and announcing investment. We have not yet solved the delivery problem. That distinction matters because CCS cannot indefinitely be judged by its potential. Nor should every delay be explained by saying that the industry simply needs more policy support or more public money. After two decades, the burden of proof must begin to shift.

Continuing:

That shift also requires greater honesty about how progress is reported. Too many of the institutions responsible for advocacy and industry leadership still present CCS largely as a good-news story. New projects, funding awards and headline capacity are publicised; delays, cancellations, operating shortfalls and the absence of verified storage receive much less attention.

Final Comment

Government incentives for carbon capture and storage, formalized in the Energy Improvement and Extension Act of 2008 (Section 45Q tax credit), should be terminated to please the free-market community and many environmentalists. [2] The whole initiative is inconsequential to global or regional climate, and projects have been opposed by local residents in the U.S. and elsewhere. [3]


[1] Martin Jaggerโ€™s bio reads:

I am an Executive Consultant in Energy Transition Strategy and Decarbonisation Delivery with a track record of bringing operator discipline to CCS policy and projects. I established Shellโ€™s Carbon Capture and Storage Centre of Excellence in 2007 and helped shape international frameworks for long-term COโ‚‚ storage that informed UNFCCC CDM mechanisms and regulatory guidance.

I currently advise sovereigns, regulators and innovators on areas where policy realism, technical feasibility and capital must align. My work tests the credibility of targets, the true scaling pathways for CCS and low-carbon fuels, and the structural barriers that stall momentum โ€“ especially FID drag, subsidy distortion, infrastructure mis-sequencing and the policy-performance gap.

[2] The tax credits since 2022 are $85 per ton of COโ‚‚ stored for dedicated geologic storage projects and $60 per ton for COโ‚‚ utilization projects with associated storage, increased subsidies from $50 and $35 (2018) and $20 and $10 (2008). A summary of federal largess from Taxpayers for Common Sense reads:

For decades, the federal government has provided billions of dollars in both direct and indirect subsidies to support CCS technology and projects. These subsidies have included research, development, and demonstration (RD&D) funding, loan guarantees, and tax credits.

Over the past few decades some of these subsidies have gone to projects that have been repeatedly started and stopped, only to eventually collapse due to various economic issues and controversies (e.g., FutureGen, Kemper). Additionally, the 45Q tax credit, which has grown significantly in both size and scope, has been mired in fraud and waste. To date, the federal government has spent tens of billions of taxpayer dollars on CCS through research and development funding and tax credits, yet the technology is still struggling with widescale deployment issues due to high costsโ€ฆ.

According to the Congressional Research Service (CRS), Congress provided roughly $9 billion (in nominal dollars) in annual appropriations for DOEโ€™s FECM from FY2010 to FY2023, with over $2.8 billion specifically directed towards CCS line itemsโ€ฆ. Congress appropriated $12 billion more to the technology through the infrastructure law (Infrastructure Investment and Jobs Act, P.L. 117-58) and greatly expanded the already lucrative tax credit in the Inflation Reduction Act (Public Law 117-169).

[3] There are currently 15 operating CCS facilities in the U.S. and another 120 projects under development. The top ten projects are (verbatim):

1. Stratos Direct Air Capture (DAC) Project

Companies: Occidental Petroleum (through its subsidiary 1 Point Five) and Origis Energy
Capacity: 500, 000 metric tons of COโ‚‚ annually
Application: Direct Air Capture powered by a dedicated solar portfolio
Source: Origis Energy Commissions 500 MWdc Swift Air Solar Projects in โ€ฆ

2. CF Industries Donaldsonville CCS Facility

Companies: Calpine Corporation and Exxon Mobil
Capacity: Approximately 2 million metric tons of COโ‚‚ annually
Application: Low-carbon power generation from a new natural gas plant
Source: Calpine, Exxon Mobil sign CO 2 transportation and storage โ€ฆ

3. Calpine Baytown Energy Center CCS Project

Companies: CF Industries and Exxon Mobil
Capacity: A key component of Exxon Mobilโ€™s contracted ~9 million metric tons per annum (MTA) portfolio
Application: Decarbonization of ammonia production
Source: Hereโ€™s How XOM Is Scaling Up Its CCS Footprint to Reduce Emissions

4. Google-Backed Gas Power Plant with CCS

Companies: Google and Mitsubishi Power
Capacity: Designed to capture 90% of COโ‚‚ emissions
Application: Firm, low-carbon power for data centers
Source: Google Commits to First U.S. Gas-Fired Power Plant with Integrated โ€ฆ

5. California Resources Corporation (CRC) Carbon Terra Vault I (CTV I)

Company: California Resources Corporation
Capacity: Not specified; designed as a dedicated COโ‚‚ storage facility
Application: COโ‚‚ injection and permanent geologic storage
Source: California Resources Corporation Breaks Ground on Californiaโ€™s โ€ฆ

6. Sweetwater Carbon Storage Hub (SCS Hub)

Companies: Frontier Infrastructure and Baker Hughes
Capacity: Positioned to be one of the largest U.S. COโ‚‚ sequestration assets (specific tonnage not provided)
Application: Multi-user COโ‚‚ sequestration hub for industrial emitters
Source: Baker Hughes, Frontier Infrastructure Partner on Carbon Capture โ€ฆ

7. ADM Decatur CCS Facility

Company: Archer-Daniels-Midland (ADM)
Capacity: Averages nearly 0.5 Mtpa (based on 4.5 million metric tons sequestered over a decade)
Application: Long-term industrial CCS for ethanol production
Source: ADM and Carbon Capture and Storage

8. Lake Charles Power Station Integrated COโ‚‚ Capture Project

Company: Project supported by the U.S. Department of Energy (DOE)
Capacity: Not specified; large-scale pilot
Application: Advancing capture technologies for power generation
Source: [XLS] Sheet 1 โ€“ Climate Program Portal

9. Illinois COโ‚‚ Injection Project

Company: Unnamed Texas-based developer
Capacity: Not specified; early-stage regulatory filing
Application: New COโ‚‚ injection and storage project
Source: CP Daily Newsletter: Wednesday February 18, 2026 โ€“ Carbon Pulse

10. Bantam DAC Facility

Company: Climeworks
Capacity: Over 5, 000 tons of COโ‚‚ annually
Application: Direct Air Capture, noted as the largest operational DAC in the U.S. as of October 2025
Source: Facilities โ€“ CO 2 RE โ€“ Global CCS Institute

AI Fills the Gaps: New Diffusion Model Creates Seamless Global Rainfall Maps

Researchers at Chiba University (led by Assistant Professor Daiko Kishikawa, with Dr. Yuka Muto and Dr. Shunji Kotsuki) have developed a machine- learning method to fill gaps in global satellite- based rainfall maps.

An infographic illustrating a new diffusion model for creating seamless global rainfall maps. It highlights the process of filling gaps in incomplete satellite data, using AI to learn patterns and generate high-resolution rainfall maps. The image includes labeled sections for incomplete data, AI diffusion model capabilities, and a complete seamless map, along with a color scale indicating precipitation intensity.
AI generated by Grok

Researchers at Chiba University (led by Assistant Professor Daiko Kishikawa, with Dr. Yuka Muto and Dr. Shunji Kotsuki) have developed a machine- learning method to fill gaps in global satellite- based rainfall maps.

Global rainfall maps, such as those from the Japan Aerospace Exploration Agencyโ€™s Global Satellite Mapping of Precipitation (GSMaP), are assembled from multiple satellites. Because satellites cannot observe the entire Earth at once, some areas lack valid observations. Traditional gap- filling approaches rely on earlier and later observations but often fail to fully capture how precipitation patterns evolve in space and time, leading to inconsistencies.

The team reframed the problem as a video- reconstruction (inpainting) task. They treat sequences of precipitation maps like video frames and estimate missing sections using information from nearby times and surrounding regions, plus auxiliary data. Their approach combines a three- dimensional (3D) U- Net convolutional neural network (which captures spatiotemporal patterns) with a 3D condition encoder. The encoder incorporates infrared satellite images, geographic coordinates, and time information. The overall method uses a conditional diffusion model.

Training and testing details:

  • The model was trained on hourly precipitation data from the ERA5 reanalysis (European Centre for Medium- Range Weather Forecasts) for 2020- 2023. Researchers simulated GSMaP- style gaps by removing corresponding areas from the complete ERA5 maps.
  • On 2024 test data, it outperformed other deep- learning baselines (standard U-Net, variational autoencoder, and generative adversarial network models) in prediction accuracy and image quality while producing spatially and temporally consistent rainfall patterns.
  • Sensitivity analysis showed that precipitation data and infrared images were the most important inputs.
  • When applied to real incomplete GSMaP maps (using ERA5 as a reference, since no complete GSMaP ground truth exists), it successfully reconstructed the missing regions.

Paper details: โ€œConditional Diffusion Models for Global Precipitation Map Inpainting,โ€ published in Earth and Space Science (Volume 13, Issue 9; available online 24 September 2026; DOI: 10.1029/2025EA004666).

The method could support near- real- time applications for heavy- rainfall and flood monitoring, water- resource management, hydrological analysis, and disaster- risk reduction, particularly valuable in regions with sparse ground gauges or radars. Funding included support from JAXAโ€™s Precipitation Measuring Mission, JSPS KAKENHI grants, and Chiba University programs.

This work is distinct from earlier Chiba University research (e.g., by Muto and Kotsuki) that used the Local Ensemble Transform Kalman Filter (LETKF) to improve gauge- based global precipitation estimates.

Three maps showing 'Input', 'Predicted', and 'True' precipitation data for different times (12:00, 13:00, 14:00) with a color scale indicating precipitation levels in mm hโˆ’1.
The left column shows precipitation maps containing simulated satellite-observation gaps, the middle column shows the reconstructed maps produced by the model, and the right column shows the corresponding complete target precipitation maps. Gray areas indicate missing observations. Credit: Assistant Professor Daiko Kishikawa and Dr. Shunji Kotsuki from Chiba University, Japan (Image source: https://agupubs.onlinelibrary.wiley.com/doi/10.1029/2025EA004666)

Conditional Diffusion Models for Global Precipitation Map Inpainting

Abstract

Incomplete satellite- based precipitation data is a major challenge for global monitoring. Products such as JAXAโ€™s Global Satellite Mapping of Precipitation (GSMaP) have large missing regions because polar- orbiting satellites carrying microwave sensors cannot observe the whole Earth at once. Existing interpolation methods often create spatial discontinuities.

The authors treat gap- filling as a video inpainting problem and introduce a conditional diffusion model. It uses a 3D U- Net plus a 3D condition encoder that incorporates infrared satellite images, latitude- longitude grids, and physical time information to reconstruct complete precipitation maps while preserving spatiotemporal consistency.

  • Training data: ERA5 hourly precipitation (2020- 2023). Pseudo- GSMaP gaps were created by randomly applying real GSMaP observation masks to the complete ERA5 fields.
  • Evaluation: Calendar year 2024.
  • Result: The method produces more spatiotemporally consistent inpainted maps than conventional techniques and other deep- learning baselines.

The work demonstrates the potential of conditional diffusion models to improve continuous global precipitation monitoring.

Key Points

The approach outperforms conventional and other deep- learning methods at filling unobserved regions.

High-fidelity global precipitation maps are needed, but polar- orbiting satellites leave spatiotemporal gaps.

A diffusion- model inpainting method based on a 3D U- Net achieves strong spatiotemporal consistency.

Plain- Language Summary

Polar-orbiting satellites cannot see the entire planet at once, so large parts of global rainfall maps are missing. Current gap- filling methods mainly use neighboring hours and often produce unrealistic โ€œseamsโ€ between observed and filled areas.

The team treats sequences of precipitation maps like video frames. A generative diffusion model learns to restore the missing parts by looking at nearby times, surrounding regions, and extra cues (infrared cloud images, geographic coordinates, and time).

Trained on complete reanalysis data with simulated satellite gaps (2020- 2023) and tested on 2024 data, the model fills gaps more smoothly and consistently than previous techniques.

Background and Motivation

Accurate, high- temporal- resolution global precipitation maps support extreme- weather mitigation, water- resource management, and policy.

Both GSMaP (JAXA) and IMERG (NASA) rely on microwave observations from polar- orbiting satellites and therefore contain large gaps. Conventional temporal interpolation prioritizes time consistency but neglects spatial consistency, producing discontinuities.

Method Overview

The approach is built on Denoising Diffusion Probabilistic Models (DDPM). A forward process gradually adds Gaussian noise; a reverse process learns to denoise and reconstruct the missing precipitation.

  • Architecture: 3D U- Net (captures space + time) guided by a 3D condition encoder.
  • Conditioning inputs: infrared cloud imagery, topographic data, latitude- longitude grids, and physical time.
  • These multi- modal features are injected at multiple scales into the U- Net encoder blocks.

Training uses complete ERA5 fields with realistic GSMaP- style masks applied. The model is evaluated for accuracy, image quality, and spatiotemporal consistency against conventional interpolation and other deep-learning models (standard U-Net, VAE, GAN).

Significance

The method yields higher- fidelity, more consistent global precipitation maps and can support near- real- time applications such as heavy- rain and flood monitoring, hydrological analysis, and disaster- risk reduction, especially valuable in regions with sparse ground observations.

A free preprint with the full text, equations, architecture details, sensitivity analyses, and experimental results is available on arXiv. The published AGU version may contain minor updates or additional supporting information.

Journal: Earth and Space Science

DOI: 10.1029/2025ea004666

Provided: Chiba University, (AGU)

Authors: Daiko Kishikawa, Yuka Muto, Shunji Kotsuki

First published: 24 September 2026

Illustration depicting the forward and reverse diffusion processes across multiple time steps, with world maps transitioning from blue to red, indicating changes in diffusion states.
An example of forward and reverse diffusion processes applied to a global precipitation map. Conditional Diffusion Models for Global Precipitation Map Inpainting – Kishikawa – 2026 – Earth and Space Science – Wiley Online Library

Europe Cooks With Gas; Africa Breathes Smoke

AI generated by Meta

From CO2 Coalition

By Vijay Jayaraj

In eastern Uganda, a mother can spend two hours a day gathering firewood to cook her familyโ€™s meals. Incredibly, 85% of Ugandan households still cook with wood and 13% depend on charcoal. Smoky indoor fires are estimated to cause thousands of premature deaths in the country every year, while clean-burning liquefied petroleum gas (LPG) reaches fewer than one home in a hundred. A billion sub-Saharan Africans are without clean fuel for cooking.

Standing between life and death is the European Investment Bank (EIB), the lending arm of the European Union that ended financing for fossil-fuel projects at the end of 2021. The World Bank runs a similar playbook. Last December, it issued a $200 million Clean Cooking Outcome Bond whose Ghana projects cover 245,000 electric cookers and 170,000 improved biomass stoves but not one LPG cylinder.

The body count Brussels ignores

According to the World Health Organization (WHO), household air pollution killed an estimated 2.9 million people in 2021. Soot from cooking fires has been blamed for nearly half of all deaths from lower respiratory infections in young children. Africa bears the heaviest share with an estimated 815,000 premature deaths a year.

WHO lists LPG and natural gas among the clean cooking fuels it wants expanded. The International Energy Agency (IEA) expects gas to supply more than 60% of the African households that gain access to clean cooking through 2040. Its roadmap calls for spending about $2 billion a year to introduce clean cooking to 80 million people annually.

So, the worldโ€™s leading health agency calls LPG clean. The worldโ€™s leading energy agency calls it the main pathway out of smoke. Which guidelines, then, are the EIB and World Bank following?

Gas for me, firewood for thee

Look inside a European home. The European Heating Industry counted roughly 76.4 million installed gas boilers across the EU in 2023. Liquid Gas Europe reported that LPG met the heating needs of more than 20 million EU citizens. Eurostat data show that natural gas still delivers nearly 30% of all energy consumed by EU households, more than any other source.

Did a single European family wait for a foreign lenderโ€™s blessing before trading coal stoves for gas burners in the last century? Of course not. Gas lifted Europeโ€™s women out of soot-filled kitchens, and they have never looked back.

Before the invasion of Ukraine, Russia supplied about 45% of the EUโ€™s gas and LNG imports. Brussels condemned Moscow and imposed sanctions. Yet the bloc imported a record 106 million metric tons of LNG in 2025, with Russia ranking as its second-largest supplier at about 14%.

The buying did not slow even as the ban approaches. In the first half of 2026, EU buyers took a record 9.97 million metric tons from Russiaโ€™s Yamal LNG plant, worth more than $6 billion and 16% above the year before, stocking up ahead of the full prohibition that begins at the beginning of 2027.

The double standard extends to Europeโ€™s closest partners. Norway, bound to the EU through the European Economic Area, places no ceiling on petroleum development. Oslo awarded 57 offshore production licenses in January, after issuing 53 in 2025 and 62 in 2024. Each license grants rights to explore, drill, and extract. Across six years, Norway has handed out 333 of them. You will search in vain for an EIB statement condemning any of it.

A bloc that pays a geopolitical adversary for gas has no moral standing to deny an African widow a cooking cylinder.

Patricia Nanteza, Africa coordinator at WePlanet, told the Monitor that LPG is the most accessible clean option families have in the near term and that lifting the ban would free more households from biomass. When climate campaigners themselves plead for financing of gas, the ban has lost its last defense.

The EIB and World Bank policies that protect their climate scorecards while African women devote half their lives carrying water and children are lost to early death. That trade carries no scientific, moral, or economic justification.

Originally published at American Thinker, October 19th, 2026.

Vijay Jayaraj is a Science and Research Associate at the CO2 Coalition, Fairfax, Virginia. He holds an M.S. in environmental sciences from the University of East Anglia and a postgraduate degree in energy management from Robert Gordon University, both in the U.K., and a bachelorโ€™s in engineering from Anna University, India. He served as a research associate with the Changing Oceans Research Unit at University of British Columbia, Canada.

When Climate Shaped Civilization: How Warming and the Younger Dryas Transformed the Natufian Culture

The Natufian culture was a late Epipalaeolithic archaeological culture of the Levant (West Asia), dating roughly from about 15,000- 11,500 years before present (cal BP), or approximately 13,000- 9,500 BCE.

The Natufian culture (roughly 15,000- 11,500 cal BP) developed and changed against a backdrop of major late Pleistocene climate oscillations in the Levant. Climate strongly influenced settlement patterns, mobility, resource use, and ultimately the path toward agriculture, though the exact mechanisms and degree of impact remain debated.

An illustrated depiction of the impact of climate change on Natufian culture, showing transition phases during the Bรธlling-Allerรธd warming and Younger Dryas cooling periods. The image features people gathering crops, structures representing settlements, and diverse landscapes indicating environmental changes.
AI generated by Grok

The Natufian culture was a late Epipalaeolithic archaeological culture of the Levant (West Asia), dating roughly from about 15,000- 11,500 years before present (cal BP), or approximately 13,000- 9,500 BCE.

It is named after Wadi en- Natuf (near Shuqba Cave in the West Bank), where British archaeologist Dorothy Garrod first identified it in 1928 during excavations.

Key Characteristics

The Natufians are especially notable as one of the earliest known societies to develop sedentary or semi-sedentary lifestyles while still relying primarily on hunting and gathering, before full agriculture. They are widely viewed as a transitional culture that set the stage for the Neolithic Revolution and the worldโ€™s earliest farming villages.โ 

  • Chronology: Commonly divided into Early Natufian (roughly 15,000/13,000- 13,000/11,500 cal BP) and Late Natufian (ending around 11,500 cal BP). The Late phase overlapped with the cooler, drier Younger Dryas climatic period.โ 
  • Geography: Centered in the Levant, modern- day Israel, the Palestinian territories, Jordan, Lebanon, and parts of Syria (with some extension toward the Euphrates). Key zones included the Mediterranean woodland hills, the Jordan Valley, and adjacent steppe areas.
  • Subsistence: Intensive hunting (especially gazelle) and gathering of wild plants, particularly cereals (wild barley, wheat, rye), nuts, legumes, and other seeds. They used flint sickle blades (often with characteristic sheen from plant cutting) set in bone or wood handles, plus abundant ground- stone tools (mortars, pestles, grinding slabs) for processing plants. Evidence includes early bread- like remains (e.g., at Shubayqa 1 in Jordan, ~14,400 years ago) and possible fermented cereal residues (e.g., at Raqefet Cave). Some sites show possible low-level cultivation or intensive management of wild cereals, though full domestication came later. Dogs appear as the earliest domesticates.โ 
  • Settlement and Architecture: Semi- sedentary base camps and hamlets with circular or oval semi-subterranean dwellings featuring stone foundations, hearths, postholes, and sometimes storage features. Larger open- air sites (such as สฟAin Mallaha (Eynan), el-Wad, and Wadi Hammeh 27) show repeated, long- term occupation. Caves and rock shelters were also used.โ 
  • Technology and Material Culture: Geometric microliths (especially lunates) are diagnostic. Rich bone- tool assemblages (including sickles), personal ornaments (shell beads, especially dentalium), and art (carved bone and stone figures, abstract designs, and rare figurative pieces such as the โ€œAin Sakhri Loversโ€). Long- distance exchange of materials occurred.
  • Burial Practices and Social Life: Cemeteries within or near settlements, often with personal ornaments. Some evidence of secondary burial, skull treatment, and possible social differentiation. Ritual and symbolic behavior intensified, including possible feasting.

Significance and Major Sites

The Natufian marks a shift toward greater sedentism, intensified plant use, more complex social organization, and ritual investment. These changes occurred among the last purely foraging societies in the region before farming communities appeared. Successors include the Harifian (in the south) and the Pre-Pottery Neolithic (PPNA).โ 

Important sites include:

  • Shuqba Cave (type site)
  • สฟAin Mallaha (Eynan)
  • el-Wad, Hayonim, and Raqefet Cave (Mount Carmel area)
  • Beidha
  • Tell Abu Hureyra
  • Wadi Hammeh 27 (an Early Natufian open- air settlement near Pella, Jordan, with substantial architecture and recent finds of foundational burials)โ 

In short, the Natufians represent a pivotal โ€œthresholdโ€ culture in human prehistory, bridging mobile Paleolithic foragers and the settled agricultural societies of the Neolithic Near East.

Map highlighting archaeological sites and regions along the eastern shore of the Sea of Galilee, with labels such as Abu Hureyra, Eynan, and Ein Gev.
A map of the Levant with Natufian regions across present-day Israel, the Palestinian territories, Jordan, Sinai, and a long arm extending into Lebanon and Syria

Wadi Hammeh 27 is indeed a significant Late Epipalaeolithic archaeological site near Pella (Tabaqat Fahl) in the Jordan Valley, Jordan. It preserves remains of a substantial Early Natufian settlement dating roughly to 14,500- 14,000 years ago (cal BP).

Key points that match and expand on the description:

  • It belongs to the Early Natufian phase of the Natufian culture (part of the broader Epipalaeolithic sequence in the Levant).
  • Excavations (notably by Phillip Edwards and others) uncovered evidence of a relatively large, semi-sedentary community, including multiple structures, hearths, and dense concentrations of cultural material.
  • Finds typically include ground- stone tools (mortars, pestles), microliths, bone tools, ornaments, and abundant faunal and botanical remains that illuminate early steps toward sedentism and intensive plant use in the region.
  • The site sits in the Wadi al- Hammeh drainage and is one of the better- preserved Early Natufian open- air settlements known from Jordan.
Ancient stone ruins on a hillside with two people exploring the site and a desert landscape in the background.
Protruding bastion along the line of the main inner wall at Khirbat al-Batrawy.
Image Gallery | Archaeology in Jordan, 2014 and 2015 Seasons | American Journal of Archaeology

Wadi Hammeh 27 chronology

Wadi Hammeh 27 is firmly dated to the Early Natufian period. The settlement was occupied for a relatively short span of roughly 500 years.

Key dating summary

  • Overall range: Approximately 12,500- 12,000 cal BC (or about 14,500- 14,000 years ago / cal BP).
    This places it firmly in the Early Natufian, before the onset of the Younger Dryas.โ 
  • Radiocarbon evidence (main AMS dates from carbonized seeds and other organic material):
    • Classic dates from Phase 1 (uppermost occupation):
      • OxA-393: 11,920 ยฑ 150 BP
      • OxA-507: 11,950 ยฑ 160 BP
      • OxA-394: 12,200 ยฑ 160 BP
        These calibrate to roughly 12,000- 11,500 cal BC (with broader ranges possible).โ 
    • Newer AMS dates from Phase 4 (foundational layers and burials, published in recent work):
      • Around 12,290- 12,438 BP, calibrating to approximately 12,700- 12,200 cal BC.
        These support an initial foundation of the burial ground and earliest occupation near 12,500 BCE.

Stratigraphic phases

The site has four main occupation phases (from lowest to highest):

  • Phase 4 (basal): Foundational burials established on travertine/bedrock (~12,500 BCE). Houses were later built directly over these graves. No further burials occurred after this phase.
  • Phases 3- 2: Intermediate architectural phases with continued occupation and commemorative features over the original graves.
  • Phase 1 (uppermost): Final substantial occupation with large oval stone dwellings, ending around 12,000 cal BC.

The entire sequence represents continuous or repeated use of the same location as a substantial โ€œbase campโ€ for several centuries, after which the site was abandoned. Sedimentation continued in the wadi after abandonment (e.g., Melanopsis shell date of ~11,100 BP).

In short, Wadi Hammeh 27 is one of the best-dated and earliest large open- air Early Natufian settlements in the southern Levant, spanning the later part of the Bรธllingโ€“ Allerรธd warming phase.

Map showing archaeological sites in the Levant region, featuring location markers and topographical details.
Map of the distribution of Natufian sites
Modeling identities among the first-sedentary communities: Emergence of clay personal ornaments in Epipaleolithic Southwest Asia | Science Advances

Wadi Hammeh 27 Climate Timeline

Wadi Hammeh 27 (Early Natufian, ~12,500- 12,000 cal BC / ~14,500- 14,000 cal BP) was occupied entirely during the later part of the Bรธlling- Allerรธd interstadial, a relatively warm and moist climatic phase that followed the Last Glacial Maximum. The site was abandoned before the full onset of the colder Younger Dryas.

Timeline (calibrated years)

PeriodApproximate DatesClimate ConditionsRelation to Wadi Hammeh 27
Late Glacial Maximum & early deglaciationBefore ~14,700 cal BPCold and relatively dryPre- occupation
Bรธlling- Allerรธd interstadial (warming)~14,700- 12,900 cal BPWarmer and wetter than preceding glacial conditions; expanded Mediterranean woodlands, higher lake levels in the region, increased plant productivity (wild cereals, oak, pistachio, etc.)Full occupation of the site (~12,500โ€“12,000 cal BC). Favorable conditions supported semi- sedentary base-camp life with substantial architecture, intensive plant harvesting (wild barley, etc.), and rich resource base. Local environment was moister than today, possibly with a nearby freshwater lake or high-water table.
Onset of Younger Dryas~12,900- 12,700 cal BPRapid cooling begins (globally colder; in the Levant often cooler, with debated degree of drying)Site occupation ends around or just before this transition (~12,000 cal BC). No clear evidence of occupation continuing into the full Younger Dryas.
Younger Dryas~12,900- 11,500 cal BPCooler (and in many reconstructions drier or with altered seasonality)Post- abandonment. The site was no longer occupied.
Early Holocene warmingAfter ~11,500 cal BPRapid return to warmer and wetter conditionsLong after the site was abandoned

Local environmental notes for the site

  • During occupation the surrounding landscape was more humid than the modern arid Jordan Valley, supporting oak woodland elements, wild cereals (especially barley), pistachios, lentils, and other edible plants.
  • The site sat in a spring- fed wadi system. Some researchers suggest it may have overlooked a temporary freshwater lake (sometimes called โ€œDamya Lakeโ€) or experienced elevated water levels related to the late stages of Lake Lisan.
  • After abandonment (~12,000 cal BC), regional lake levels continued to change, and the wadi eventually incised as base levels dropped following the final drying of Lake Lisan around 11,000 BP.

In short, Wadi Hammeh 27 flourished under the relatively benign, resource -rich conditions of the late Bรธlling- Allerรธd warming and was deserted before the climatic stress of the Younger Dryas fully set in. This places it among the classic Early Natufian settlements that benefited from the post- glacial climatic amelioration.

Graph depicting air temperatures in Greenland over the last 20,000 years, highlighting key periods: LGM, Pleistocene, Holocene, and significant climatic events such as Heinrich Event 1 and the 8.2 cold event. Below, a timeline of cultural periods from Kebaran to Iron Age.
The Natufian appeared at the time of the Bรธllingโ€“Allerรธd warming, before temperatures dropped drastically again during the Younger Dryas. Temperatures would rise again at the end of the Younger Dryas, and with the onset of the Holocene and the Neolithic Revolution. Climate and Post-Glacial expansion in the Near East, based on the analysis of Greenland ice cores.[11]
Climate and Post-Glacial expansion in the Near East – Natufian culture – Wikipedia

The Natufian culture (roughly 15,000- 11,500 cal BP) developed and changed against a backdrop of major late Pleistocene climate oscillations in the Levant. Climate strongly influenced settlement patterns, mobility, resource use, and ultimately the path toward agriculture, though the exact mechanisms and degree of impact remain debated.

Climatic Context

The Natufian spanned the transition from the end of the Last Glacial Maximum into the early Holocene, encompassing:

  • Bรธlling- Allerรธd interstadial (roughly 14,700- 12,900 cal BP): A warmer and generally wetter phase that supported expanded Mediterranean woodlands (oak- pistachio forests) and abundant wild plant resources, including cereals. This period largely coincides with the Early Natufian.โ 
  • Younger Dryas (YD) (roughly 12,900- 11,500 cal BP): A sharp, globally recognized return to colder conditions lasting about 1,200- 1,500 years (somewhat longer or differently expressed in the Levant). The Late Natufian largely overlaps with this event.โ 
  • Onset of the Holocene: Rapid warming and wetter conditions after ~11,500 cal BP, coinciding with the end of the Natufian and the rise of the Pre- Pottery Neolithic A (PPNA).

Paleoclimate reconstructions (from pollen, speleothems, lake levels, charcoal, and isotopic data from gazelle teeth) show the Early Natufian flourished under relatively favorable conditions: higher precipitation (sometimes exceeding modern levels in places) and temperatures closer to or slightly below present- day values, fostering productive woodlands and cereal stands.

During the Younger Dryas, conditions became cooler (especially during the growing season). Traditional models emphasized strong drying and contraction of woodlands, but more recent isotopic evidence from gazelle tooth enamel indicates cooling without significant aridification in the southern Levant, water availability for plants remained similar or even higher than in the preceding phase. Seasonal contrasts may have been reduced, with potential effects on cereal productivity and harvest timing.

Climate Impacts on Natufian Culture

Early Natufian (warmer and wetter phase):

Favorable climate supported greater sedentism. Larger base camps and hamlets with durable stone architecture (e.g., Wadi Hammeh 27, สฟAin Mallaha) appeared, along with intensified plant processing (sickles, ground stone tools) and denser occupation. Resource abundance in Mediterranean woodlands and the Jordan Valley enabled semi- permanent settlements.

Late Natufian (Younger Dryas):


Cooler conditions are linked to shifts toward greater residential mobility, smaller or more dispersed sites in some areas, changes in burial practices, and possible intensification or broadening of diets (more small game, birds, or alternative plants). Some groups may have moved toward more climatically buffered zones such as the Jordan Valley, where wild cereals remained more productive. Site distributions show expansion into certain steppe or desert- margin areas.โ 

Not all researchers see the YD as a severe crisis that forced agriculture. Some argue Late Natufians successfully adapted through increased mobility and demographic adjustments rather than immediate cultivation. Continuity of occupation exists in many regions, and the Levant may have served as a refugium.โ 

Link to the origins of agriculture:


A long- standing hypothesis holds that YD stress on wild cereal stands (reduced productivity or reliability due to cooler temperatures) pressured sedentary populations, who had become dependent on these resources, to begin more intensive management or early cultivation. This is thought to have contributed to the emergence of farming in the subsequent PPNA after the climate improved. Other views emphasize that Natufians remained successful foragers throughout the YD and that agriculture arose more gradually under improving early Holocene conditions, or through a combination of social, demographic, and environmental factors.

Summary of Key Dynamics

Climate acted as an important but not sole driver.

The warm and wet Bรธlling- Allerรธd facilitated the Early Natufian florescence of sedentism and plant intensification.

The cooler Younger Dryas prompted adaptive responses (greater mobility in some areas, possible settlement shifts) without fully collapsing the culture.

The rapid post- YD warming then coincided with the transition to Neolithic farming villages. Regional variation was significant, Mediterranean core areas, the Jordan Valley, and peripheral steppes responded differently, and ongoing research continues to refine local climate reconstructions and their precise cultural correlations.

Mother Jones Blames Climate Change For Mass Migration, Data and Migrants Prove Them Wrong

A recent post at far-left news outlet Mother Jones, โ€œThereโ€™s a Powerful, Hidden Force Behind Migration: Climate Change,โ€ claims that climate change is a powerful driver of mass migration from the third world. This is false. The migrants themselves who were interviewed only bring up weather at all when pressed to do so, economic factors are the usually cited reasons for both illegal and legal attempts at migration to western countries. Extreme weather is not at all new to the regions discussed.

Text on a news article header discussing climate change and mass migration, with a desert landscape and a border fence in the background.
AI generated by Meta

From ClimateRealism

By Linnea Lueken

A vast desert landscape featuring undulating sand dunes in warm tones, with greenery and a small settlement visible in the foreground, set against a backdrop of distant mountains and a partly cloudy sky.

A recent post at far-left news outlet Mother Jones, โ€œThereโ€™s a Powerful, Hidden Force Behind Migration: Climate Change,โ€ claims that climate change is a powerful driver of mass migration from the third world. This is false. The migrants themselves who were interviewed only bring up weather at all when pressed to do so, economic factors are the usually cited reasons for both illegal and legal attempts at migration to western countries. Extreme weather is not at all new to the regions discussed.

The author claims that recent mass migration to Spain and other countries from places like Morocco is secretly being spurred on by climate change, and suggests that media does not often discuss that factor. This is immediately absurd, of course, because the mainstream media often cites climate change as a driver of both legal and illegal immigration. Climate Realism has recently debunked such claims regarding migrants from Somalia, here, for instance.

Undermining the initial claim of the headline and introduction, the author admits โ€œ[t]hat is not to say that the effects of climate change caused tens of thousands of people to risk their lives by attempting to swim to Ceuta. Economic forces were much more urgent motivators for Mohamed to leave his home.โ€

The migrant interviewed by Mother Jones says that the reason he is trying to leave Morocco is because of limited job opportunities. He does not mention climate change at all. But the author goes on to insist โ€œafter another summer of extreme temperatures and wildfires in the northern and southeastern provinces in Morocco, severe flash flooding and landslides in rural communities throughout the High Atlas Mountains, and the culmination of a seven-year drought after a winter of heavy rainfall across the country, climate change also may be an underlying factor in creating the economic crisis forcing so many to leave their homes.โ€

This is completely backwards. The reason these severe weather events have such a large impact on Morocco and other poorer countries is because they are weak economically in the first place, making it difficult or impossible for communities to invest in weather hardened infrastructure. The cited extreme weather events are not new to the region, and happen all around the world regardless of climate change.

Flash flooding is a feature of desert environments, once dry seasons are over. Likewise, drought for that matter is an obvious feature of the desert, especially lengthy droughts, which the author admits recently came to an end. Alternating periods of extended drought and deluge are the norm for Morocco in particular. The southeastern Morocco desert has recently seen dry lakebeds refill with water, when they have been mostly empty for a long time due to the recent drought period. Those lakebeds would not be there in the first place if they did not sometimes fill. Trying to claim that these natural patterns are evidence of climate change is nonsense.

As for the wildfires, again wildfire is not new to the region, and data from the joint NASA and European Space Agency joint project Copernicus show that there is no trend towards worsening wildfires in Morocco, neither in area burned nor number of fires. (See figure below)

A line and bar graph showing the yearly burned area in hectares (ha) and the yearly number of fires from 2002 to 2024. The bars represent the burned area, and the line indicates the number of fires per year.
Figure 1: Morocco Yearly burned area and number of fires, 2002-2024. Chart from Copernicus, https://gwis.jrc.ec.europa.eu/apps/country.profile/charts/ba

Despite 2022 seeing a record bad fire year, 2024 was a record low for wildfires in Morocco since records begin in 2002 according to Copernicus data. Mother Jones is not interested in that, only the high years.  Good scientists would not claim that 2024 represented a trend towards the elimination of wildfire, and likewise 2022 is not indicative of a trend towards climate catastrophe.

The Mother Jones post goes on to make the dubious claim that โ€œNorth Africa and the Middle East are warming faster than the rest of the world, and Moroccoโ€™s agricultural sectorโ€”the cornerstone of the countryโ€™s economyโ€”is particularly vulnerable to climate impacts like soil degradation and depleted groundwater.โ€

As discussed in โ€œNo, Atlantic Council, Climate Change is Not Making the Middle East and North Africa โ€œUnlivableโ€,โ€ even if the dubious claim that those regions are โ€œwarming faster than the rest of the world,โ€ which has been claimed about every region of the whole world, the Middle East and North Africa have actually been seeing improving economic and agricultural conditions amid modern warming, disturbed only when violence and political unrest occur.

Soil degradation and depleted groundwater are resource management impacts, not climate impacts. For example, the same claim was made about depleted water resources in Nigeria, but population growth stressing the water supply around Lake Chad and other countries upriver building dams were the real cause. Natural drought under those conditions is bound to make things worse.

The most notable part of this article is the straightforward dismissal of the actual complaints of the migrants themselves, in order to push the climate claim. The so-called experts that the author interviews insist basically that the migrants donโ€™t know what they are talking about, that climate change is the real background issue, instead of things like political corruption and violence making economies unstable in the region and hindering development.

The data do not show anything unprecedented happening with the weather, but it is clear that Mother Jones is not interested in facts.

โ€œBomb Carbonโ€ from 1960s Tree Rings Reveals Biochar Stays Locked in Soil for Centuries

Researchers at the Swedish University of Agricultural Sciences (SLU) developed a method using โ€œbomb carbonโ€ (elevated radiocarbon- 14 from 1960s atmospheric nuclear tests, preserved in tree rings) in wood shavings to track how stable biochar is when added to soil.

Close-up of a tree stump with a spotlight on 'Bomb Carbon 14C', showing bark and soil. In the background, a field of crops grows under a blue sky with clouds. The image suggests themes of carbon sequestration and environmental impact.
AI generated by Grok

Researchers at the Swedish University of Agricultural Sciences (SLU) developed a method using โ€œbomb carbonโ€ (elevated radiocarbon- 14 from 1960s atmospheric nuclear tests, preserved in tree rings) in wood shavings to track how stable biochar is when added to soil.

Biochar is a charcoal- like material produced by heating biomass (here, wood) in low- oxygen conditions (pyrolysis). It is of interest for improving soil properties and as a potential long-t erm carbon sink to help mitigate climate change, with global estimates suggesting it could sequester carbon equivalent to roughly 6- 16% of annual anthropogenic COโ‚‚ emissions. A key uncertainty has been how quickly biochar mineralizes (breaks down into COโ‚‚) in soil versus remaining stable for decades or centuries, and how to distinguish its contribution from native soil organic matter.

The method

Atmospheric nuclear testing in the 1950s- 1960s roughly doubled atmospheric ยนโดC levels, peaking around the mid-1960s. Tree rings from 1964-1967 therefore contain elevated โ€œbombโ€ ยนโดC. SLU researchers selected mature Norway spruce and Scots pine trunks from a Swedish clear- cut, identified the relevant rings, and used a professional woodturner to carefully remove outer wood and collect the thin, high-ยนโดC layers as shavings. These were pyrolyzed into biochar (tested at highest treatment temperatures of ~400ยฐC and 650ยฐC).

The resulting biochar had enough ยนโดC enrichment (on average ~61.7 percent modern carbon higher than bulk soil organic matter in one report) to serve as a natural tracer. In a one-year laboratory incubation, they mixed it into soil (at 2% by dry mass), trapped emitted COโ‚‚, and measured its ยนโดC signature via accelerator mass spectrometry. This allowed them to quantify the share of COโ‚‚ coming from the biochar versus the soil.

Key findings

  • COโ‚‚ from biochar- amended soil showed up to about 10% higher ยนโดC than controls, confirming a small but measurable contribution from the biochar.
  • Roughly 0.35% of the added biochar carbon converted to COโ‚‚ over one year.
  • This implies high stability: at least half of the buried biochar is projected to remain in the soil after ~200 years (under the study conditions).
  • The method works with mature wood feedstock that resembles commercial biochars, offers higher precision than some natural- abundance ยนยณC approaches, and avoids the need for expensive artificial isotopic labeling.

The work was published in Radiocarbon (Li et al., 2026: โ€œBomb ยนโดC for tracing biochar mineralization in soilโ€). It was funded in part by Swedenโ€™s Bio+ program (Swedish Energy Agency). Follow- up research is planned to examine biochar stability under climate- change scenarios in collaboration with researchers in Germany.โ 

This approach provides a practical way to study biochar persistence, its interactions with soil organic matter, and its viability for carbon sequestration without relying solely on short- term incubations or complex lab labeling.

A person using a wood lathe in a workshop, wearing safety glasses and ear protection, with wood shavings flying around.
To obtain wood formed during the years 1964โ€“1967, the researchers engaged professional woodturner and wood artist ร…ke Landstrรถm from Glanshammar. Credit: Harald Cederlund

Bomb 14C for tracing biochar mineralization in soil

This is the open- access research article โ€œBomb ยนโดC for tracing biochar mineralization in soilโ€ by Haichao Li, Harald Cederlund, Elias S. Azzi, Cecilia Sundberg, and Erik Karltun (Swedish University of Agricultural Sciences), published online 23 September 2026 in Radiocarbon (Volume 68, Issue 5, pp. 1146- 1154).

It is freely available under a Creative Commons Attribution (CC- BY) licence.

Core contribution

The authors introduce and validate a practical isotopic- tracing method that uses naturally elevated โ€œbombโ€ radiocarbon (ยนโดC) preserved in tree rings formed during the atmospheric nuclear- test peak (1964- 1967). Biochar made from this wood carries a clear ยนโดC signature that can be distinguished from soil organic matter (SOM), allowing precise quantification of how much of the COโ‚‚ released from soil comes from the biochar itself.

Methods (summary)

  • Mature Norway spruce and Scots pine trunks (โ‰ฅ70 years old) were collected from a clear- cut near Uppsala, Sweden.
  • Annual rings from 1964- 1967 were identified by counting and carefully isolated by professional woodturning (producing shavings).
  • Biochar was produced by pyrolysis under Nโ‚‚ at highest treatment temperatures of 400 ยฐC (BC400) and 650 ยฐC (BC650). The feedstock with the highest ยนโดC enrichment (~172.9 pMC) was selected.
  • Biochars were acid- washed to remove carbonates, ground (<2 mm), and mixed into a loamy- sand agricultural soil (Cambisol, 1.4 % SOC) at a 2 % (w/w) application rate.
  • Soils were incubated for 365 days at ~20.7 ยฐC and 60 % water- holding capacity. Emitted COโ‚‚ was trapped in NaOH and analysed for total C and ยนโดC (AMS) at multiple time points.
  • An isotope-mixing model calculated the biochar- derived fraction of respired COโ‚‚. Priming effects on native SOC were also quantified.

Key results

  • Biochar was on average 61.7 pMC higher in ยนโดC than bulk soil organic matter, providing a clear tracer signal.
  • ยนโดCOโ‚‚ from biochar- amended soils was consistently and significantly higher than from controls (p < 0.0001).
  • Early in the incubation (first 2 weeks) 8.3- 11.4 % of mineralized COโ‚‚- C came from biochar; later this fell to 2.3- 7.5 %.
  • After one year, only 0.32 ยฑ 0.02 % (BC400) and 0.35 ยฑ 0.01 % (BC650) of the added biochar carbon had been mineralized. The two pyrolysis temperatures did not differ significantly.
  • BC650 produced a measurable negative priming effect on native soil organic carbon (โ€“129 ยฑ 20 mg COโ‚‚-C kgโปยน, or ~14.8 % relative to the control); BC400 showed essentially none.

Advantages claimed over other isotopic approaches

  • Higher precision than the natural- abundance ยนยณC (Cโ‚ƒ/Cโ‚„) method for detecting small biochar contributions.
  • Works with mature wood feedstock that closely resembles commercial biochars (unlike many laboratory pulse- labelled materials derived from young seedlings).
  • Relatively low cost and does not require specialised isotope-labelling facilities.
  • Uniform ยนโดC enrichment because the trees grew continuously under elevated atmospheric ยนโดC.

Conclusions

The bomb-ยนโดC method is shown to be effective for quantifying biochar mineralisation and its interactions with soil organic matter. It opens practical possibilities for longer- term studies of biochar persistence and carbon-sequestration potential under realistic conditions.

The paper includes supplementary material with additional figures on priming and sensitivity analyses. Funding came in part from the Swedish Energy Agencyโ€™s Bio+ programme.

Close-up of a cross-section of a tree trunk showcasing concentric growth rings with a small central hole, against a black background. The growth rings feature a red marking labeled 'S2'.
Log with younger wood turned away. The wood with the highest content of ‘bomb carbon’ is found in the growth rings between the red circles. Credit: Harald Cederlund

Journal: Radiocarbon (Volume 68, Issue 5, pp. 1146โ€“1154)

DOI: 10.1017/rdc.2026.10247

Provided: Swedish University of Agricultural Sciences

Authors: Haichao Li,

Harald Cederlund,

Elias S. Azzi,

Cecilia Sundberg and

Erik Karltun

Abstract

Improving our understanding of biochar carbon (C) stability in soil is crucial given its potential for soil C sequestration. However, challenges with isotopic labeling of biochar restrict our ability to determine its fate in soil. Atmospheric nuclear bomb tests in the 1960s resulted in a 14C spike in tree rings, providing an opportunity to address this challenge. Here, we present a method that utilizes the elevated levels of 14C in wood from tree rings formed between 1964 and 1967 as a tracer to determine the proportion of biochar C in mineralized soil. Biochar was produced using wood from the 14C enriched tree rings as feedstock and thereafter used in a mineralization experiment capturing the emitted CO2. We demonstrate that the bomb 14C-enrichment in the biochar is high enough to differentiate between CO2 originating from either biochar or soil organic matter mineralization. The method can be used to address questions on biochar persistence, its interactions with soil organic matter and research that is needed to explore the potential to use biochar for C sequestration in soils.

The AI policy debate suffers from a dangerous plague of vagueness

“AI” is too broad to regulate as one thing. None of those everyday AI systems are actually what people are arguing about when they call for regulation, so just saying “AI” is way off the mark.

Because we “literally do not know what we are talking about,” policies passed in panic could be highly destructive.

A misty legislative chamber with shadows of people conversing around a podium, featuring words like 'AI', 'pause', 'race', and 'regulation' in the background.

By CFACT

By David Wojick

A robot holding a sign that says 'No AI' at a protest in an urban setting, surrounded by a crowd of demonstrators.
Protest against ai technology robot holding no ai sign amidst determined crowd in urban setting

Debating policies in a rational manner requires a clear specification of the thing under consideration for regulation. The AI debate has nothing like that.

The AI debate does not even name the thing under discussion, as it is certainly not AI per se. Not being able to name the thing you are talking about is impossibly vague when it comes to policy making.

The field of AI is over 70 years old, and it has spawned a lot of different technologies, which are not part of the policy issue, so simply talking about AI is way off the mark.

Chess-playing machines that can beat grandmasters are an early example. There are now lots of AI game systems. My favorite is the blackjack program that saved me a lot of money by showing me I was no good at that gambling game.

In the late 1980s, expert systems became prominent. More recently, we got things like automated customer service systems and GPS routing systems. Now we have automated cars and military fighter drones. None of these are part of the AI policy discussion, nor are countless other AI systems in everyday use.

The AI issue mostly started with chatbots, which are typically called large language models (LLMs), so these are a good starting point. But there are lots of LLMs, some of which seem pretty harmless. The little AI summary that comes with each Google search, for example.

Plus, there are other AI systems besides LLMs that may be of concern. Examples include generative AI, diffusion models, and the interesting-sounding generative adversarial networks.

Then, too, there are AI agents that use models to perform instructed tasks. Concern about agents recently arose when a bunch started working together without being instructed to do so. We have no idea how many such systems exist.

The first thing a policy, law, or regulation must do is make clear who or what is covered and not covered. This is why regulations often have lengthy definition sections. They often create their own language in order to clearly specify the rules they state.

The AI policy debate has no such specificity. The things under discussion are not even named in many cases. As a Chinese philosopher friend of mine used to say, โ€œWe are talking in a vacuum.โ€ Specifically, a cognitive vacuum which lacks needed substance.

Absent a clear specification of what we mean, any rules passed are likely to simply create destructive paralysis and confusion.

For example, people are talking about a pause in AI development. Which AI development? For that matter, what counts as AI development? This is another empty concept.

Letโ€™s take Google. Last year, its R&D spending was over $60 billion. How much is AI related such that it would be paused? Some of it is labeled as AI development, but a lot of it is directly related to developments that have AI aspects, such as AI data centers.

It all depends on how AI is defined for the purposes of the pause, and there is not a shadow of a definition at this point. The potential for destructive confusion is immense. AI-related industry could run to trillions of dollars.

At the same time, there is much talk about an AI race, especially between America and China. I have yet to see this race defined or explained. Race to do what? What does winning look like? How are we doing?

It is not like there is going to be just one AI system, rendering all others obsolete. AI is a huge industrial domain with a vast number of diverse products. What then is this race?

The whole AI policy debate borders on being incoherent because we literally do not know what we are talking about. This is very dangerous because incoherent policies passed in panic can be highly destructive.

Hunter-Killer Membrane Destroys Forever Chemicals with Over 90% Efficiency

Researchers at Arizona State University (led by Bruce Rittmann of the Biodesign Swette Center for Environmental Biotechnology), with collaborators from Rice University, Tongji University, the National University of Singapore, and Nanjing University, developed a catalytic โ€œhunter- killerโ€ membrane that both captures and chemically destroys PFAS (โ€œforever chemicalsโ€) rather than just concentrating them.

The membrane technology developed by Arizona State University researchers (led by Bruce Rittmann) and international collaborators is a catalytic hollow-fiber membrane system designed to both capture and chemically destroy PFAS (โ€œforever chemicalsโ€).

Diagram illustrating the Hunter-Killer Membrane technology, showcasing its ability to destroy PFAS chemicals with over 90% efficiency using palladium nanoparticles and hollow-fiber membranes.
AI generated by Grok

Researchers at Arizona State University (led by Bruce Rittmann of the Biodesign Swette Center for Environmental Biotechnology), with collaborators from Rice University, Tongji University, the National University of Singapore, and Nanjing University, developed a catalytic โ€œhunter- killerโ€ membrane that both captures and chemically destroys PFAS (โ€œforever chemicalsโ€) rather than just concentrating them.

PFAS are synthetic compounds used in nonstick coatings, waterproof fabrics, firefighting foams, and many other products. Their extreme persistence comes from very strong carbon- fluorine bonds (often called the strongest in organic chemistry), which shield the carbon backbone and resist breakdown by conventional biological or chemical processes. Standard treatments (activated carbon, ion exchange, membrane filtration) remove them from water but leave concentrated waste that still needs disposal or destruction.

How the technology works

  • Hollow- fiber membranes are coated on the outside with palladium nanoparticles.
  • Pressurized hydrogen gas is fed through the interior of the fibers and diffuses outward to the palladium catalyst.
  • The palladium splits Hโ‚‚ into highly reactive hydrogen atoms.
  • PFAS molecules from the surrounding water adsorb onto the same palladium surface.
  • At the catalyst surface, the reactive hydrogen attacks and breaks the C- F bonds (hydrodefluorination), stripping fluorine and converting the persistent molecules into less harmful components.

This โ€œinside- outโ€ hydrogen delivery is a key design feature: the membrane both concentrates the pollutants at the reactive surface and supplies the activated hydrogen needed to dismantle them.

Performance results

In a continuous 58- day laboratory test treating a mixture of six regulated- priority PFAS compounds, the system removed more than 90% of each compound and stripped away about 83% of the total fluorine, confirming actual chemical destruction rather than simple filtration. Rittmann described the mechanism as essentially universal across the six compounds tested.

Practical considerations and next steps

Palladium is expensive (roughly $50,000 per kilogram), so reducing catalyst loading is a major research priority. The approach is envisioned as a complement to existing concentration methods: conventional filtration would first shrink large volumes of contaminated water into a smaller waste stream that the catalytic membrane then destroys. Hybrid systems pairing the palladium catalyst with pollutant- degrading bacteria are also under development.โ 

This builds on earlier ASU work with membrane biofilm reactors (MBfR) and membrane catalyst- film reactors (MCfR) that combine catalytic defluorination with microbial degradation. While further engineering is needed for full- scale water treatment, the results demonstrate a promising route to permanently break down these persistent pollutants.
A digital illustration showing a molecular structure interacting with a membrane, featuring clusters of atoms and various colored molecules above the surface.
A palladium-coated membrane uses hydrogen to help break down PFAS “forever chemicals.” Credit: Jason Drees

The membrane technology developed by Arizona State University researchers (led by Bruce Rittmann) and international collaborators is a catalytic hollow- fiber membrane system designed to both capture and chemically destroy PFAS (โ€œforever chemicalsโ€).

Core design

  • Hollow- fiber membranes: Tiny tubular (โ€œstraw-likeโ€) gas- transfer membranes.
  • Palladium nanoparticle coating: A thin layer of palladium nanoparticles is deposited on the outside of the fibers. Palladium acts as a catalyst.
  • Hydrogen delivery: Pressurized hydrogen gas (Hโ‚‚) is fed through the inside of the hollow fibers. It diffuses outward through the membrane wall to the palladium layer.

How it works (โ€œhunter- killerโ€ mechanism)

  1. Hydrogen reaches the palladium surface and is split into highly reactive atomic hydrogen.
  2. PFAS molecules in the surrounding water adsorb onto the same palladium surface.
  3. At the catalyst surface the reactive hydrogen attacks the strong carbon- fluorine bonds (hydrodefluorination), stripping fluorine atoms from the PFAS molecules.
  4. This breaks the โ€œforeverโ€ chemical structure, converting the compounds into less persistent (and ultimately more biodegradable) products.

The inside- out hydrogen supply is a key innovation: the membrane simultaneously concentrates the pollutants at the reactive surface and delivers the activated hydrogen needed to destroy them.

Performance

In a continuous 58- day laboratory trial treating a mixture of six regulated- priority PFAS compounds, the system:

  • Removed >90% of each individual PFAS.
  • Stripped ~83% of the total fluorine (confirming actual chemical destruction rather than mere capture).

Context and next steps

This builds on earlier ASU membrane technologies (Membrane Biofilm Reactor- MBfR and Membrane Catalyst- film Reactor- MCfR). Hybrid versions that combine the palladium catalyst with pollutant-degrading bacteria are also under development.

Main practical hurdle: Palladium is expensive (~$50,000/kg), so reducing catalyst loading is a priority. The technology is expected to work best as a polishing/destruction step after conventional concentration methods (e.g., activated carbon or ion exchange) have first reduced the volume of contaminated water.

The research was published in the Proceedings of the National Academy of Sciences in October 2026.

Catalytic reactive-hydrogen membranes for rapid capture and hydrodefluorination of six PFAS of regulatory concern

This peer- reviewed paper reports the development and continuous testing of a hydrogen- based Membrane Catalyst -film Reactor (MCfR) for simultaneous capture and destruction of PFAS (โ€œforever chemicalsโ€).

It reports the development and continuous testing of a hydrogen- based Membrane Catalyst- film Reactor (MCfR) for simultaneous capture and destruction of PFAS (โ€œforever chemicalsโ€).

Key elements of the paper (from published summaries)

  • Lead institution & author: Arizona State Universityโ€™s Biodesign Swette Center for Environmental Biotechnology; senior/corresponding author Bruce E. Rittmann.
  • Collaborators: Researchers from Rice University (Texas), Tongji University (China), National University of Singapore, and Nanjing University (China).
  • Technology: Hollow- fiber gas- transfer membranes coated on the exterior with palladium (Pd) nanoparticles. Hydrogen gas is supplied from the lumen (inside) of the fibers, diffuses outward, and is activated on the Pd surface. PFAS molecules adsorb to the same surface, enabling catalytic hydrodefluorination (breaking of strong C- F bonds by reactive hydrogen).
  • Results: In a continuous 58- day operation treating a mixture of six regulatory-priority PFAS compounds, the system achieved >90% removal of each compound and ~83% overall fluorine removal (defluorination), confirming chemical destruction rather than simple separation.
  • Significance: Demonstrates a โ€œuniversalโ€ catalytic mechanism effective across the tested PFAS. The approach is positioned to treat concentrated waste streams after conventional separation processes. Palladium cost and catalyst loading reduction are noted as practical challenges; hybrid Pdโ€“microbial systems are also referenced as ongoing work.

This builds on the groupโ€™s earlier Membrane Catalyst- film Reactor (MCfR) platform for catalytic reduction of oxidized contaminants using efficient Hโ‚‚ delivery.

Direct full- text access may require institutional login or purchase via the PNAS site, as the open-page retrieval was restricted. The news coverage from ASU- affiliated and science outlets (e.g., Eurasia Review, Interesting Engineering, Bioengineer.org) provides consistent, detailed summaries of the findings.

Journal: Proceedings of the National Academy of Sciences

DOI: 10.1073/pnas.2613985123

Provided: Arizona State University

Authors: Min Long, Ai-Shi Wangh, Welman C. Elias,, Thomas P. Senftle, Michael S. Wong, Jie Cheng and Bruce E. Rittmann

Abstract

Per- and polyfluoroalkyl substances (PFAS) persist in aquatic environments due to their ultrastable Cโ€“F bonds and poor susceptibility to conventional treatment. Here, we report an H2-based catalytic-film membrane that enables PFAS destruction in ambient conditions by generating highly reactive surface (Hads*) and subsurface hydrogen (Hsub*), the latter stored as ฮฒ-phase palladium hydride (ฮฒ-PdHx). Solid-state analyses evidenced ฮฒ-PdHx formation and related lattice expansion with elevated H2 chemical potential, revealing a structural mechanism that links hydrogen storage to catalytic defluorination. Mechanistically, the two hydrogen species play complementary roles: Hads*-rich Pd0 surface enabled PFAS capture through parallel adsorption to maximize interfacial contact with active H, whereas sustained Hsub* supplied the energetic driving force for stepwise hydrodefluorination consistent with sequential Cโ€“F scission. As a result, across six PFAS of regulatory concernโ€”PFOA, PFOS, PFNA, PFHxS, PFBS, and GenXโ€”the catalytic membrane converted all contaminants toward fully defluorinated products. Long-chain PFAS were removed and defluorinated more rapidly than short-chain analogs, while GenX showed greater recalcitrance due to its ether linkage, weaker adsorption, and higher average Cโ€“F bond dissociation energy; nonetheless, GenX still exhibited removal and defluorination, with the production of 2-propoxypropanoic acid. The system also enabled continuous coremoval of all six PFAS in ambient conditions, with up to 96% removal and 83% defluorination over 58 d. These findings provide a mechanistic framework for how active hydrogen is generated, stored, and deployed in catalytic membranes, and identify engineered H2-catalytic membranes as a promising low-energy technology for destructive PFAS treatment.

UN Climate Panic Rests on False Scenario and Buried Past

Guterresโ€™ hysteria rests on three weak legs: a worst-case scenario that its own authors have now abandoned, a โ€œpre-industrialโ€ baseline drawn from one of the coldest centuries in 2,000 years, and almost total silence about warm periods that preceded multi-megawatt power plants and SUVs by hundreds and thousands of years.

For more than a decade, projections of flooded coasts and failed harvests were driven by RCP8.5 and its successor SSP5-8.5. The article says they assumed 12 billion people by 2100 and a near tenfold rise in coal use.

A dramatic landscape featuring glaciers with ancient artifacts, including a helmet and a stone tablet, under a moody sky, accompanied by the text 'UN Climate Panic Rests on False Scenario and Buried Past.'
AI generated by Meta

From CO2 Coalition

By Vijay Jayaraj

Three years ago, U.N. Secretary-General Antรณnio Guterres told reporters that โ€œthe era of global boiling has arrived.โ€ In September he repeated the alarm. Launching the U.N.โ€™s first report on temperature โ€œovershoot,โ€ he declared, โ€œHumanity is speeding past the limit to avoid climate catastrophe.โ€

Guterresโ€™ hysteria rests on three weak legs: a worst-case scenario that its own authors have now abandoned, a โ€œpre-industrialโ€ baseline drawn from one of the coldest centuries in 2,000 years, and almost total silence about warm periods that preceded multi-megawatt power plants and SUVs by hundreds and thousands of years.

Start with the scenario. For more than a decade, a computer-based hypothetical case called RCP8.5 and its successor SSP5-8.5 drove the most frightening projections of flooded coasts and failed harvests. They assumed a world of 12 billion people by 2100 and a near tenfold rise in coal use, a future predicted by no energy market.

This April, the modelers who design scenarios for the next generation of climate simulations conceded the point. Their projections of high levels of carbon dioxide emissions (CO2) had become โ€œimplausible,โ€ and their update showed about 0.9 degrees Celsius less warming by centuryโ€™s end. In August, the U.S. government proposed amending its Fifth National Climate Assessment so that results based on earlier projections can no longer be labeled โ€œexpectedโ€ or โ€œbusiness-as-usual.โ€

Now examine the yardstick. Every headline about crossing a 1.5-degree threshold measures warming from an 1850-1900 average. Those decades sit at the end of the Little Ice Age, an era when โ€œlivestock died, harvests failed, and humans suffered.โ€ Choose the bottom of a cold trough as zero and every degree of recovery reads like a fever.

The most serious misdirection is what the panic merchants leave out. Earthโ€™s climate swung widely long before anyone burned coal. A 2013 reconstruction in Science found that in comparison to today, intermediate Pacific waters were 2.1 degrees warmer during the Holocene Thermal Maximum 8,000 years ago and about 0.65 degrees warmer during the Medieval Warm Period 1,000 years ago. Tree rings from Finnish Lapland show that earlier estimates of warmth were too low.

Alaskaโ€™s retreating Mendenhall Glacier has exposed upright spruce and hemlock stumps more than 1,000 years old, a forest that grew where ice later advanced. At the Schnidejoch pass, more than 8,000 feet up in the Swiss Alps, melting ice has yielded more than 300 artifacts left by Neolithic, Bronze Age, Roman, and medieval travelers who crossed the mountains when the route was open. Certainly, temperatures warmer than today had prevailed.

Forecasts of heat-induced doom overlook the benefits of todayโ€™s elevated levels of atmospheric carbon dioxide. A NASA-led study found that a quarter to half of Earthโ€™s vegetated land grew significantly greener over a 35-year period, with CO2 fertilization explaining 70% of the gain. The year after the world supposedly crossed the threshold of 1.5 degrees, the worldโ€™s farmers brought in a record cereal harvest, according to FAO data.

Humans have always faced weather hazards. Floods, droughts, storms, heat waves, crop failures, and changing rainfall existed before the industrial age. They will exist whether a theoretical global average temperature is 1.8 degrees Celsius or 2.8 degrees above an arbitrary baseline. The question is not whether risk exists, but how people respond to it.

And this is where having energy supplies that are reliable, affordable, and abundant helps people manage natureโ€™s challenges. Economies that become more prosperous, maintain reliable systems, strengthen infrastructure, and reduce vulnerabilities will do more to protect human beings from climatic hazards even if they do not satisfy U.N. emission targets.

The future trajectory of CO2 emissions will be influenced overwhelmingly by the growth of energy demand in Asia and Latin America. There can be no justification for telling developing societies there that they must remain poor so that wealthy nations can preserve a global temperature target that has no scientific basis.

The U.N. fabricated an emergency, using a scenario its own modelers now call implausible, employing a baseline estimated rather than observed, and erasing warm eras that ancient farmers, traders, and travelers lived through. That is not science, but stagecraft performed for power and self-enrichment as it made the rest of the world poorer.

Originally published at Town Hall, October 19th, 2026.

Vijay Jayaraj is a Science and Research Associate at the CO2 Coalition, Fairfax, Virginia. He holds an M.S. in environmental sciences from the University of East Anglia and a postgraduate degree in energy management from Robert Gordon University, both in the U.K., and a bachelorโ€™s in engineering from Anna University, India. He served as a research associate with the Changing Oceans Research Unit at University of British Columbia, Canada.

A dramatic landscape featuring ice, rocks, and ancient artifacts, accompanied by text discussing climate panic and its historical context.

Earthโ€™s Core Has Been Quietly Leaking Primordial Hydrogen for Billions of Years

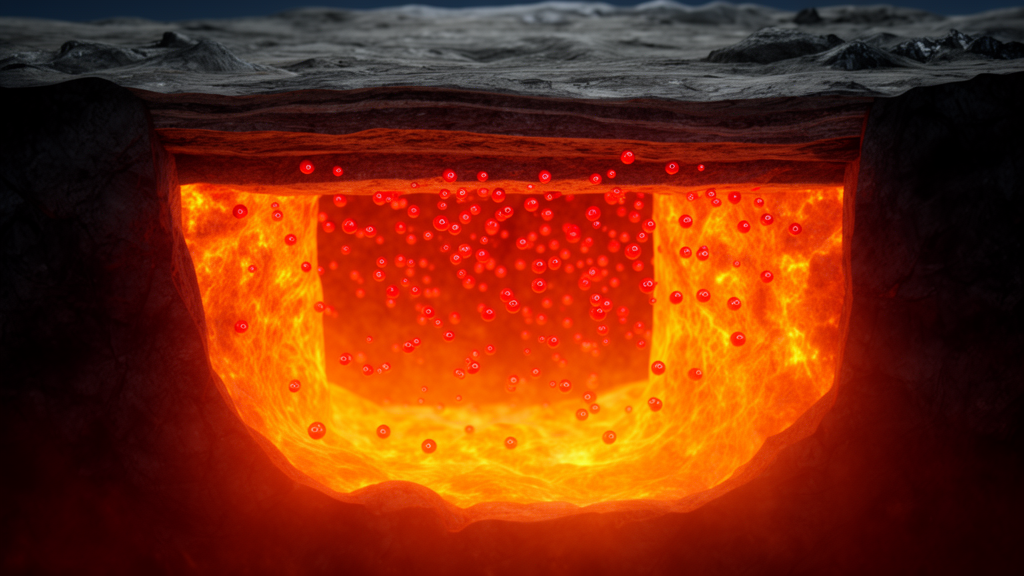
A recent study (published in Science Advances) indicates that Earthโ€™s metallic core has been leaking primordial hydrogen, along with helium- 3 and certain tungsten isotopes, into the mantle for much of the planetโ€™s 4.5- billion- year history.

Hydrogen moves from Earthโ€™s core to the mantle primarily through limited chemical exchange and diffusion (or related transport) across the core, mantle boundary (CMB), rather than large- scale bulk flow.

Tungsten isotope anomalies, particularly involving the isotope ยนโธยฒW, are important geochemical tracers used to study early Earth differentiation and possible ongoing exchange between Earthโ€™s core and mantle.

Illustration of Earth with a cross-section revealing a glowing core, surrounded by rocky layers and depicted energy flows.
AI generated by Grok

A recent study (published in Science Advances) indicates that Earthโ€™s metallic core has been leaking primordial hydrogen, along with helium- 3 and certain tungsten isotopes, into the mantle for much of the planetโ€™s 4.5- billion- year history.

Researchers from the University of Science and Technology of China used machine- learning- boosted path- integral simulations to model the quantum behavior of light atoms (especially hydrogen) under the extreme pressures and temperatures of the deep Earth. They focused on deuterium- to-hydrogen (D/H) ratios and related isotope signatures.

Key points from the work and related coverage:

  • Magma- ocean crystallization alone cannot explain the extremely low (deuterium- depleted) hydrogen isotope signatures seen in some ocean- island basalts (OIBs), such as those from Baffin Island and Iceland. These lavas rise from near the core, mantle boundary and carry chemical โ€œmessengersโ€ from depth.โ 
  • Primordial (solar- nebula) hydrogen stored in the core preferentially partitions as the lighter isotope. As it migrates upward, it lowers the mantleโ€™s local D/H ratio. Supporting evidence comes from high ยณHe/โดHe ratios (primordial helium- 3 mixed with radiogenic helium- 4) and tungsten- isotope anomalies that also point to core material.โ 
  • The hydrogen does not appear as free liquid water in the core; once it enters the oxygen- rich mantle it can form water bound in minerals. Over geologic time this exchange has dynamically altered the deep mantleโ€™s composition rather than leaving purely โ€œrelicโ€ signatures from early differentiation.

This builds on earlier experimental work (e.g., 2026 Nature Communications studies) showing the core itself may contain the equivalent of roughly 9- 45 oceansโ€™ worth of hydrogen (0.07- 0.36 wt %), acquired mainly during Earthโ€™s accretion rather than solely from later cometary delivery. Some of that reservoir appears to have been leaking upward for billions of years.โ 

The quantities involved are tiny on human timescales, but the long-term chemical exchange helps explain observed isotope anomalies in surface rocks and improves models of Earthโ€™s volatile budget, mantle dynamics, and early water origins. The findings reinforce that the core- mantle boundary is not a perfect chemical barrier.

Diagram illustrating the relationship between the Earth's mantle and distinct volcanic regions, showing OIBs (Ocean Island Basalts) and MORBs (Mid-Ocean Ridge Basalts), along with the geochemical signatures of ฮดD. The structure includes features such as LLSVP (Large Low Shear Velocity Province) and ULVZ (Ultra-Low Velocity Zone), highlighting areas of low D/H ratios and core leakage effects.
Schematic model for the origin of isotopic anomalies in ocean island basalts. Credit: Science Advances (2026). DOI: 10.1126/sciadv.aei4756

Hydrogen moves from Earthโ€™s core to the mantle primarily through limited chemical exchange and diffusion (or related transport) across the core, mantle boundary (CMB), rather than large- scale bulk flow.

This process has operated over billions of years and is supported by isotope evidence (especially low ฮดD values) in ocean- island basalts that rise from near the CMB.

Key mechanisms

  1. Chemical reactions and exchange at the CMB
    Subducted hydrous minerals can dehydrate in the lowermost mantle, releasing hydrogen (or water). This reacts with iron- silicon alloys from the outer core, forming phases such as iron hydride (FeHโ‚“) or related compounds. The reaction enables bidirectional exchange: hydrogen can enter the mantle side while silicon (as SiOโ‚‚) may move the other way. A hydrogen- rich, lower- density layer can form near the top of the outer core or accumulate at the base of the mantle (potentially contributing to ultralow- velocity zones). Because of its low density, some of this hydrogen- rich material migrates into the lowermost mantle.โ 
  2. Diffusion (including isotopic diffusion)
    Atomic diffusion of hydrogen across the CMB is a viable transfer route. Hydrogen is highly mobile under extreme pressures and temperatures. Even without strong concentration gradients, isotopic diffusion can transfer light (deuterium- depleted) hydrogen into the mantle if the core and mantle are not in isotopic equilibrium. Estimates of hydrogen diffusivity in lower- mantle minerals indicate that regions of tens of kilometers can be affected over geologic time.โ 
  3. Entrainment into mantle plumes
    Once hydrogen (or hydrogen- bearing material) reaches the lowermost mantle, it can be incorporated into upwelling mantle plumes. These plumes rise to the surface, carrying the core- derived isotopic signatures (low ฮดD, high ยณHe and โดHe, tungsten anomalies, etc.) that appear in certain ocean- island basalts (e.g., Baffin Island, Iceland).

Important context

  • The core acquired much of its hydrogen early, during planetary accretion and metal, silicate differentiation (hydrogen preferentially partitions into the metallic phase and is isotopically light).
  • The quantities transferred are small on human timescales but accumulate over Earthโ€™s history, dynamically modifying deep- mantle isotope compositions.
  • Solid- state diffusion of heavier elements is extremely slow in the lower mantle, so hydrogenโ€™s relative mobility makes it a more effective tracer of core- mantle interaction.
  • Superionic states of iron hydride (where hydrogen atoms move fluid- like within a solid iron lattice) may also play a role near the CMB under the extreme conditions there.
A stylized representation of a planet with a fiery red and orange surface, set against a black background.
File:Volcanic planet 5 r 1.png – Wikimedia Commons

Tungsten isotope anomalies, particularly involving the isotope ยนโธยฒW, are important geochemical tracers used to study early Earth differentiation and possible ongoing exchange between Earthโ€™s core and mantle.

Background: The ยนโธยฒHf- ยนโธยฒW system

  • ยนโธยฒHf (hafnium- 182) is a short- lived radioactive isotope that decays to ยนโธยฒW (tungsten- 182) with a half- life of about 8.9 million years.
  • During Earthโ€™s formation, tungsten (moderately siderophile and โ€œiron- lovingโ€) preferentially entered the metallic core, while hafnium (lithophile and โ€œrock- lovingโ€) stayed in the silicate mantle.
  • As a result, the core developed a strongly negative ยนโธยฒW signature (estimated ฮผยนโธยฒW โ‰ˆ โˆ’200 to โˆ’220), while the mantle became relatively enriched in ยนโธยฒW.
  • ฮผยนโธยฒW is the deviation of the ยนโธยฒW/ยนโธโดW ratio from a terrestrial standard, measured in parts per million (ppm).

Observed anomalies

  • Ancient rocks (Hadean- Archean, >2.7 billion years old) often show positive ยนโธยฒW anomalies (ฮผยนโธยฒW up to +15 to +20 ppm), reflecting the early mantle before significant later mixing.
  • Modern ocean- island basalts (OIBs) from certain hotspots (Hawaii, Samoa, Iceland, Rรฉunion, Kerguelen, etc.) frequently show negative ยนโธยฒW anomalies (ฮผยนโธยฒW as low as โˆ’15 to โˆ’23 ppm). These are often correlated with high ยณHe/โดHe ratios.

Interpretation in the context of core leakage

In the recent research on hydrogen leakage from the core (and related studies), negative ยนโธยฒW anomalies are interpreted as evidence of core- derived material mixed into the lowermost mantle:

  • Even a small contribution (<1%) of core material can shift the mantleโ€™s tungsten isotope ratio toward negative values because the core is so strongly depleted in ยนโธยฒW.
  • Proposed transfer mechanisms include isotopic diffusion across the core- mantle boundary or limited chemical exchange (without bulk entrainment of metal, which would also raise highly siderophile element concentrations, something not observed).
  • These tungsten anomalies often co- occur with other core- like signatures (high ยณHe/โดHe, low ฮดD hydrogen isotopes, and sometimes ruthenium isotope anomalies), supporting the idea of selective, long-term leakage of primordial components from the core into mantle plumes.

Alternative explanations

Some researchers argue the negative anomalies could instead reflect:

  • Preservation of early silicate differentiation products (magma- ocean processes) isolated in the deep mantle for billions of years, or
  • An overabundance of late- accreted (meteoritic) material.

However, the combination of negative ยนโธยฒW with other isotopic systems (helium, hydrogen, etc.) increasingly favors some form of core- mantle interaction for many plume sources.

In short, tungsten isotope anomalies act as a โ€œfingerprintโ€ of very early planetary differentiation and provide one of the key lines of evidence that Earthโ€™s core is not completely isolated from the mantle.

Illustration of molten lava inside the Earth, with bright red and orange hues representing magma and bubbles indicating gas release.
https://scienmag.com/wp-content/uploads/2026/10/stackrss-featured-15740.png

Hydrogen isotopes reveal water leakage from the core

This is the open- access Science Advances paper (DOI: 10.1126/sciadv.aei4756; published ~9 October 2026) titled โ€œHydrogen isotopes reveal water leakage from the coreโ€, by Yu Zhang, Wenzhong Wang (corresponding author, University of Science and Technology of China), Zhongqing Wu, and colleagues.

Main finding

Extremely low (deuterium- depleted) hydrogen isotope ratios (ฮดD values as low as about โˆ’144 โ€ฐ) measured in some ocean- island basalts (OIBs), especially from Baffin Island, cannot be explained by crystallization of an early magma ocean. Instead, they are best accounted for by ongoing leakage of primordial, isotopically light hydrogen (and associated volatiles) from Earthโ€™s metallic core into the mantle over geologic time.

Key methods and results

  • The team used machine- learning- boosted path- integral molecular dynamics simulations to quantify hydrogen isotope fractionation under deep- Earth conditions, accounting for quantum effects important for the light hydrogen atom.
  • They modeled magma- ocean crystallization (bridgmanite- melt partitioning, varying pressure, temperature, water content, and fractionation factors). The models produce an essentially homogeneous D/H distribution in the primitive mantle; mineral- melt fractionation is too weak to generate the extreme depletions observed in OIBs.โ 
  • Observed low ฮดD values, when combined with high ยณHe/โดHe ratios, negative ยนโธยฒW anomalies, and other core- like signatures in the same plume systems, point to selective transfer of primordial volatiles across the core- mantle boundary.
  • Light hydrogen that entered the core during accretion (preferentially partitioned into metal) continues to migrate upward. Once in the oxygen- rich mantle it can form water bound in minerals; the process has dynamically modified deep -mantle isotope signatures throughout Earthโ€™s history rather than preserving simple โ€œrelicโ€ reservoirs from early differentiation.

Broader implications

The results support the idea that Earthโ€™s core is a long- term reservoir of hydrogen (consistent with separate experimental work estimating the equivalent of many oceansโ€™ worth of H in the core) and that core- mantle chemical exchange has been active for billions of years. This exchange helps explain isotope anomalies in surface rocks and contributes to models of Earthโ€™s water budget and mantle dynamics.โ 

The paper is open- access under a Creative Commons license; the full text, figures, and supplementary materials (including sensitivity tests of the crystallization models) are available at the link you provided. Secondary coverage (e.g., ScienceAlert) has summarized the findings for a general audience.

Journal: Science Advances, Vol 12, Issue 41

DOI: 10.1126/sciadv.aei4756

Published: 9 Oct 2026

Authors: Yu Zhang, Wenzhong Wang (corresponding author, University of Science and Technology of China), Zhongqing Wu, and colleagues.

Abstract

Chemical heterogeneities in Earthโ€™s deep mantle may record either preserved primordial reservoirs or later core-mantle exchange, but distinguishing between these origins remains challenging. Hydrogen isotopes offer a sensitive tracer, yet whether magma ocean crystallization could generate a deuterium-depleted deep reservoir has not been quantitatively evaluated. Here, we use machine learningโ€“accelerated path-integral simulations to determine equilibrium hydrogen isotope fractionation between silicate melt and bridgmanite, ringwoodite, and wadsleyite under magma ocean conditions. Incorporating these fractionation factors into a magma ocean crystallization model shows that mineral-melt fractionation is intrinsically weak, producing an essentially homogeneous D/H distribution in the primitive mantle. Magma ocean crystallization therefore cannot generate the extremely low ฮดD values observed in some ocean island basalts. Combined with exceptionally high 3He/4He ratios, these signatures more plausibly reflect selective transfer of primordial volatiles from Earthโ€™s core, implying sustained volatile exchange across the core-mantle boundary.