Global warming, climate change, all these things are just a dream come true for politicians. I deal with evidence and not with frightening computer models because the seeker after truth does not put his faith in any consensus. The road to the truth is long and hard, but this is the road we must follow. People who describe the unprecedented comfort and ease of modern life as a climate disaster, in my opinion have no idea what a real problem is.
Most cloud- climate research focuses on oceans. This work instead examined long- term (2003- 2022) satellite observations and climate reanalysis data for cloud fraction, cloud- top temperature, and cloud- top height over major mountain ranges (Tibetan Plateau, European Alps, Andes, Appalachians, Rockies) and their adjacent lowlands.
Supercooled CF decrease means that the cloud fraction (CF) of supercooled clouds is getting smaller over time.
AI generated by Grok
Clouds over the Highest Mountains Dance a Little Differently, by Rebecca Dzombak (Eos, 16 October 2026), summarizes a study by Zhang et al. in AGU Advances on how mountain clouds, especially supercooled ones, are responding to climate warming.
Most cloud- climate research focuses on oceans. This work instead examined long- term (2003- 2022) satellite observations and climate reanalysis data for cloud fraction, cloud- top temperature, and cloud- top height over major mountain ranges (Tibetan Plateau, European Alps, Andes, Appalachians, Rockies) and their adjacent lowlands.
Key findings
Over most mountainous regions, warm- liquid and ice cloud phases increased, while the supercooled phase (liquid water existing below freezing) decreased. Vertical cloud development was generally suppressed.
Ice cloud tops over mountains rose and cooled 2- 4 times faster than over nearby lowlands.
Supercooled clouds behaved differently by elevation:
Over lowlands and lower- elevation mountains, supercooled cloud tops warmed and descended (indicating suppressed vertical growth).
Over the highest regions, the Tibetan Plateau and the Andes, supercooled clouds cooled further and ascended.
Possible reasons for the high-mountain difference
Tibetan Plateau: Stronger warming at lower altitudes may destabilize the vertical thermal profile, allowing clouds to develop higher into colder air.
Andes: Higher atmospheric moisture content appears linked to the colder, higher clouds.
Overall, high- elevation clouds show both a distinct and often stronger response to warming than clouds elsewhere. The authors note that further work is needed on how these icy, high- elevation cloud changes affect local radiative energy budgets (how much heat is trapped or reflected) and regional hydrology, especially critical for the Tibetan Plateau, which supplies water to hundreds of millions of people amid shrinking snowpack and shifting precipitation.
The original research paper is: Zhang et al., “Amplified Cloud-Phase Responses Over Global Mountain Regions Under Climate Warming,” AGU Advances (2026), DOI: 10.1029/2026AV002380.
Supercooled CF decrease means that the cloud fraction (CF) of supercooled clouds is getting smaller over time.
Quick definitions
CF (Cloud Fraction): The portion of the sky (or of a given area) covered by clouds of a particular type. It is usually expressed as a percentage or a fraction (e.g., 0.25 = 25% cloud cover).
Supercooled clouds: Clouds that contain liquid water droplets even though the temperature is below 0 °C (32 °F). These are a transitional “mixed phase” state between ordinary warm liquid clouds and ice clouds.
What the decrease means in the study
In the Zhang et al. (2026) paper, researchers observed that, under climate warming:
The fraction of the sky covered by supercooled clouds is shrinking.
At the same time, the fractions of warm- liquid clouds and ice clouds are generally increasing.
In plain terms: fewer clouds are staying in the supercooled (liquid- below- freezing) state. Many of them are either warming into ordinary liquid clouds or converting into ice clouds.
This change is stronger over most mountain regions than over lowlands or oceans, with the notable exception of the highest mountains (Tibetan Plateau and Andes), where the remaining supercooled clouds behave differently (they rise and cool rather than warm and descend).
Amplified Cloud-Phase Responses Over Global Mountain Regions Under Climate Warming
This study examines how cloud phase (warm liquid, supercooled liquid, and ice) and vertical structure respond to climate warming over major mountain ranges worldwide, compared with adjacent lowlands. It uses 20 years (2003- 2022) of MODIS Aqua satellite observations of cloud fraction (CF), cloud- top temperature (CTT), and cloud- top height (CTH), combined with ERA5 reanalysis data.
Mountain regions have received less attention than oceans in cloud- climate research, despite their importance for regional hydrology, radiation, and water resources (especially the Tibetan Plateau).
Main Findings
Baseline differences: Mountains show systematically higher fractions of supercooled clouds; warm clouds are more common over lowlands (clear elevation dependence).
Amplified phase responses over mountains:
Ice CF and warm -liquid CF increase.
Supercooled CF decreases.
These changes occur at rates generally exceeding those over global land and ocean.
Ice clouds: Tops rise and cool at rates 2- 4 times faster over mountains than over lowlands or oceans.
Supercooled clouds (the distinctive result):
Over most lowlands and lower- elevation mountains → cloud tops warm and descend (suppressed vertical development).
Over the highest regions (Tibetan Plateau and Andes) → cloud tops show pronounced cooling and ascent, consistent with more active supercooled- to- ice phase transitions.
Specific cooling rates for supercooled cloud tops include approximately −2.7 °C per decade over the Tibetan Plateau and −1.1 °C per decade over the Andes.
Environmental Drivers
Global lowlands: Decreases in supercooled clouds linked to enhanced thermal stability.
Tibetan Plateau: Stronger low- level warming than aloft → enhanced thermal destabilization → allows clouds to develop higher into colder air.
These patterns contrast with the broader tendency toward atmospheric stabilization under global warming.
Implications
High- elevation mountain clouds show a distinct and often amplified response to warming. Changes in cloud phase and CTT over these regions may represent an important but still under- explored pathway affecting regional radiative responses (how much energy is trapped or reflected). Further research is needed on the consequences for local hydrology and energy budgets.
The paper’s summary section emphasizes that these mountain- specific adjustments differ from typical lowland and oceanic responses and highlight the value of elevation- resolved cloud observations for understanding climate change impacts in high- mountain environments.
Changes in cloud phase can substantially affect cloud radiative feedback and precipitation processes, yet their responses to climate warming remain poorly understood, particularly over mountain regions. Using 20 years of satellite observations together with ERA5 reanalysis data, this study investigates changes in cloud fraction (CF), cloud top temperature, and cloud top height across major mountain regions worldwide and their adjacent lowlands. We find that cloud-phase responses to warming are generally amplified over mountains: ice and warm CF increase, while supercooled CF decreases, at rates exceeding those over global land and ocean. These changes are accompanied by ice cloud tops rising and cooling at rates two to four times faster than over lowlands. Over most mountain and lowland regions, supercooled cloud tops warm and descend, indicating suppressed vertical development. In contrast, the Tibetan Plateau and Andes exhibit pronounced cooling and ascent of supercooled cloud tops, suggesting active supercooled-to-ice phase transitions. Over the Tibetan Plateau, this behavior is associated with enhanced thermal destabilization linked to stronger low-level warming than warming aloft. Over the Andes, a moister mid-tropospheric background environment is consistent with colder and higher supercooled clouds. This stands in contrast to the broader tendency toward atmospheric stabilization under global warming, alongside generally limited changes in relative humidity. These findings highlight distinct and amplified cloud-phase and cloud top responses over high-elevation regions and suggest that mountain cloud changes may represent an important but still insufficiently explored pathway affecting regional radiative response.
Richard Lyon’s The Energy Trap is a short book with large ambitions: to strip the energy debate back to first principles and make the key policy issues accessible to the intelligent reader.
The author combines training in electrical engineering, petroleum engineering and energy economics with more than 25 years in senior upstream oil and gas roles in the UK, Norway, Azerbaijan, Congo and Cameroon.
The book argues its case in three broad strands, spread across seven short parts in 110 pages of main text. First comes the physics of energy.
Richard Lyon’s The Energy Trap is a short book with large ambitions: to strip the energy debate back to first principles and make the key policy issues accessible to the intelligent reader. He describes it as “a friendly guide that gives you the minimum set of facts you need, with references so you can check the claims yourself. … You’re perfectly capable of understanding what’s happening if someone takes the trouble to explain it clearly.” The result, as he says in his prologue, can be read in “three cups of tea and half a packet of biscuits”.
The author combines training in electrical engineering, petroleum engineering and energy economics with more than 25 years in senior upstream oil and gas roles in the UK, Norway, Azerbaijan, Congo and Cameroon. Having spent much of my own career in the industry at the downstream end, in corporate planning where the outlook for demand, supply and prices is the bread and butter of the analyst, I read the book with great interest. What insights could an upstream engineer and energy economist who worked on resource assessment, field development and extraction decisions – working at the ‘coal face’ of the supply side, so to speak – bring to corporate planning?
Physics, depletion and escaping the energy trap
The book argues its case in three broad strands, spread across seven short parts in 110 pages of main text. First comes the physics of energy. “If a policy or a technology cannot satisfy the non-negotiable laws that govern how energy is captured, converted, stored and dissipated, it does not matter how elegant the spreadsheet or how passionate the advocacy: it will fail.” Useful work depends not just on the quantity of energy available but on its quality – what Lyon calls the energy gradient, energy density and areal power density – together with the distinction between a fuel and an energy carrier. On these grounds wind and solar – being diffuse and intermittent – cannot substitute for hydrocarbons at industrial scale. The first part of the book’s subtitle, “why the renewable energy transition can’t work”, is explained as the paradox of renewable energy “in which we discover that renewables aren’t renewable, and that building the replacement for fossil fuels requires more fossil fuel than it saves”.
The second part of the argument deals with depletion. Lyon argues that “not all oil is equal” – “the fact that the ‘peak oil was wrong’ narrative has never understood”. Fossil fuels are the “depleting inheritance that no energy policy acknowledges”. According to Lyon, conventional oil has already passed its peak on the curve first described by Hubbert. “Economic oil – the cheap conventional oil that built the modern world – peaked around 2006.” He contrasts Saudi conventional crude, which he estimates costs about $10 a barrel to extract, with more expensive US shale, where new wells need over $60 a barrel to break even. Lyon estimates existing Canadian oil sands operations break even at roughly $30-$40 a barrel. The massive increase in unconventional oil driven primarily by the US shale revolution – which kept global oil production growing – was, in Lyon’s words, made possible because “cheap capital changed the arithmetic. With borrowing costs near zero, companies could drill at a loss and refinance indefinitely.” In his Daily Scepticinterview, Lyon says: “It was having vast amounts of cheap imaginary money thrown at it. … But it is not real oil, it’s uneconomic oil. It’s oil fuelled by imaginary money.”
Given that today’s renewables are unable to provide an alternative, and with depleting fossil fuel resources, we arrive at Lyon’s “energy trap”. Renewable energy – which cannot replace fossil fuels as a sustainable alternative to support modern industrial civilisation – depletes our fossil fuel inheritance even faster. Wind turbines, solar panels, batteries and their components are hugely dependent on fossil fuel inputs for mining, refining and final delivery. This is a problem because we need the fossil fuel pipeline to last as long as possible while we build a truly sustainable energy system.
In Part VII, entitled “Forging a New Realism”, Lyon explains how “escape from the trap is possible”. Three things are required:
The first is that there exists exactly one proven technology capable of moving civilisation up the energy ladder: nuclear power. The second is that even with nuclear, some contraction in total energy use is unavoidable – the physics constrains not just what we build but how fast we can build it. The third is that navigating the contraction requires a blueprint built on what the physics permits, not on what the politics would prefer.
This move towards a sustainable, largely nuclear energy future will involve reducing total energy throughput as “some contraction in total energy use is unavoidable”. He states baldly:
What the physics now demands is a transition up the quality ladder while total throughput contracts [italics in original]. … The honest question is not whether living standards will adjust – they will – but whether the adjustment is a managed descent into a durable, lower-throughput civilisation, or an unmanaged collapse into something much worse.
An education in the basics of energy
Much of the first part – the physics – will be familiar to energy economists who have long regarded much of the energy-transition literature as, in Mark Mills’s phrase, “an exercise in magical thinking”. For example, a kilogram of diesel holds roughly 44 times the energy of a kilogram of the best lithium-ion battery. To carry the same energy, a battery needs far more weight, materials and capital than a tank of diesel. Equally important is Lyon’s reminder that electricity is a carrier, not a source. It accounts for only about a fifth of global final energy consumption; the rest is supplied largely by the direct use of fossil fuels for industrial heat, transport and as industrial feedstock. Steel, cement, ammonia and plastics cannot simply be electrified away.
Lyon describes the stakes in energy policy. Around half the world’s population is fed by crops grown with synthetic nitrogen fertiliser derived from fossil fuels. if we were to stop oil and gas production today, as some climate activists demand, then within a decade, “hundreds of millions of people would starve to death.”. He uses the fertiliser example to convey how much depends on hydrocarbons, but his depletion argument is about oil. Fertiliser depends mainly on gas and coal: over 70% of the ammonia on which it is based is made from natural gas, and most of the rest is from coal, not oil. By his own account, gas reserves stand at about 50 years of current consumption, and he calls gas “a significant buffer”.
On nuclear power, Lyon rightly urges Western governments to strip out regulatory accretions – “multi-year licensing iterations for each new reactor design, dose limits set far below natural background radiation, public inquiries that can outlast a project’s planning consent” – while keeping “the genuinely load-bearing safety standards”. The prize is large. South Korea builds reactors for around $2,200 per kilowatt of capacity, against close to $10,000 for Vogtle in Georgia and more still for Britain’s Hinkley Point C. Hinkley’s cost is now put at up to £35 billion. This amounts to a gap of roughly four to six times in construction cost per kilowatt. Lost construction experience and non-standard designs matter, but regulatory burdens explain a large part of the difference.
Nuclear plays a big role in Lyon’s future sustainable energy supply system:
Nuclear is the next rung on the energy ladder. It is the only energy source available to humanity that is denser, more concentrated and more reliable than fossil fuels. … The fossil inheritance offers a few decades. Uranium, on current reactor technology and at current scale, offers a century… though scaled up to replace fossil energy entirely, that horizon shortens, perhaps to decades.
Breeder reactors using uranium-238 and thorium reactors have not been commercialised at scale but “a serious nuclear programme must include commercialising these cycles”. The small modular, molten salt and high-temperature gas reactors Lyon mentions remain largely at the demonstration or first-of-a-kind stage – outside China and Russia almost entirely so. Nuclear generates electricity, not feedstock, and there are many hard-to-electrify areas in modern industrial economies, as Lyon is aware.
New large reactors remain among the costliest new-build options in Lazard’s annual cost comparisons, and their economics depend on running at near-full output; they cannot be ramped up and down as cheaply as combined-cycle gas turbines.
“Economic oil” and the limits of EROI
The nub of Lyon’s distinctive argument is that oil has already peaked – not in total output, which continues to rise, but in what he calls “economic oil”. In his telling, the cheap conventional crude that built the modern world peaked around 2006, as the International Energy Agency’s World Energy Outlook 2010 acknowledged. The remainder – Canadian oil sands and American shale – is “uneconomic”, kept alive by cheap credit. “It is not real oil,” he told his interviewer, “It’s uneconomic oil. It’s oil fuelled by imaginary money.”
Since the entire “energy trap” thesis rests on this distinction, it deserves careful scrutiny. Lyon’s key metric is energy return on energy invested (EROI): over 30:1 for Saudi conventional crude, he says, against far less for Canadian oil sands (about 4:1). To an economist, however, EROI has little analytical meaning for investment decisions, because it treats energy as the only factor of production. Delivering a barrel of oil also requires labour, capital, land, materials, time and know-how; two projects with identical EROI can have very different costs.
For Saudi Aramco and a private Canadian oil sands operator alike, the relevant corporate finance test is whether the return on capital committed exceeds its cost. If it does, the project creates value; if it does not, it destroys value – something neither a government nor private shareholders will tolerate for long. A low EROI may simply mean that producers are applying capital and technique to a lower-grade resource that takes more energy to extract – a normal, value-creating response to relative prices, as in Canada’s oil sands or US shale. It is the simple ROI (return on investment), not EROI, that matters in corporate finance. At Brent prices of over $100 a barrel in October 2026, existing Canadian oil sands operations (with breakeven prices of $30-$40 a barrel), and new US shale wells (breakeven at around $60-$70) are well in the money. In 2025, Brent averaged $69 a barrel, down from $81 in 2024. For enterprises in US shale and Canadian oil sands operating at favourable, lower cost locations, this is hardly uneconomic.
Averages, margins and Ricardian rent
The author says that there is an “oil price above which the economy contracts”. He writes:
The economy can absorb expensive, difficult oil only as long as a massive base of cheap, easy oil dilutes the total cost. A $120 barrel is viable if the volume-weighted average is $60.
Economic decisions, however, are not made on weighted average cost; they are made at the margin. Every buyer in the world market pays the going price of crude, adjusted for quality (gravity and sulphur content) and location. The finance minister of an oil-importing country cares about the balance-of-payments impact of the marginal barrel, not the average cost of extraction across Saudi Arabia and Alberta. The primacy of the margin over the average is the lesson of the diamond-water paradox, which the marginal revolution resolved.
On the supply side, both the Saudi and the Canadian producer sell at the best price buyers will offer. Buyers will judge the value of the crude by the main refined products it yields – diesel, gasoline, heavy fuel oil, LPG and bitumen. The Saudis, with extraction costs of around $10 a barrel or less, earn a large spread. The marginal producer in US shale or Canadian oil sands earns just enough to pay all factors of production – landowners, labour, lenders and shareholders – their going rates. The difference is what economists since David Ricardo have called economic rent, accruing to the low-cost, inframarginal producer. A shrinking share of cheap oil would raise both prices and rents, and higher prices call forth more marginal supply.
A market that corrects itself
Lyon then describes an amplifying spiral when “average cost exceeds what the economy can bear”: growth stalls; demand and prices fall; marginal oil stops, “not gradually, but suddenly”; production “lurches down”, and the economy, “starved of the energy that production was supplying – contracts again, dragging demand and price lower still and killing more marginal supply”.
This amplifying spiral described by Lyon is at odds with received microeconomic theory of market adjustment responses. When demand has fallen for whatever reason (leaving aside the role of average cost in that fall), the economy does not need the supply that is withdrawn. Shutting in high-cost output is the adjustment, not the disease. As the traders’ saying goes, ‘the best cure for low prices is low prices’. Lyon’s account of the adjustment dynamics inverts the Le Chatelier principle, which Paul Samuelson – the doyen of modern economics – carried over from thermodynamics into economics: a system in equilibrium, when perturbed, generates responses that partly offset the disturbance. Nothing in first-principles physics causes markets to exhibit runaway rather than dampening feedback.
The historical record points the same way. The oil shocks of the 1970s caused global recessions, but they also brought forth new supply from the North Sea and Alaska, substitution away from oil towards natural gas and coal in power generation, more efficient cars and machinery, and conservation. Oil prices collapsed in 1986, after the 2008 run-up, over 2014-16 and again in 2020 with the Covid lockdowns. Each time high-cost output was cut, prices recovered and supply returned. World oil supply averaged some 106 million barrels a day in 2025, on IEA estimates. None of this resembles a doom loop of a perpetually crashing economy.
If quantitative easing made shale oil “imaginary”, the same standard should presumably apply to everything produced during the era of near-zero interest rates: factories, software, housing and, not least, wind and solar farms. Why should monetary conditions render shale uniquely uneconomic?
The claim that shale never made money is based on several missteps. It typically pools the heavy losses of price-crash years with profitable ones, overlooks that early spending was investment for future output, and treats inflated acreage bonuses – a transfer of rent to landowners – as if they were production costs. Companies did overpay in the early land rush and did lose money when prices collapsed in 2014-15. Critics of peak-oil analysis such as Michael Lynch have made the broader point: losses during a price collapse are not the same as an inability of the industry to make a return for shareholders.
The decisive test came after the monetary tap was turned off. The Federal Reserve began raising rates in March 2022 and held them at 5.25-5.5% from July 2023. Yet American crude production rose to a record 13.6 million barrels a day in 2025, up from 5.0 million in 2008. Shale is best understood as a new class of resource opened up by horizontal drilling and hydraulic fracturing: technology, not credit, turned a geological curiosity into a commercial province.
Lyon’s view of “imaginary money” raises its own questions. Rather than the monetarist approach – Milton Friedman’s k-percent rule of steady money growth in line with economic growth – he would anchor money to energy: “Print more money than the energy supply can back and the currency loses value. It is that simple.” What this money supply that “the energy supply can back” should be in practice is not spelled out.
Discovery, reserves and above-ground factors
The book’s quantitative claim is that discoveries peaked in the 1960s, that cumulative discovery has converged on an ultimately recoverable resource of about two trillion barrels of conventional crude, and that the peak is therefore “a matter of arithmetic”. But, as Lynch showed in ‘The New Pessimism about Petroleum Resources’, estimates of field size tend to grow over time, and the fall in discoveries after the 1970s owed much to Middle Eastern governments nationalising foreign operations and cutting exploration while sitting on large surpluses. Discovery is not set by geology alone. ‘Above-ground’ factors such as fiscal regimes, sanctions, war and access to capital decide whether resources are explored and developed. M. A. Adelman – described by MIT as “a giant in the field of energy economics” – argued that reserves are an inventory replenished by investment, not a fixed stock being drawn down. The IEA’s 2025 finding that nearly 90% of upstream investment has been dedicated to offsetting production decline describes a capital-intensive industry replacing depreciating assets. It is not, by itself, evidence of imminent exhaustion.
First principles, Malthus and Julian Simon
Lyon recognises the catastrophic consequences of abandoning fossil fuels abruptly, as climate activists demand. Yet his remedies – conserve every barrel, “electrify everything that you can possibly electrify”, as he said in his podcast interview of his book, and pursue “a deliberate, planned reduction in total energy throughput” with energy “allocated by policy that understands the difference” – amount to planned demand reduction. The motive differs from the climate establishment’s – depletion, not emissions – but the prescription of planned demand reduction is much the same. He would redirect “the subsidies, the planning privileges and the levies loaded onto household bills” to nuclear, geothermal and insulation. Subsidies, in other words, are acceptable when directed at the right technologies. But this is precisely the climate-industrial complex’s argument for subsidising renewables.
Who decides what is ‘the right kind’ of energy? In Lyon’s argument, navigating a managed decline in total energy consumption “requires a blueprint built on what the physics permits, not on what the politics would prefer”. The test on what to invest in for this managed decline is simple: “Does the investment permanently reduce civilisation’s dependence on hydrocarbons, or does it merely shift that dependence onto a parallel system that still requires hydrocarbons to build and maintain?” Nuclear, renewables like geothermal, or eliminating demand – say, through better building design – pass the test. Wind and solar most decidedly fail.
Thomas Malthus argued that population growth would outrun increases in food production. The Club of Rome’s The Limits to Growth (1972) used computer models whose results were driven by similar assumptions of finite resources and exponential growth. The Hubbert curve, which the author treats as proven and already in effect for conventional oil, takes the recoverable resource as fixed in quantity, and so does not anticipate improving technology.
The alternative tradition is that of Julian Simon, author of The Ultimate Resource. The relevant question is not how much oil lies underground, but what human ingenuity can discover, develop and substitute, given prices and institutions. Simon famously won his wager with Paul Ehrlich over the prices of five metals between 1980 and 1990. This is not to argue that we can never run out of any particular resource; that is a misreading of his thesis. The Simon Abundance Index (SAI) of Gale Pooley and Marian Tupy extends his logic, using hours of work as the common measuring rod of scarcity rather than real or nominal prices, which do not capture rising incomes. The index scales the result for population growth. Measured in hours of work – the relevant measure of scarcity in terms of human welfare – the average time price of 50 basic commodities, crude oil, coal and natural gas among them, fell by 70.9% between 1980 and 2025, even as world population rose by 85%. On the index’s methodology, an hour of work bought 244% more of the basket in 2025 than in 1980.
The index’s data show that crude oil tracked the basket closely: its time price fell by 69.8% over the same period, so an hour’s work buys 3.3 times as much oil as it did in 1980. I have made a similar case about the brave new world of ample oil, and argued in Forbes that the oil majors’ asset write-downs in 2020 were not the end of the oil age.
Julian Simon’s insights are consistent with the approach of Friedrich Hayek, whose essay ‘The Use of Knowledge in Society’ explained why free-market prices, rather than planners, convey the dispersed information about scarcity on which sound decisions depend. Human flourishing has come not from technocratic control over consumption but from the freedom to produce, innovate, invest and exchange in voluntary contracts with other individuals.
In the blurbs on the back cover, Matt Ridley – author of the bestseller The Rational Optimist – calls it “The best book on energy you will ever read. Superbly written, thrillingly argued and utterly terrifying.” It is indeed written in succinct, accessible prose, guiding readers to think about energy economics and the physical requirements of modern civilisation. The “utterly terrifying” aspect of the book comes from treating present constraints as fixed limits rather than as problems that markets, technology and human creativity have repeatedly transformed for the better. In that phrase, the ghost of Malthus rises once more.
Dr Tilak K. Doshi is the Daily Sceptic’s Energy Editor. He is an economist, a member of the CO2 Coalition and a former (cancelled) contributor to Forbes. Follow him onSubstackandX.
New research published in Science Advances (October 2026) confirms that the White Sands footprints date to 23.5- 21.7 thousand years ago (during the Last Glacial Maximum) and shows that the people who made them experienced rapid, generation- scale environmental changes.
Dansgaard- Oeschger event 2 (D- O 2 or DO- 2) was one of a series of abrupt climate fluctuations that occurred repeatedly during the last glacial period (roughly 115,000- 11,700 years ago).
AI generated by Grok
New research published in Science Advances (October 2026) confirms that the White Sands footprints date to 23.5- 21.7 thousand years ago (during the Last Glacial Maximum) and shows that the people who made them experienced rapid, generation- scale environmental changes.
Expanded excavations at White Sands National Park (New Mexico) uncovered additional stratigraphic horizons within situ human footprints, megafaunal trackways (mammoths, giant sloths, dire wolves), and linear features interpreted as travois marks.
Researchers refined the chronology using innovative methods to isolate large quantities of conifer pollen grains (up to 75,000 per sample) for radiocarbon dating, combined with ages from aquatic seeds, at the USGS Radiocarbon Laboratory. This reaffirmed and sharpened the earlier dating of the site.
High- resolution paleoclimate reconstruction (at roughly 50- year intervals, comparable to a human generation) used pollen assemblages, biomarkers, leaf- wax hydrogen isotopes, and stratigraphy.
Key findings include:
A complete landscape turnover from conifer forest to sagebrush and oak steppe.
Recession of the large pluvial Lake Otero (which once covered much of the modern park area) into a wet playa and lake- margin setting, with water levels fluctuating over ~1,500 years before further shrinkage.
Centennial- scale swings in water availability, including a severe aridification episode coincident with Dansgaard- Oeschger event 2 (~23.2 ka), an abrupt Northern Hemisphere warming recorded in Greenland ice cores. Local aridity changes tracked these global shifts.
Average temperatures in the Southwest around ~50°F (cooler than today’s ~60°F annual mean in the area), with vegetation shifts (e.g., pine forest to pinyon-juniper) occurring within about 100 years.
The earliest track horizons align with the lake drawdown during D- O 2, which exposed a mosaic of wet and dry ground along the former shoreline that humans and megafauna then traversed for nearly two millennia.
University of Arizona co- author Jessica Tierney (Department of Geosciences) noted the sediments’ unique high temporal resolution and the rarity of combining detailed paleoclimate data with archaeology in the same place; the footprints remain remarkably well preserved in gypsum mud.
USGS co- lead author Kathleen Springer highlighted that early humans were real- time witnesses to changes discernible within a human lifetime. Anthropologist Ed Jolie (University of Arizona) connected the findings to the deep Indigenous past of the Americas and support for Native oral traditions.
This builds on prior work dating the footprints and strengthens evidence for human presence in North America during the Last Glacial Maximum, south of the continental ice sheets. The study was a collaboration involving the University of Arizona, USGS, and other partners.
Dansgaard- Oeschger event 2 (D- O 2 or DO- 2) was one of a series of abrupt climate fluctuations that occurred repeatedly during the last glacial period (roughly 115,000- 11,700 years ago).
What are Dansgaard-Oeschger events?
Named after Danish paleoclimatologist Willi Dansgaard and Swiss physicist Hans Oeschger, these events are best recorded in Greenland ice cores.
Each typically follows a characteristic “sawtooth” pattern:
A very rapid warming phase (often 5- 15 °C / 9- 27 °F in Greenland air temperatures) occurring over just a few years to a few decades.
A subsequent gradual cooling phase lasting centuries to a few millennia.
Often ending with a sharper return to cold (stadial) conditions.
About 25 such events are recognized in the last glacial cycle.
They show an average spacing of roughly 1,470 years, though the timing is not perfectly regular. The warm phases are called Greenland Interstadials (GI); the cold phases are Greenland Stadials (GS).
The leading explanation involves changes in the strength of the Atlantic Meridional Overturning Circulation (AMOC), the large- scale ocean current system that transports heat northward in the Atlantic.
Weaker AMOC → colder North Atlantic and Greenland (stadial); stronger AMOC → rapid warming (interstadial). Sea- ice extent in the North Atlantic is thought to play a major amplifying role. Exact triggers remain under active research and may involve interactions among ocean circulation, ice sheets, atmosphere, and possibly external forcings.
Timing and characteristics of D- O 2 specifically
D- O 2 began approximately 23.3- 23.4 thousand years ago (around 23,340 years before 2000 CE in the NGRIP ice- core chronology). It occurred near the peak of the Last Glacial Maximum, when global ice sheets were near their maximum extent.
In Greenland, it produced the classic rapid warming followed by gradual cooling. Its global teleconnections varied by region.
Relevance to White Sands and the American Southwest
In the recent White Sands National Park studies, D-O 2 is linked to a marked aridification episode around 23.2 ka. The abrupt Northern Hemisphere warming is interpreted to have increased evaporation and reduced effective moisture in the Southwest, causing pluvial Lake Otero to shrink rapidly. This exposed a mosaic of wet and dry lake-margin surfaces that humans and megafauna then walked across, preserving the famous footprints. Local pollen, biomarker, and isotopic records show centennial-scale swings in aridity and a vegetation shift coincident with this event.
In short, D- O 2 was a short- lived but intense pulse of climate instability superimposed on the already cold, ice- age world, strong enough to be felt far from Greenland, including in the landscapes of Ice Age New Mexico.
Kathleen Springer and Jeffrey Pigati collect samples for environmental change analysis from a trench in the White Sands playa. Credit: Jessica Tierney
Humans experienced abrupt environmental changes at White Sands during the Last Glacial Maximum
Abstract (key points)
Expanded excavations at White Sands National Park (Locality 2) revealed 20 stratigraphic horizons containing in situ human footprints, megafaunal trackways, and linear features interpreted as travois marks.
Advances in radiocarbon dating of conifer pollen, combined with ages from aquatic seeds, refine the chronology of the footprint- bearing sequence to 23.5- 21.7 thousand years ago (ka).
Biomarker, pollen, and stratigraphic evidence show a complete environmental overturning from a perennial lake to a playa. A large aridification episode coincided with Dansgaard- Oeschger event 2 at ~23.2 ka, which shrank pluvial Lake Otero and allowed people (and megafauna) to traverse the former shoreline area for nearly two millennia.
This provides a well- dated, high- resolution paleoclimate record demonstrating that humans in North America experienced marked environmental changes during the Last Glacial Maximum.
Main findings (from available coverage and related materials)
Chronology: Confirms and refines earlier dating of the White Sands footprints to the height of the Last Glacial Maximum. The sequence spans almost 2,000 years of repeated human presence.
Environmental reconstruction (high temporal resolution, ~50- year intervals):
Began with a large Lake Otero and surrounding conifer forests; temperatures ~4- 6 °C cooler than today.
Progressive warming and drying from ~23.6 ka onward: conifers declined and were replaced by oak and sagebrush steppe.
Sharp centennial- scale swings in hydroclimate, including a severe drought ~23.2 ka (linked to D- O 2) that increased lake salinity and expanded drought- tolerant vegetation.
Lake levels fluctuated and overall receded into a wet playa and lake- margin setting.
Earliest footprint horizons align with the D- O 2 transition and lake drawdown that exposed suitable muddy surfaces. People continued to visit as conditions changed.
Authors (including USGS researchers Kathleen Springer and Jeff Pigati, and University of Arizona’s Jessica Tierney) note the rarity of such a high- resolution multiproxy record tied directly to human and megafaunal activity in the same place.
A USGS data release accompanying the paper is available (DOI: 10.5066/P13W7HTM).
The full text on Science.org is typically behind a paywall or institutional access; secondary summaries (e.g., University of Arizona, EurekAlert, The Conversation) and the abstract provide the core results.
Related earlier papers confirmed the age of the footprints using multiple independent dating methods (seeds, pollen, OSL).
The biggest near-term price driver is fuel and inflation, not sea surface temperature. Marine diesel is over $7/gal now vs ∼$6.50 last year, and large fishing boats use hundreds to tens of thousands of gallons per trip. For Seattle, which the NYT focuses on, the influx of high-earning tech workers since the 2010s has made everything more expensive, including restaurants.
A recent article in TheNew York Times (NYT), “How Climate Change is Causing ‘the Gentrification of Seafood’,” blames primarily climate change for how expensive seafood has become in recent decades. This is misleading. Later in the article, the author admits that seafood prices have always fluctuated, and economics and overfishing can also impact the cost and availability of fish and shellfish. This is a much better explanation for seafood prices than blaming the weather, sea surface temperatures, and fossil fuel use.
The NYT claims that climate change is increasing ocean temperatures and reducing the supply of fish, forcing prices upwards, but also quite early in the post admits that “more people” are also going after those supposedly “fewer fish and shellfish.”
With that admission, the NYT complicates their own narrative. Human populations are growing, and the popularity of seafood has been increasing as diet trends promote eating fish and shellfish as easy ways to get lean protein. Trends on social media like TikTok made eating canned fish like sardines look epicurean and health conscious to younger consumers who otherwise would probably turn their noses up at it. Seafood consumption has been rising; in 2024, sales reports showed that four-year sales growth in both frozen and fresh fish increased 31%, and shellfish experienced a 23% growth in sales.
Lest we forget, after Biden banned Russian seafood imports, demand on US-caught fish expanded, and prices increased.
Economic pressures are much larger influences on especially local seafood costs. In 2024, seafood prices had actually been trending downwards in the United States, despite inflation, but pressures change quickly. The spike in fuel costs is likely a large part of why seafood is so comparatively expensive right now. Marine diesel is over $7 per gallon right now, while last year it was closer to $6.50. That might not sound like a huge change, but large fishing boats that do multi-day excursions might have tanks that hold over 250 gallons, and commercial crabbing boats have fuel requirements of 48,000 gallons or more.
Another factor that this article, which focuses largely on the Pacific Northwest, mentions only very briefly, is that local cost inflation due to how trendy the area is will also impact food prices in general, including eating out at seafood restaurants. NYT even admits that “[m]any aspects of Seattle life have become more expensive with the influx of high-earning tech workers who have relocated there for companies like Amazon, beginning in the 2010s.”
That is obviously not because of climate change.
Increasing pressure on fish stocks in general is a known issue, however that hasn’t stopped record fish catches from happening in recent years. As described by Climate Realism before when refuting similar claims coming from media, the most recent all-time record was set in 2020, and some groups studying fisheries estimate that production is expected to continue growing into the 2030s.
Warmer waters may push cooler water species away from where they once lived, this is true, but it is not a catastrophe and is not evidence that climate change is decimating fish stocks. The NYT claims that, while admitting seafood prices have never been stable, “over the last 20 years, climate change-related phenomena have added steady pulses of volatility,” listing “droughts, heat domes, marine heat waves, sea ice anomalies, ocean acidification, atmospheric rivers and toxic algae blooms” as climate-driven issues that have supposedly “upended” Pacific Northwest fisheries. They say this as if all these issues were not present in previous decades, which is blatantly false.
Marine heatwaves have always happened. One of the most prominent marine heatwave conditions that regularly occur in the Pacific, and which is ongoing right now, is the El Niño–Southern Oscillation. It is natural, and has always occurred. Even this year’s very strong El Niño is hardly unprecedented and not unique to the last two decades. Previous years with similarly strong ENSO in the satellite era alone occurred in 1982-83 and 1997-98.
Likewise atmospheric rivers are a common feature of the Pacific Northwest’s climate. Meteorologist Anthony Watts explains in “Wrong, Washington Post – History and Data Contradict Claims of Worsening ‘Atmospheric Rivers’,” that studies using satellite as well as sounding data looking at the regions the West Cost atmospheric rivers originate found that there is no trend towards intensifying or declining events.
It is true that bacterial and algae blooms can make shellfish toxic, and they are more common in warmer water conditions, which is why the oyster harvest seasons usually do not go into summer months in the Southeastern United States. If the window has shifted, harvest times can also shift. Still, the NYT implies that paralytic shellfish poisoning, for example, is a recently emerging phenomenon, when records going back as early as the 1700s and into the 1920s show that these events poisoned and killed people enjoying seafood on the West Coast. But again, there are plenty of places with warmer waters than the Pacific Northwest that also have thriving shellfish harvesting communities, like Louisiana.
Climate change is, ironically, a red herring in this story.
The most frustrating thing about articles like this, is the mixing of truth with exaggeration, where the New York Times and other outlets like it will choose to amplify the role of warming while downplaying factors that are much more immediate and powerful. What is implied by this framing, is that YOUR use of fossil fuels and their byproducts is making it so that it is harder for people to afford their favorite foods. Because YOU won’t give up your car or eating red meat, a poor family in Connecticut or Oregon can no longer afford cod. It is nonsense and certainly not part of “all the news that’s fit to print.“
The Great Oxidation Event (GOE), also known as the Great Oxygenation Event, was a major turning point in Earth’s history that occurred roughly 2.4 to 2.0 billion years ago.
The Neoproterozoic Oxygenation Event (NOE), sometimes called the Second Great Oxidation Event, was a significant rise in Earth’s atmospheric and oceanic oxygen levels that occurred during the Neoproterozoic Era, roughly between 850 and 540 million years ago.
The GOE was not a single abrupt jump but a prolonged, complex transition with “whiffs” of oxygen earlier and further rises later (including the Neoproterozoic Oxygenation Event).
It fundamentally transformed Earth from a reducing world into one capable of supporting complex aerobic life, ultimately paving the way for animals and the modern biosphere.
AI generated by Grok
The Great Oxidation Event (GOE), also known as the Great Oxygenation Event, was a major turning point in Earth’s history that occurred roughly 2.4 to 2.0 billion years ago.
Before the GOE, Earth’s atmosphere and oceans were largely anoxic (almost no free oxygen). Oxygen produced by early photosynthetic microbes (mainly cyanobacteria) was quickly consumed by chemical reactions with reduced materials such as dissolved iron and volcanic gases.
During the GOE:
Free oxygen (O₂) began to accumulate in the atmosphere for the first time in significant amounts.
Atmospheric oxygen levels rose from near- zero to perhaps 0.1- 1% or more of present- day levels (exact values are still debated).
This triggered widespread environmental changes.
Key evidence and effects
Banded iron formations: Distinctive layered rocks of iron oxides that formed when oxygen reacted with dissolved iron in the oceans, causing it to precipitate.
Oxidation of the land surface and oceans.
Possible global glaciations (including “Snowball Earth”- like events) linked to the removal of methane (a strong greenhouse gas) as oxygen levels rose.
A major evolutionary filter: many anaerobic organisms were driven to extinction or restricted habitats, while aerobic (oxygen- using) life gained opportunities.
Causes
The primary driver was oxygenic photosynthesis by cyanobacteria. Additional factors that may have helped oxygen finally “break through” include:
Changes in volcanic gas composition
Burial of organic carbon
Continental growth and weathering
Possible contributions from deep- Earth processes (such as the excess- oxygen release from rising magmas discussed in the recent study)
The GOE was not a single abrupt jump but a prolonged, complex transition with “whiffs” of oxygen earlier and further rises later (including the Neoproterozoic Oxygenation Event).
It fundamentally transformed Earth from a reducing world into one capable of supporting complex aerobic life, ultimately paving the way for animals and the modern biosphere.
The Great Oxidation, AI generated by Grok
The Neoproterozoic Oxygenation Event (NOE), sometimes called the Second Great Oxidation Event, was a significant rise in Earth’s atmospheric and oceanic oxygen levels that occurred during the Neoproterozoic Era, roughly between 850 and 540 million years ago.
Timing and context
It followed a long interval known as the “Boring Billion” (roughly 1.8–0.8 billion years ago), when atmospheric oxygen remained very low (typically <0.1% of present atmospheric levels, or PAL).
During the NOE, oxygen concentrations increased substantially, estimates suggest rising above ~13% PAL in the early Neoproterozoic and possibly reaching as high as ~50% PAL at times during the Cryogenian interglacial periods. Oxygen levels remained dynamic and intermediate through the Ediacaran and into the early Paleozoic; truly modern, stable high levels were not reached until later in the Paleozoic.
Unlike the earlier Great Oxidation Event (GOE, ~2.4- 2.0 Ga), which permanently established free oxygen in the atmosphere, the NOE appears more complex, possibly a series of pulses or regional events rather than one single global step.
Evidence
Geochemical proxies supporting the NOE include:
Large positive carbon- isotope (δ¹³C) excursions indicating increased organic carbon burial (which releases net oxygen).
Extreme negative carbon- isotope excursions (e.g., the Shuram- Wonoka event ~580- 550 Ma) interpreted as oxidation of a large dissolved organic carbon pool.
Increases in redox- sensitive trace metals (molybdenum, vanadium, uranium) in black shales.
Changes in sulfur- isotope fractionation and iron speciation data showing progressive (though incomplete) ocean ventilation, from ferruginous (iron-rich anoxic) to more oxic conditions.
Other indicators such as chromium isotopes and selenium isotopes.
Causes
Multiple interacting factors likely contributed:
Enhanced organic carbon burial linked to tectonic activity (breakup of the supercontinent Rodinia and later assembly of Gondwana).
Nutrient fluxes from weathering of newly uplifted mountains.
Biological innovations, including the radiation of nitrogen- fixing and planktonic cyanobacteria that boosted primary productivity.
Climatic extremes, including the “Snowball Earth” glaciations (Sturtian and Marinoan), which may have altered ocean chemistry and nutrient cycling upon melting.
Possible contributions from changes in day length or other planetary factors.
Biological significance
The rise in oxygen is widely linked to the emergence and diversification of complex multicellular life. It coincided with:
The appearance of the Ediacaran biota (the first large, soft-bodied multicellular organisms).
The subsequent Cambrian Explosion of animal body plans.
Higher oxygen levels enabled more efficient aerobic metabolism, larger body sizes, and greater mobility, although early animals may have first evolved under still relatively low and fluctuating oxygen conditions.
In summary, the NOE marked a critical transition that helped transform Earth from a predominantly low-oxygen world into one capable of supporting the complex aerobic ecosystems that characterize the Phanerozoic Eon. Scientific understanding continues to evolve, with some researchers preferring terms such as “Neoproterozoic Oxygenation Window” to emphasize its pulsed and dynamic nature rather than a single discrete event.
Rodinia, “Snowball Earth”, Sturtian glaciation and The Second Great Oxidation Event
These terms describe interconnected events in the Neoproterozoic Era that dramatically reshaped Earth’s climate, oceans, atmosphere, and life.
Rodinia
Rodinia was a supercontinent that assembled roughly 1.3– 0.9 billion years ago and began breaking apart around 825–750 million years ago (with final stages continuing into the late Neoproterozoic). It brought most of Earth’s continental crust together, centered roughly around Laurentia (ancestral North America).
Its breakup involved widespread rifting, large igneous provinces (LIPs), and the opening of new ocean basins. This tectonic upheaval increased continental weathering, altered nutrient fluxes into the oceans, and changed volcanic CO₂ emissions, setting the stage for major climate and chemical shifts.
“Snowball Earth”
“Snowball Earth” refers to extreme global glaciations during the Cryogenian Period (roughly 720- 635 million years ago) in which ice sheets reached the equator and may have covered nearly the entire planet.
Two main episodes are recognized:
Sturtian glaciation
Marinoan glaciation
These events were far more severe than any later ice ages. Life survived in limited refugia (possibly under thin ice, in meltwater ponds, or near hydrothermal vents). The extreme cold was eventually ended by the gradual buildup of volcanic CO₂, which created a powerful greenhouse effect and triggered rapid deglaciation.
Sturtian glaciation (~717–658 million years ago)
This was the first and longest of the Cryogenian “Snowball Earth” events, lasting about 55- 60 million years.
Likely triggers linked to Rodinia’s breakup include:
Weathering of extensive basaltic large igneous provinces (especially the Franklin LIP ~718 Ma), which drew down atmospheric CO₂.
Possible reductions in mid- ocean ridge volcanic CO₂ outgassing.
Paleogeography that enhanced silicate weathering (continents clustered in low latitudes).
Once ice covered most of the planet, the ice- albedo feedback locked Earth into a frozen state until CO₂ levels rose high enough to melt the ice. Cap carbonates (distinctive limestone layers) mark the abrupt end of the glaciation worldwide.
Second Great Oxidation Event (Neoproterozoic Oxygenation Event- NOE)
Also called the Second Great Oxidation Event, this was a major rise in atmospheric and oceanic oxygen levels between roughly 850 and 540 million years ago, following the long low- oxygen“Boring Billion”.
Oxygen increased from very low levels (<0.1% of present atmospheric levels) to significantly higher values (possibly tens of percent of modern levels at times). It involved pulses rather than a single smooth rise and helped ventilate the deep oceans.
Connections to the other events:
Rodinia’s breakup increased nutrient delivery and organic- carbon burial, promoting net oxygen production.
The Sturtian (and later Marinoan) Snowball Earth events disrupted carbon cycles; the intense weathering and ocean chemistry changes after deglaciation, plus burial of organic matter, contributed to rising oxygen.
Higher oxygen levels after these upheavals are linked to the appearance of the Ediacaran biota and the later Cambrian Explosion of animal life.
How they fit together
The breakup of Rodinia → enhanced weathering and tectonic changes → triggered or helped sustain the Sturtian glaciation (a major phase of Snowball Earth) → extreme climate swings and carbon- cycle perturbations → contributed to the Second Great Oxidation Event (Neoproterozoic rise in oxygen).
These linked processes transformed Earth from a relatively stable, low-oxygen world into one with more dynamic climates, higher oxygen, and the environmental conditions that allowed complex multicellular life to diversify.
A new study shows that silicate magma (molten rock) in Earth’s deep interior can store substantial “excess oxygen” beyond conventional chemical (stoichiometric) limits, acting like a volatile that is released upon ascent and potentially helping oxidize the shallow Earth and atmosphere.
It proposes a previously unrecognized geological mechanism that could have helped oxygenate Earth’s atmosphere, linking deep- mantle melting events to surface oxidation, especially around the time of the Great Oxidation Event.
AI generated by Grok
A new study shows that silicate magma (molten rock) in Earth’s deep interior can store substantial “excess oxygen” beyond conventional chemical (stoichiometric) limits, acting like a volatile that is released upon ascent and potentially helping oxidize the shallow Earth and atmosphere.
The research, published in National Science Review (DOI: 10.1093/nsr/nwag539) and announced by Science China Press (via EurekAlert, 15 October 2026), was led by Dr. Yanhao Lin and Dr. Ho-kwang Mao (Center for High Pressure Science and Technology Advanced Research / HPSTAR), with collaborators including Prof. Haiyang Niu (Northwestern Polytechnical University) and Prof. Wim van Westrenen (Vrije Universiteit Amsterdam).
Key findings
Traditionally, oxygen in magma was assumed to be fixed solely by the amounts and valence states of cations (Si, Mg, Fe, etc.). Unlike H₂O or CO₂, it was not treated as an independent volatile.
High -pressure and high- temperature experiments melted synthetic mid- ocean ridge basalt at 1 atm to 7 GPa (depths of hundreds of km) and 1200- 1800 °C, using an oxygen source (PtO₂). After quenching to glass, researchers measured major elements, H₂O, and CO₂, then calculated residual “excess oxygen” after accounting for stoichiometric needs and oxygen bound in water and CO₂.
Excess oxygen was near zero at 1 atm but rose to >5 wt% at 7 GPa. Controls without PtO₂ showed only 0.2- 0.5 wt%. Raman spectroscopy indicated the excess is incorporated into the melt and glass structure (not free O₂ bubbles). Measured amounts are likely lower limits due to possible loss during quenching.
Molecular dynamics simulations (using deep neural network potentials with ab initio accuracy) on a simplified Mg- Si- O system reproduced the pressure- dependent uptake. As oxygen content rises, oxygen charges become more variable and some peroxide- like O–O bonds form, allowing storage beyond traditional limits. Capacity increases with pressure in a manner analogous to H₂O and CO₂ solubility.
Implications for Earth’s atmosphere
Magma generated in oxidized deep- mantle regions could carry excess oxygen. As it rises and pressure drops, solubility decreases and O₂ is released, potentially oxidizing the shallow mantle, crust, and atmosphere. This offers a direct physical link between deep melting and surface oxidation.
The timing aligns with major atmospheric oxygen rises ~2.5- 2.0 billion years ago (Great Oxidation Event and aftermath), which overlapped with some of Earth’s largest large igneous provinces (LIPs) from deep-sourced magmatism. A rough estimate indicates that release of only ~0.27 wt% excess oxygen from magma erupted in that period could account for all the oxygen in today’s atmosphere.
The work reframes magma as an active, pressure- sensitive reservoir in planetary oxygen cycles. It has implications for magma- ocean evolution, volatile degassing, atmospheric evolution on Earth, and long- term habitability of other terrestrial planets.
This is a recent experimental and computational result proposing a previously unrecognized mechanism; it complements (rather than replaces) other processes involved in Earth’s oxygenation history, such as biological photosynthesis, changes in volcanic gas composition, and subduction- related recycling.
Schematic cross- section of Earth’s mantle. Magma formed in a deep, oxygen- rich region of the mantle carries excess oxygen upward. As the magma rises and pressure drops, excess oxygen is released (blue dots), which could oxidize the shallow mantle, the crust and the atmosphere. LIP: large igneous province; ULVZ: ultra- low velocity zone. Credit: Science China Press
It proposes a previously unrecognized geological mechanism that could have helped oxygenate Earth’s atmosphere, linking deep- mantle melting events to surface oxidation, especially around the time of the Great Oxidation Event.
Core idea
Silicate magma deep in the Earth can dissolve substantial “excess” (non- stoichiometric) oxygen as a pressure- dependent volatile, near zero at surface pressure but rising to more than ~5 wt% at pressures above ~5 GPa (hundreds of kilometers depth).
When this oxygen- rich magma rises and pressure drops, the excess oxygen is released as O₂. This provides a direct pathway for transporting oxidizing power from the deep interior to the shallow mantle, crust, and atmosphere.
Relevance to Earth’s history
Timing with atmospheric oxygen rise: Major increases in atmospheric oxygen roughly 2.5- 2.0 billion years ago (the Great Oxidation Event and its aftermath) overlap with the emplacement of some of Earth’s largest large igneous provinces (LIPs)—massive volcanic outpourings fed by deep mantle plumes. The new mechanism offers a physical link between these deep magmatic events and surface oxidation.
Scale of the effect: A rough estimate in the study indicates that if magma erupted during that period released just ~0.27 wt% excess oxygen, the total amount liberated could equal all the oxygen present in today’s atmosphere. Experimental storage capacities at high pressure are an order of magnitude higher, so even partial degassing could have been geologically significant.
Broader oxygen cycle: Magma is reframed as an active, dynamic reservoir in planetary oxygen cycles rather than a passive carrier of fixed chemistry. This complements (does not replace) other well-known factors in Earth’s oxygenation history, such as:
Biological oxygen production by cyanobacteria (photosynthesis).
Changes in the redox state of volcanic gases.
Burial of organic carbon.
Subduction and recycling of oxidized surface materials.
Earlier processes such as iron disproportionation in magma oceans that oxidized the mantle after core formation.
Additional historical and planetary implications
It supplies a new way to evaluate early Earth magma- ocean evolution and volatile degassing.
The same physics could apply to other rocky planets, affecting whether they develop or retain oxygen- rich atmospheres and long- term habitability.
It highlights how deep interior processes can influence surface conditions over billions of years, reinforcing the interconnected nature of Earth’s interior- surface- atmosphere system.
In short, the finding does not overturn the biological or surface- driven explanations for the rise of oxygen, but it adds a plausible deep- Earth contribution that helps explain the coincidence of major atmospheric oxygen increases with large-scale mantle melting events in the Paleoproterozoic. It is a recent experimental and computational result (published 2026 in National Science Review), so further work will test how quantitatively important this process was relative to other mechanisms.
Magma as a carrier of non- stoichiometric oxygen linking Earth’s interior and atmosphere
This is the full open- access research article corresponding to the news story discussed earlier.
Abstract (key points)
Magma generation and transport govern planetary evolution. Although oxygen is the most abundant anion in Earth’s silicate interior, its role in magma has conventionally been ignored, with oxygen contents assumed to be fixed solely by cation stoichiometry.
High- pressure and high- temperature experiments combined with molecular dynamics simulations demonstrate that silicate magma can incorporate substantially more oxygen than traditional valence- state constraints allow. This “excess oxygen” behaves as a previously unrecognized volatile component: its concentration rises from near zero at 1 atm to > ∼5 wt% above 5 GPa, more than five times the maximum oxygen increase possible in Earth’s solid mantle via iron redox changes.
As oxygen- rich magmas ascend and decompress, their capacity to hold excess oxygen decreases, driving release of O₂. This provides a direct mechanism potentially linking mantle melting to oxidation of Earth’s shallow interior and atmosphere and identifies magma as a dynamic reservoir in planetary oxygen cycles.
Context from the study and press coverage
Experiments used synthetic mid- ocean ridge basalt melted at 1 atm, 7 GPa and 1200- 1800 °C (with PtO₂ as an oxygen source). Excess oxygen was quantified in quenched glasses after accounting for stoichiometric requirements plus H₂O and CO₂. Values exceed 5 wt% at the highest pressures; controls without the oxygen source showed only 0.2- 0.5 wt%. Raman data indicate structural incorporation rather than free O₂ bubbles.
Simulations (deep neural-network potentials) on a simplified Mg- Si- O system reproduce the pressure- dependent uptake and show broader oxygen charge distributions plus some peroxide- like O–O bonds.
Implications include a possible contribution to atmospheric oxygenation ~2.5–2.0 billion years ago (Great Oxidation Event period), overlapping with major large igneous provinces. Rough estimates suggest release of only ~0.27 wt% excess oxygen from relevant magmas could supply the amount of O₂ in the modern atmosphere.
Broader relevance: magma- ocean evolution, volatile degassing, and habitability of terrestrial planets.
The article is short (9 pages). The publisher page (academic.oup.com) and institutional repositories (e.g., Vrije Universiteit Amsterdam) host it under the open- access license.
Future Arctic winter sea ice is projected to shrink by roughly 1 million km² more than earlier estimates suggested. This comes from a recent study (reported in Nature Geoscience) that used mid- Holocene paleoclimate data (~6,000 years ago) to better constrain and weight climate models.
Greater winter ice loss could amplify mid- latitude impacts already linked to reduced winter SIE, including colder and wetter winters in parts of Eurasia and North America, altered storm tracks, and extreme precipitation.
AI generated by Grok
Future Arctic winter sea ice is projected to shrink by roughly 1 million km² more than earlier estimates suggested. This comes from a recent study (reported in Nature Geoscience) that used mid- Holocene paleoclimate data (~6,000 years ago) to better constrain and weight climate models.
Researchers from the University of Cambridge and Mexico’s Centro de Investigación en Matemáticas compiled the largest database yet of a key biomarker produced by sea- ice algae, extracted from ocean sediment cores.
During the mid- Holocene, orbital changes caused warmer Arctic conditions and reduced sea ice, providing an independent “out- of- sample” test of how models handle warmer climates comparable to projected future greenhouse- gas forcing.
Models generally over- predicted the amount of winter sea ice that should have existed under those past conditions. By weighting the models according to how well they matched the paleodata (and historical observations), the positive bias was largely eliminated. This also narrowed projection uncertainty by as much as 85%.
When the same weights were applied to future scenarios (SSP1/SSP2/SSP5), the multi- model mean winter sea- ice extent for 2090- 2099 came out consistently lower, by about 4- 6%, than the unweighted average. The extra loss is concentrated in regions such as the Barents, Greenland, and Labrador Seas, with possible ice- edge shifts of several degrees of latitude.
Why it matters
Winter ice sets the stage for the rest of the seasonal cycle; underestimating its retreat also understates effects on ocean circulation, regional weather, and the timing of summer melt.
The revised projections hint at larger knock- on impacts, including potentially more snowfall over southeast Greenland and more rainfall in the Mediterranean, with implications for ice- sheet stability and flood risk in southern Europe.
Winter conditions in the UK and across Europe could therefore be affected more than previously expected.
In short, paleoclimate evidence from a naturally warmer Arctic indicates that standard climate models have been too conservative about future winter sea- ice loss. The study emphasizes that past warm periods can provide stronger constraints on model reliability than the relatively short instrumental record alone.
This is the peer- reviewed scientific paper underlying the recent news reports about greater- than- expected future Arctic winter sea- ice loss.
Key findings
Climate models show their largest biases and uncertainties for Arctic sea ice in winter (especially March), when ice cover strongly influences air- sea heat exchange, ocean mixing, and atmospheric circulation.
The authors address this by compiling the largest Arctic-wide database of mid- Holocene (MH; 5- 7 thousand years ago) sea- ice biomarkers (46 ln(PIP₂₅) observations based on the IP₂₅ biomarker and associated phytoplankton sterols from sediment cores spanning ~54- 83° N).
They use a Bayesian proxy system model (BaySIC) to translate model- simulated sea- ice concentrations into the same proxy units, accounting for non- stationary proxy seasonality (tied to local ice-breakup timing rather than fixed calendar months). A Bayesian weighting scheme then adjusts the contribution of each of 27 PMIP3/PMIP4 and CMIP models based on how well they match the MH proxies (and, in a joint analysis, historical observations). The scheme also accounts for model interdependence.
The weighted multi- model mean (WMMM) eliminates the positive winter sea- ice extent (SIE) bias and reduces uncertainty by ~85% (≈6.3 million km²), bringing it down to the level of interannual variability.
Applying the same weights to future projections (SSP1/SSP2/SSP5, corresponding to RCP2.6/4.5/8.5) yields winter SIE that is consistently ~4- 6% lower than the unweighted multi- model mean for 2090- 2099, nearly 1 million km² lower across scenarios.
Spatially, the weighted projections show higher probabilities of ice loss (and northward ice- edge shifts of up to 5.5° latitude) in the Barents, Greenland, and Labrador Seas.
Implications
Greater winter ice loss could amplify mid- latitude impacts already linked to reduced winter SIE, including colder and wetter winters in parts of Eurasia and North America, altered storm tracks, and extreme precipitation.
The revised projections suggest late- winter and early- spring snowfall over southeastern Greenland may be underestimated by >30%, and Mediterranean winter, spring precipitation could be roughly twice as high as previously projected under high- emissions scenarios, with consequences for Greenland Ice Sheet mass balance and flood risk.
The mid- Holocene provides a particularly useful out- of- sample test because orbital changes produced Arctic radiative forcing comparable in magnitude (though different in seasonality and mechanism) to anticipated future greenhouse -gas forcing. Models that perform well under those past warm conditions are expected to be more reliable for future projections.
In short, quantitative palaeoclimate constraints from a warmer Arctic indicate that standard multi- model estimates have been too conservative about the magnitude of future winter sea-ice retreat and its cascading effects.
Arctic sea ice decline has been observed across all seasons and is projected to continue in the future. Relative to historical observations, climate models show their largest biases and uncertainties during winter, when ice cover strongly regulates air–sea heat exchange, ocean mixing and atmospheric circulation. Palaeoclimate records offer opportunities to evaluate model performance beyond the historical period, but applications have remained largely qualitative. Here we compile an Arctic-wide database of mid-Holocene (5–7 thousand years ago) biomarkers to assess sea ice simulations of this past warm period. Using a recently developed proxy system model, we present a Bayesian palaeoclimate model weighting scheme that refines the multi-model mean winter sea ice extent through fully quantitative proxy-model comparisons, accounting for model interdependence and non-stationary proxy seasonality. We demonstrate that, by adjusting the contribution of each model to the ensemble mean based on proxy evidence, model weights can eliminate biases and reduce uncertainties by 85%, to the level of interannual variability. Weighted projections using the same climate models indicate that future winter sea ice extent may be nearly 1 million km2 lower than prior estimates across forthcoming decades and possible emissions scenarios, with broad implications for Arctic ecosystems, mid-latitude weather, and cryosphere stability.
On October 9th, as Hurricane Isaias closed in on the coast, Climate Central put out a rapid attribution analysis saying human-caused warming had heated the water under the storm and added about 7 mph to its winds.
Climate Central’s claim was carried by WSMV-TV and many other media outlets.
That same day, a reader asked Chris Martz about a claim attributed to Al Roker, that Isaias was fueled by a Gulf running 5 to 6 degrees above normal. Climate Realism was unable to find the claim online. It probably occurred during a TV segment.
The story you just read is true. Only the name of the Gulf has been changed.
On October 9th, as Hurricane Isaias closed in on the coast, Climate Central put out a rapid attribution analysis saying human-caused warming had heated the water under the storm and added about 7 mph to its winds.
That same day, a reader asked Chris Martz about a claim attributed to Al Roker, that Isaias was fueled by a Gulf running 5 to 6 degrees above normal. Climate Realism was unable to find the claim online. It probably occurred during a TV segment.
Chris, a friend of Climate Realism, answered with data. His post follows, with a few notes added by Charles Rotter from WUWT. Chris Martz says:
Al Roker is not an actual meteorologist.
But I am.
You ask a really good question. And while Roker has opinions, I have data.
Yes, it is true that tropical cyclones (TCs) operate as thermodynamic heat engines sustained by ocean-to-atmosphere enthalpy fluxes, including sensible and latent heat transfer, with latent heat released during condensation, which maintain the deep convection. The higher the sea surface temperatures (SSTs) are, the higher the likelihood for TC intensification.
However, SST anomalies represent departures from climatological averages rather than absolute SSTs. That means below-average SSTs can still support an intense hurricane. In fact, the Gulf of Mexico (or Gulf of America; call it whatever you want) is warm enough during late August, September, and early October every year to support a hurricane of category four or five strength. That has always been the case and it always will be.
Al Roker is not an actual meteorologist.
But I am.
You ask a really good question. And while Roker has opinions, I have data.
That’s the whole argument in one paragraph. An anomaly is a departure from average. It isn’t the temperature, and the Gulf in September is never short of fuel.
I hypothesized that Gulf SSTAs don’t really affect TC strength as commonly claimed because of this fact. So, I decided to investigate this question to provide a numerical answer. All science is numbers.
For this analysis, I decided to use the NOAA National Hurricane Center’s (NHC) HURDAT2 database, which contains historical TC tracks (coordinates), maximum sustained wind speeds (Vmax), and pressures, which contains data spanning 1851 to 2025. I then employed the Extended Reconstructed Sea Surface Temperature (ERSSTv5) dataset from NOAA, which contains monthly SST estimates on a 2° × 2° grid since January 1854. So, my analysis must be restricted from 1854 to 2025.
I identified 269 TCs that attained hurricane strength (≥64 kt / ≥74 mph) within the Gulf during the study period. Of this subset, 70 originated within the Gulf itself, while the remaining 199 developed elsewhere, primarily in the Atlantic or the Caribbean Sea, before entering the Gulf. For each hurricane, I determined its highest Vmax while inside the Gulf specifically. I then compared that intensity against the mean SSTA (calculated by evaluating SST departures from the 1991–2020 baseline) sampled along its Gulf track, using the monthly ERSSTv5 data.
Monthly SST data is not perfect, but it provides us a fairly good estimate because water has a high heat capacity, meaning it takes a lot of energy gain in order to warm a body of water and a lot of energy loss to cool it. In layman terms, SSTs are usually rather slow to change from week-to-week.
Al Roker is not an actual meteorologist.
But I am.
You ask a really good question. And while Roker has opinions, I have data.
Both datasets are NOAA’s and both are public. Available to everyone.
The results show essentially no linear relationship between Gulf SST anomalies and the maximum sustained wind speeds attained by hurricanes within the basin.
Across all 269 Gulf hurricanes, the Pearson correlation coefficient was just r = +0.036, which indicates an extremely weak positive correlation. The coefficient of determination (R²) was 0.001, meaning that variations in SST anomalies explained approximately 0.1% of the observed variation in peak hurricane intensity under a simple linear regression model. The Spearman rank correlation coefficient was similarly negligible at ρ = +0.012. Furthermore, the Pearson correlation yielded a p-value of 0.555, well above the conventional statistical significance threshold of 0.05.
Therefore, the observed relationship is not statistically significant.
Al Roker is not an actual meteorologist.
But I am.
You ask a really good question. And while Roker has opinions, I have data.
An R² of 0.001. Departures from normal account for about a tenth of one percent of how strong Gulf hurricanes get.
The scatterplot below illustrates this quite clearly. Hurricanes attaining relatively modest maximum intensities of 65–85 kt occurred across a broad range of SSTAs, as did much stronger hurricanes exceeding 100–120 kt. Some of the most intense hurricanes in the dataset occurred during periods when SSTs along their Gulf tracks were below the 1991–2020 average. Conversely, some hurricanes traversing anomalously warm waters never intensified beyond minimal hurricane strength.
In layman terms? An anomalously warm Gulf has no meaningful correlation to Gulf hurricane intensity.
Al Roker is not an actual meteorologist.
But I am.
You ask a really good question. And while Roker has opinions, I have data.
A new study led by Woods Hole Oceanographic Institution (WHOI), published in Science on or around October 15, 2026, provides the most comprehensive observational analysis of ice cliffs at the margins of Earth’s ice sheets (primarily Antarctica and Greenland).
Marine ice- cliff instability (MICI) is a hypothesized process in which tall, near- vertical ice cliffs at the edges of marine- terminating glaciers or ice sheets become structurally unstable and collapse under their own weight, potentially triggering rapid, self- sustaining retreat of the ice sheet.
AI generated by Grok
A new study led by Woods Hole Oceanographic Institution (WHOI), published in Science on or around October 15, 2026, provides the most comprehensive observational analysis of ice cliffs at the margins of Earth’s ice sheets (primarily Antarctica and Greenland).
Researchers, including lead author Caroline Needell (MIT- WHOI Joint Program doctoral student), Catherine Walker (WHOI), and Jeremy Bassis (University of Michigan), analyzed 15,330 individual satellite observations (mainly from NASA’s ICESat- 2 laser altimetry, plus some earlier airborne data).
These measured cliff heights, ice thickness, water depth, crevassing, calving rates, and how fronts evolved over time (often in ~3- month intervals over multi- year periods).
Marine Ice- Cliff Instability (MICI)
MICI is a long- debated theory proposing that ice cliffs taller than roughly 100 m above the waterline can become structurally unstable under their own weight. Collapse would expose even taller inland ice, potentially trigger rapid, self- sustaining retreat and substantially accelerate sea- level rise contributions from ice sheets. It has featured in some of the highest sea- level projections but has never been directly observed in a runaway form, leading to debate over its inclusion in models.
Key Findings
Tall ice cliffs (>~90- 100 m) are rare. Most are much shorter (e.g., 95% under ~52 m in Antarctica and ~77 m in Greenland); the tallest observed reached a bit over ~125 m. Only a small number of glaciers had cliffs near the theoretical critical height.
When tall cliffs do retreat and calve, they do so faster than existing parameterizations assume, sometimes more than three times the rate predicted by formulas used in high-end projections for a ~100 m cliff. Models may therefore underestimate short- term calving rates from tall cliffs.
However, the rapid retreat is typically short- lived rather than runaway. Glaciers often thin, retreat into regions with less favorable conditions (e.g., varying bed topography that reduces effective height, or other stabilizing factors), and re- stabilize as shorter, more stable cliffs. No observed cases showed sustained unstable retreat.
Other factors beyond pure height matter for stability, including bed topography, ice thinning rates, water depth (buoyancy effects), and mélange (the mix of ice debris at the front).
Implications
The observations confirm that some mechanical processes described by MICI occur in nature, but they also show limiting factors that can halt rapid retreat. This provides an empirical global dataset to better constrain ice- sheet models, helping reduce uncertainty in sea- level rise projections. Accurate modeling will need to incorporate variables like bed topography and thinning rates, not just cliff height.
The work was supported by the National Science Foundation, NASA, the U.S. Department of Energy, the DOMINOS project (part of the International Thwaites Glacier Collaboration), and others.
Full paper: “Empirical constraints on ice-cliff calving” (DOI: 10.1126/science.aee0658).
An ice cliff near Brown Bluff on the Antarctic Peninsula. Scientists are using observations of ice cliffs like this one to test theories about how tall cliffs may influence glacier retreat and future sea level rise. Credit: Caroline Needell, WHOI
Marine ice- cliff instability (MICI) is a hypothesized process in which tall, near- vertical ice cliffs at the edges of marine- terminating glaciers or ice sheets become structurally unstable and collapse under their own weight, potentially triggering rapid, self- sustaining retreat of the ice sheet.
Basic mechanism
Ice sheets in Greenland and Antarctica often end in the ocean either as floating ice shelves or as grounded ice cliffs. When a protective ice shelf collapses or thins away (due to warming oceans or atmosphere), it can expose a steep cliff of grounded ice.
Theory and modeling indicate that once the cliff height above the waterline exceeds a critical threshold, commonly estimated around 80- 100 meters (roughly the height of the Statue of Liberty), the stresses in the ice approach or exceed the material strength of the ice.
This can cause the cliff to fail through brittle fracture, shear, or slumping. The collapse produces icebergs and exposes a new, often taller cliff farther inland (especially in regions where the bed deepens inland, called a retrograde slope). If successive failures continually expose taller ice, the process can become a positive feedback loop of accelerating retreat.
Key factors that influence whether this occurs include:
Cliff height above water
Water depth (deeper water provides more buoyant support)
Ice thickness gradients and bed topography
Pre- existing damage or crevassing in the ice
Presence of proglacial mélange (a mix of icebergs and sea ice that can buttress the cliff)
Rates of dynamic thinning (the ice flowing and stretching and thinning as it approaches the front)
Why it matters for sea- level rise
MICI has been included in some ice- sheet models that produce the highest projections of future sea- level rise. In particular, early parameterizations suggested it could contribute to multi- meter rises over centuries by enabling rapid collapse of vulnerable regions such as the West Antarctic Ice Sheet (which holds enough ice to raise global sea level by about 3- 5 meters if fully lost). The Intergovernmental Panel on Climate Change has treated projections involving MICI with low confidence because of large uncertainties.
Controversies and observational constraints
The idea remains debated for several reasons:
True runaway MICI has never been directly observed in the modern era; it is largely inferred from theory, limited observations of tall cliffs, high- fidelity fracture models, and interpretations of past sea-level high stands.
Tall ice cliffs (near or above ~100 m) are rare today. Comprehensive satellite surveys (e.g., of more than 15,000 cliffs using ICESat- 2 and airborne laser altimetry) show that most cliffs are far shorter (means around 30 m; 95th percentiles typically under 50- 80 m depending on the ice sheet).
A 2026 study in Science (Needell, Walker, and Bassis) provided the largest observational dataset to date. It found that the tallest cliffs do calve (break off) faster than many existing model parameterizations assume, sometimes more than three times as fast for ~100 m cliffs. However, the rapid retreat phases were short-lived. Dynamic thinning and retreat into areas with smaller ice-thickness gradients caused the cliffs to stabilize rather than continue runaway collapse. The work indicates that models may underestimate short-term calving rates from tall cliffs, but that instability depends sensitively on factors beyond height alone (especially thickness gradients and topography).
In short, MICI describes a plausible mechanical pathway for accelerated ice loss after ice- shelf disintegration, but real- world observations so far show that stabilizing processes often interrupt the feedback. Improved models will need to incorporate these additional controls to narrow the range of future sea-level projections.
Rumleren Glacier calves ice from its face in South Skjoldungen Fjord, Greenland. Calving is one of the processes scientists are examining to better understand how ice cliffs break apart and retreat. Credit: Catherine Walker, WHOI
Empirical constraints on ice cliff calving
Editor’s summary
Sections of the ice cliffs at the margins of Earth’s ice sheets constantly collapse into the adjacent sea in a process called calving. Could such calving turn into a runaway retreat of the ice sheet edge if it proceeds into thick enough parts of the ice sheet past the limits of ice cliff stability? Needell et al. measured the profiles of more than 15,000 ice cliffs in Greenland and Antarctica and examined the characteristics that promote calving. Using a subset of suitable glaciers, they found that the tallest cliffs calved more rapidly than current parameterizations assume, but also that dynamic thinning and margin retreat into regions with low ice thickness gradients prevented runaway losses. —Jesse Smith
Abstract
When calving cliffs at the margins of Earth’s ice sheets exceed a critical height, runaway retreat may be initiated in a process called the marine ice cliff instability. However, sufficiently tall ice cliffs have rarely been observed. To address this gap, we measured the characteristics of 15,330 ice cliffs across Earth’s ice sheet margins using laser altimetry. We show that cliff height is highly correlated with mélange thickness, water depth, and crevassing. We found that tall cliffs calve more rapidly than parameterizations assume, but dynamic thinning and retreat into regions with low ice thickness gradients prevent runaway retreat. These observations suggest that model projections may underestimate subannual rates of cliff calving, but that the potential for instability will depend sensitively on additional quantities, not cliff height alone.
Key points from the study (drawing on the published abstract/editor summary and closely matching preprint)
Researchers compiled ~15,000 and more laser altimetry observations (primarily NASA ICESat- 2, 2018- 2023, plus earlier Operation IceBridge airborne data) of ice- cliff heights around the Antarctic and Greenland ice sheets.
Cliff- height distributions are right- skewed. Means are ~31- 33 m. The 95th percentile is only ~52 m in Antarctica and ~77 m in Greenland. Maximum observed heights are ~124- 128 m. Cliffs near or above the commonly cited ~100 m theoretical critical height (*H*crit) are rare.
Cliff height correlates positively with water depth and proglacial mélange thickness and shows a relationship with a proxy for pre- existing ice damage and crevassing (taller cliffs tend not to be the most damaged, suggesting highly stressed, damaged ice fails before reaching extreme heights). No strong link to atmospheric or sea- surface temperature was found.
Focusing on the tallest cliffs (>90 m; 16 glaciers identified), four with good repeat sampling that retreated during the study period were analyzed in detail (Fleming, Commandant Charcot, and Frost glaciers in Antarctica; Tuttulikassaap Sermia in Greenland).
Calving rates increase with cliff height and exceed existing parameterizations (e.g., the DeConto & Pollard formulation used in high -end sea- level projections) by up to a factor of ~3 for ~100 m cliffs.
Rapid retreat was observed but was short- lived. Dynamic thinning combined with retreat into regions of low ice- thickness gradient suppressed further cliff growth and prevented runaway (self- sustaining) retreat. No cases of sustained marine ice-cliff instability (MICI) were observed.
Implications: Ice- sheet models that rely solely on cliff height for calving parameterizations may underestimate short- term (sub-annual) retreat rates from tall cliffs. However, the potential for true MICI-style instability depends sensitively on additional factors, especially ice -thickness gradients, bed topography, dynamic thinning, and mélange, rather than height alone. The new observational dataset provides empirical constraints to improve these parameterizations and reduce uncertainty in sea- level rise projections.
The full text is behind the Science paywall (or institutional access). A preprint version with highly similar content is available on Research Square (DOI: 10.21203/rs.3.rs-7133627/v1). Supplementary materials (methods, additional figures, data) are linked from the Science page, and replication data have been deposited (e.g., Dryad).
When Andy Burnham returned from the summer recess to make his first Commons speech as Prime Minister, he promised MPs a “clear diagnosis” of what ails Britain. From the 1980s, he said, the country took a series of wrong turns. According to him, political power was centralised, economic assets were privatised and industry was hollowed out. Thatcher was the villain and the 1970s constituted the lost Eden. The Institute of Economic Affairs rightly called it a speech steeped in nostalgia.
“Common good” is no accident of speechwriting. It is the title of Mariana Mazzucato’s recent book.
When Andy Burnham returned from the summer recess to make his first Commons speech as Prime Minister, he promised MPs a “clear diagnosis” of what ails Britain. From the 1980s, he said, the country took a series of wrong turns. According to him, political power was centralised, economic assets were privatised and industry was hollowed out. Thatcher was the villain and the 1970s constituted the lost Eden. The Institute of Economic Affairs rightly called it a speech steeped in nostalgia. Weeks later, at the Labour conference in Liverpool, the PM went further. Invoking 1945, he declared that “we built the common good”, then promised to repeal the Thatcher-era ban on public ownership of water companies and to launch GB Grid, a publicly owned company to take on private energy operators. Energy, water and housing were to come back under “public control”.
“Common good” is no accident of speechwriting. It is the title of Mariana Mazzucato’s recent book. She is the self-billed “one of the world’s most influential economists” and her consultancies with governments, international agencies and politicians are too numerous to list here but investigative reporter Charlotte Gill’s blog provides good coverage. The day before Burnham took the Liverpool stage, she published a Project Syndicate column urging that the state’s public-finance institutions be scaled up and the fiscal rules reformed to let them “grow”. Britain, she says, has recorded the lowest public investment in the G7 for most of three decades, a gap she puts at roughly £500 billion. The column opens by welcoming Chancellor John Healey’s pledge to sharpen the focus of those institutions, which tells you who is advising whom. Mazzucato is the media’s favourite economist, whose ideas helped shape Labour’s pitch for power, and who is fêted on Channel 4, in the New Statesman and the Guardian, and on podcasts without end. She is no less active in social media (here and here).
Meanwhile one barely hears of Jon Moynihan, whose two-volume Return to Growth is probably among the most thorough audits of British stagnation, as I argued in my review. The pattern is familiar. In 1980 the Malthusian doomster Paul Ehrlich bet the economist Julian Simon that the prices of five metals would rise over a decade. All five fell, and Ehrlich mailed Simon a cheque for $576.07. Ehrlich went on collecting honours despite every one of his dire predictions failing. Simon died in 1998 with little notice from the legacy media. Mazzucato is the Paul Ehrlich of British economics, consulted by the powerful whatever the predictive or analytical worth of her work. Moynihan is the Julian Simon. Britain is being handed the Fabian compass when what it needs is Moynihan’s detailed, classical liberal reform manual.
A compass with no needle
What, exactly, is the “common good”? Not, Mazzucato insists, the economics textbook definition of public goods which the state supplies because they are non-excludable and non-rivalrous and hence unprofitable for private enterprise. In her own telling it is “an objective, not a correction”, a collectively chosen goal to be written into contracts, procurement, patents and public balance sheets from the start. The book’s “compass” has five points: purpose and direction, co-creation, collective learning, reward-sharing through “pre-distribution”, and accountability.
As I noted in my June review, there are no difficult, real world economic trade-offs in her list of items for the common good. The content of the “common good”, whether Net Zero, “shared prosperity” or public control of water, is whatever the ‘commissions’ and ‘stakeholder panels’ decide. And who decides who participates in these commission and panels? We don’t know, although it is presumed that these are democratic in construct.
Let’s examine the Climate Change Committee quango as an example. As Ross Clark notes in the Telegraph, the Committee seems to think that “it is being paid to behave like a green pressure group”. The CCC’s recommendations, while not binding on the Government, have been adopted in every instance. One can only imagine Mazzucato-style committees and panels being stuffed with fellow redistributionist Fabians and green zealots and called ‘democratic representations’ of the public. Can you imagine a Tommy Robinson being in a Mazzucato-inspired panel to discuss immigration policy in the UK?
Mazzucato dresses up her Fabian ideals in contemporary clothes. Allow private capital to remain private, but direct it permanently by public purpose as defined by experts. Burnham’s “public control” is its political twin, and the family resemblance is plain. The abstract of Mazzucato’s new UCL report frames its subject as delivering the Government’s commitment to greater public control of essential services. The IEA’s Kristian Niemietz finds the same link, calling Burnham’s ‘Manchesterism’ speech “straight out of the Mariana Mazzucato playbook”. In July, she was already telling readers how Burnham can make devolution work.
Marking her own homework
A sound economist would ask what the doctrine has actually delivered. Camden is the test case Mazzucato never tires of citing. She co-chaired its Renewal Commission in 2020-21, and her institute then drew up the blueprint for a £30 million Community Wealth Fund. Deployment did not begin until 2025, when the council committed an initial £4 million to a pilot, £2 million for a Youth Fund and £2 million for a Diversity Fund, steered by a panel of young people and a diversity panel of over 500. The Youth Fund’s first investment was £112,000 in a single outfit. After years of commissions, strategies and panels, there is little published evidence that child poverty, food access or employment in Camden has improved at all, as I set out earlier in these pages.
What the council publishes so far is mostly about ‘missions’ and process: who sits on the panels, how many residents took part, how well ‘diverse’ applicants fit the missions. None of that tells a Camden resident whether her street, her child or her small business is better off. The process has become the product, and the process is what Mazzucato’s common good project is all about. It’s all hat and no cattle, as the cousins across the pond might say. Charlotte Gill captures this best, if somewhat cynically: “A mission-led mission to use the word mission as much as mission possible.” Here is a doctrine that cannot lose. When mission-oriented policy works, the doctrine is vindicated; when it flounders, the government misunderstood the doctrine, and the remedy is a bigger mandate and a bigger balance sheet.
The UCL September report asks for precisely that. It grades the National Wealth Fund, Great British Energy and the new National Housing Bank against nine design features of a “mission-oriented” public finance institution, criteria of the author’s own devising. She, of course, finds that more scale, more coordination and looser fiscal rules are needed. A student who sets the exam, marks the paper and recommends more generous funding for her school would be viewed with suspicion. The NWF, meanwhile, was launched with a target of mobilising £3 of private money for every £1 of its own, at least £70 billion in all, and its flagship is the £38 billion Sizewell C, in which the British state is the largest shareholder at 44.9%. As Moynihan documents, such reactors cost four to five times what the Koreans or Emiratis pay, given the strangulating regulations in Britain.
Moynihan’s operating manual
Moynihan surveys the same stagnation and writes from a different prescription. Volume I organises the problem around three variables: the size of the state, the tax burden and the volume of regulation. Debt servicing costs over £100 billion a year, debt is over 110% of GDP, and the tax take is forecast to reach a historic high within five years. This is hardly a state starved of resources. Regulation is the third and deadliest variable: housebuilders tangled in habitats rules for bats while demand for homes soars, domestic oil and gas left in the ground while nuclear costs multiply, a City smothered by compliance.
None of these is a shortage of public equity. Set Mazzucato’s £500 billion against that. Her counterfactual treats public capital – which as Margaret Thatcher never tired of reminding us, is taxpayers’ money – as growth-enhancing by definition. The institutions she wants to be “scaled” inherit every constraint Moynihan documents. It would seem that Mazzucato has never read Friedrich von Hayek’s work and its lessons of the inefficiencies of government planning. She is apparently unaware that the policy-induced distortions of government planning are far worse than the market imperfections it is meant to cure. Nor, apparently, is the famous economist aware of how state control of credit, industrial licensing and foreign exchange breeds corruption and rent-seeking. Perhaps her focus on government-led “missions” as the solution to Britain’s two-decades long stagnation blinds her to the lesson that central planning concentrates power rather than creating resources. Prime Minister Burnham, with advisor Mazzucato’s assistance, has misdiagnosed Britain’s ills.
Simon’s fate, Moynihan’s warning
Why, then, does Mazzucato get the microphone? Because she tells governments what they want to hear: that they are the architects of prosperity. Moynihan tells them to shrink the state, cut taxes, slash regulation and allow the economy to grow. This is not something the elites, the state salariat and the legacy media find comfortable.
Konstantin Kisin, writing after the Liverpool speech, concluded that Burnham will get his way because voters when polled in the abstract oppose taxes and government spending in general. “But ask about anything specific and the picture inverts. 72% want higher taxes on the top 5%. 61% will pay more themselves for the NHS.” 82% want water nationalised and 76% the railways, with large majorities of Reform voters among them. It will not work, he argues, because “Britain has a production problem rather than a distribution problem”, with the tax burden already at a post-war high of 36% of GDP. Kisin believes “the whole thing will end in the kind of humiliation that lingers in the national memory for a generation”, as it is hard to see Britain breaking out of the ideology it is trapped in.
The belief that prosperity is brought about by “mission-oriented” government mandarins in Whitehall rather than created by entrepreneurs unencumbered by stifling regulations – as Ayn Rand’s novel Atlas Shrugged so memorably novelised – is a faith. And faiths are refuted by failure, not evidence. Moynihan himself expects no better: he doubts any government will adopt his reform programme short of a crisis on the scale of the late 1970s. The bond market, where 30-year gilt yields touched 6.03% on October 1st, the highest in 28 years, is watching.
Burnham’s Government will, I suspect, give Mazzucato’s compass a thorough trial: more public control, more public equity, looser fiscal rules, more missions. The Wealth Fund will report billions “mobilised”, a Camden-style panel will bless the result, and the debt-service bill will keep climbing. Britain has run this experiment before, and it ended in the 1976 crisis which led Britain to approach the IMF with the begging bowl.
Dr Mazzucato’s “mission-oriented” policy advice is Britain’s primrose path to economic disaster, and it seems there is no other path that is even faintly discernible on the horizon despite the clear programme outlined by Moynihan. Woe unto Britain indeed, it shall never again rule the waves and being enslaved to sovereign bond holders for a generation is in prospect.
Dr Tilak K. Doshi is the Daily Sceptic’s Energy Editor. He is an economist, a member of the CO2 Coalition and a former (cancelled) contributor to Forbes. Follow him onSubstackandX.


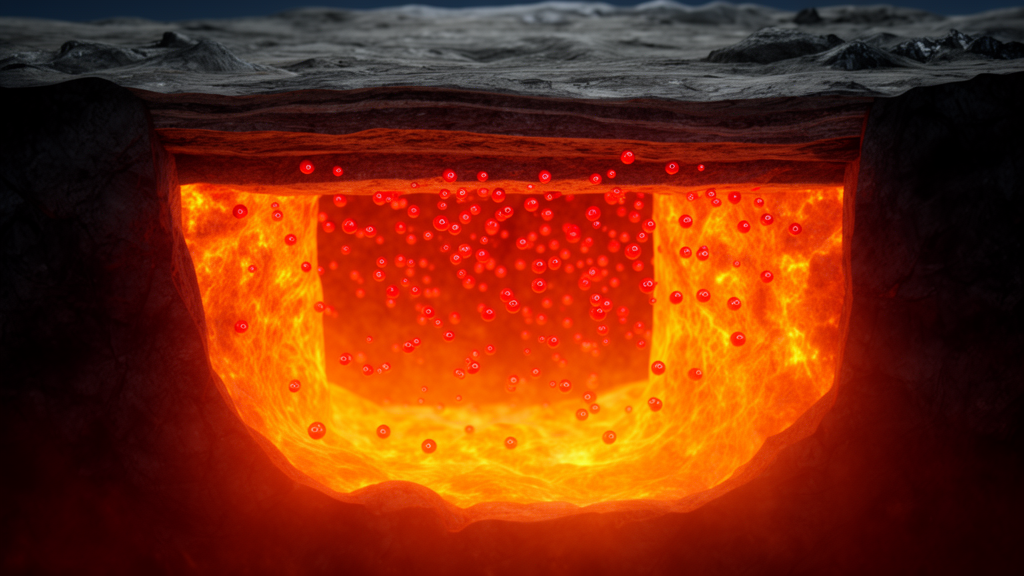
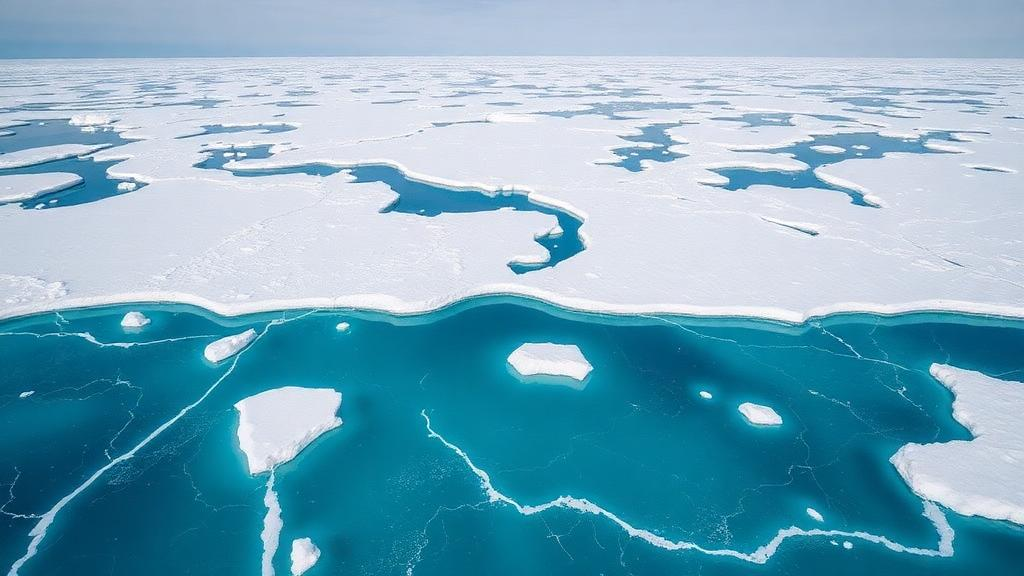
You must be logged in to post a comment.