February 2025 Oceans Keepย Cool

El Nino is a phenomenon in the climate system that happens once every four or five years.ย  Heat builds up in the equatorial Pacific to the west of Indonesia and so on.ย  Then when enough of it builds up it surges across the Pacific and changes the currents and the winds.ย  As it surges toward South America it was discovered and named in the 19th century.ย  It is well understood at this point that the phenomenon has nothing to do with CO2.

From Science Matters

Byย Ron Clutz

The best context for understanding decadal temperature changes comes from the worldโ€™s sea surface temperatures (SST), for several reasons:

  • The ocean covers 71% of the globe and drives average temperatures.
  • SSTs have a constant water content, (unlike air temperatures), so give a better reading of heat content variations.
  • A major El Nino was the dominant climate feature in recent years.

HadSST is generally regarded as the best of the global SST data sets, and so the temperature story here comes from that source. Previously I used HadSST3 for these reports, but Hadley Centre has made HadSST4 the priority, and v.3 will no longer be updated.  HadSST4 is the same as v.3, except that the older data from ship water intake was re-estimated to be generally lower temperatures than shown in v.3.  The effect is that v.4 has lower average anomalies for the baseline period 1961-1990, thereby showing higher current anomalies than v.3. This analysis concerns more recent time periods and depends on very similar differentials as those from v.3 despite higher absolute anomaly values in v.4.  More on what distinguishes HadSST3 and 4 from other SST products at the end. The user guide for HadSST4 is here.

Note:ย  When doing monthly updates of HadSST4, itโ€™s typical that values for the previous month or two will appear with slight adjustments.ย  However, this time there were scores of changed values scattered throughout the set and all values since 1979.ย  Strangely, the new values were in text format, so I needed to convert them to values in the spreadsheets.ย  Comparing the new and old datasets showed that the changes were mostly in the third decimal, and mostly negative (i.e. the adjusted value lower than the previous one.)ย  Overall, the global average anomaly since 1980 was lower by 0.01C.ย  The charts and analysis below are produced from the current data.

The Current Context

The chart below shows SST monthly anomalies as reported in HadSST3 starting in 2015 through February 2025. A global cooling pattern is seen clearly in the Tropics since its peak in 2016, joined by NH and SH cycling downward since 2016, followed by rising temperatures in 2023 and 2024.

Note that in 2015-2016 the Tropics and SH peaked in between two summer NH spikes.  That pattern repeated in 2019-2020 with a lesser Tropics peak and SH bump, but with higher NH spikes. By end of 2020, cooler SSTs in all regions took the Global anomaly well below the mean for this period.  A small warming was driven by NH summer peaks in 2021-22, but offset by cooling in SH and the tropics, By January 2023 the global anomaly was again below the mean.

Then in 2023-24 came an event resembling 2015-16 with a Tropical spike and two NH spikes alongside, all higher than 2015-16. There was also a coinciding rise in SH, and the Global anomaly was pulled up to 1.1ยฐC last year, ~0.3ยฐ higher than the 2015 peak.  Then NH started down autumn 2023, followed by Tropics and SH descending 2024 to the present. After 10 months of cooling in SH and the Tropics, the Global anomaly came back down, led by NH cooling the last 4 months from its peak in August. Itโ€™s now about 0.1C higher than the average for this period. Note that the Tropical anomaly has cooled from 1.28C in 2024/01 to 0.72C as of 2025/2.

Comment:

The climatists have seized on this unusual warming as proof their Zero Carbon agenda is needed, without addressing how impossible it would be for CO2 warming the air to raise ocean temperatures.  It is the ocean that warms the air, not the other way around.  Recently Steven Koonin had this to say about the phonomenon confirmed in the graph above:

El Nino is a phenomenon in the climate system that happens once every four or five years.ย  Heat builds up in the equatorial Pacific to the west of Indonesia and so on.ย  Then when enough of it builds up it surges across the Pacific and changes the currents and the winds.ย  As it surges toward South America it was discovered and named in the 19th century.ย  It is well understood at this point that the phenomenon has nothing to do with CO2.

Now people talk about changes in that phenomena as a result of CO2 but itโ€™s there in the climate system already and when it happens it influences weather all over the world.ย  ย We feel it when it gets rainier in Southern California for example.ย  So, for the last 3 years we have been in the opposite of an El Nino, a La Nina, part of the reason people think the West Coast has been in drought.

It has now shifted in the last months to an El Nino condition that warms the globe and is thought to contribute to this Spike we have seen. But there are other contributions as well.  One of the most surprising ones is that back in January of 2022 an enormous underwater volcano went off in Tonga and it put up a lot of water vapor into the upper atmosphere. It increased the upper atmosphere of water vapor by about 10 percent, and thatโ€™s a warming effect, and it may be that is contributing to why the spike is so high.

A longer view of SSTs

The graph below is noisy, but the density is needed to see the seasonal patterns in the oceanic fluctuations.ย  Previous posts focused on the rise and fall of the last El Nino starting in 2015.ย  This post adds a longer view, encompassing the significant 1998 El Nino and since.ย  The color schemes are retained for Global, Tropics, NH and SH anomalies.ย  Despite the longer time frame, I have kept the monthly data (rather than yearly averages) because of interesting shifts between January and July.

The graph above is noisy, but the density is needed to see the seasonal patterns in the oceanic fluctuations.  Previous posts focused on the rise and fall of the last El Nino starting in 2015.  This post adds a longer view, encompassing the significant 1998 El Nino and since.  The color schemes are retained for Global, Tropics, NH and SH anomalies.  Despite the longer time frame, I have kept the monthly data (rather than yearly averages) because of interesting shifts between January and July. 1995 is a reasonable (ENSO neutral) starting point prior to the first El Nino.

The sharp Tropical rise peaking in 1998 is dominant in the record, starting Jan. โ€™97 to pull up SSTs uniformly before returning to the same level Jan. โ€™99. There were strong cool periods before and after the 1998 El Nino event. Then SSTs in all regions returned to the mean in 2001-2.

SSTS fluctuate around the mean until 2007, when another, smaller ENSO event occurs. There is cooling 2007-8,  a lower peak warming in 2009-10, following by cooling in 2011-12.  Again SSTs are average 2013-14.

Now a different pattern appears.  The Tropics cooled sharply to Jan 11, then rise steadily for 4 years to Jan 15, at which point the most recent major El Nino takes off.  But this time in contrast to โ€™97-โ€™99, the Northern Hemisphere produces peaks every summer pulling up the Global average.  In fact, these NH peaks appear every July starting in 2003, growing stronger to produce 3 massive highs in 2014, 15 and 16.  NH July 2017 was only slightly lower, and a fifth NH peak still lower in Sept. 2018.

The highest summer NH peaks came in 2019 and 2020, only this time the Tropics and SH were offsetting rather adding to the warming. (Note: these are high anomalies on top of the highest absolute temps in the NH.)  Since 2014 SH has played a moderating role, offsetting the NH warming pulses. After September 2020 temps dropped off down until February 2021.  In 2021-22 there were again summer NH spikes, but in 2022 moderated first by cooling Tropics and SH SSTs, then in October to January 2023 by deeper cooling in NH and Tropics.

Then in 2023 the Tropics flipped from below to well above average, while NH produced a summer peak extending into September higher than any previous year.  Despite El Nino driving the Tropics January 2024 anomaly higher than 1998 and 2016 peaks, following months cooled in all regions, and the Tropics continued cooling in April, May and June along with SH dropping.  After July and August NH warming again pulled the global anomaly higher, September through January 2025 resumed cooling in all regions, with a slight upward bump in February 2025.

What to make of all this? The patterns suggest that in addition to El Ninos in the Pacific driving the Tropic SSTs, something else is going on in the NH.  The obvious culprit is the North Atlantic, since I have seen this sort of pulsing before.  After reading some papers by David Dilley, I confirmed his observation of Atlantic pulses into the Arctic every 8 to 10 years.

Contemporary AMO Observations

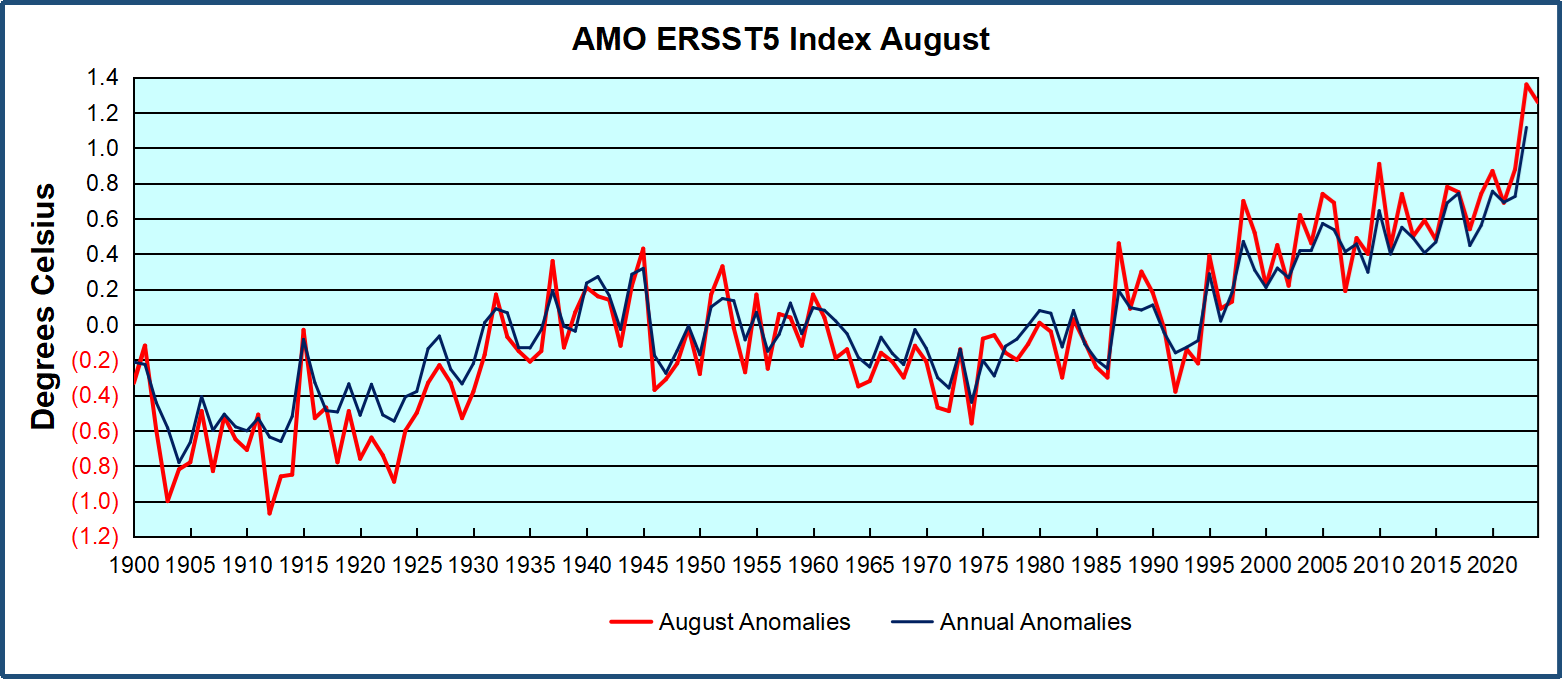
Through January 2023 I depended on the Kaplan AMO Index (not smoothed, not detrended) for N. Atlantic observations. But it is no longer being updated, and NOAA says they donโ€™t know its future.ย  So, I find that ERSSTv5 AMO dataset has current data.ย  It differs from Kaplan, which reported average absolute temps measured in N. Atlantic.ย  โ€œERSST5 AMO follows Trenberth and Shea (2006) proposal to use the NA region EQ-60ยฐN, 0ยฐ-80ยฐW and subtract the global rise of SST 60ยฐS-60ยฐN to obtain a measure of the internal variability, arguing that the effect of external forcing on the North Atlantic should be similar to the effect on the other oceans.โ€ย  So, the values represent SST anomaly differences between the N. Atlantic and the Global Ocean.

The chart above confirms what Kaplan also showed.ย  As August is the hottest month for the N. Atlantic, its variability, high and low, drives the annual results for this basin.ย  Note also the peaks in 2010, lows after 2014, and a rise in 2021. Then in 2023 the peak was holding at 1.4C before declining.ย  An annual chart below is informative:

Note the difference between blue/green years, beige/brown, and purple/red years.  2010, 2021, 2022 all peaked strongly in August or September.  1998 and 2007 were mildly warm.  2016 and 2018 were matching or cooler than the global average.  2023 started out slightly warm, then rose steadily to an  extraordinary peak in July.  August to October were only slightly lower, but by December cooled by ~0.4C.

Then in 2024 the AMO anomaly started higher than any previous year, then leveled off for two months declining slightly into April.  Remarkably, May showed an upward leap putting this on a higher track than 2023, and rising slightly higher in June.  In July, August and September 2024 the anomaly declined, and despite a small rise in October, ended close to where it began.  Now 2025 is starting much lower than the previous year.

The pattern suggests the ocean may be demonstrating a stairstep pattern like that we have also seen in HadCRUT4.

The purple line is the average anomaly 1980-1996 inclusive, value 0.17.  The orange line the average 1980-2024, value 0.38, also for the period 1997-2012. The red line is 2013-2024, value 0.67. As noted above, these rising stages are driven by the combined warming in the Tropics and NH, including both Pacific and Atlantic basins.

Curiosity:  Solar Coincidence?

The news about our current solar cycle 25 is that the solar activity is hitting peak numbers now and higher than expected 1-2 years in the future.ย  As live science put it:ย ย Solar maximum could hit us harder and sooner than we thought. How dangerous will the sunโ€™s chaotic peak be?ย ย Some charts fromย spaceweatherliveย look familar to these sea surface temperature charts.

Summary

The oceans are driving the warming this century.  SSTs took a step up with the 1998 El Nino and have stayed there with help from the North Atlantic, and more recently the Pacific northern โ€œBlob.โ€  The ocean surfaces are releasing a lot of energy, warming the air, but eventually will have a cooling effect.  The decline after 1937 was rapid by comparison, so one wonders: How long can the oceans keep this up? And is the sun adding forcing to this process?

Footnote: Why Rely on HadSST4

HadSST is distinguished from other SST products because HadCRU (Hadley Climatic Research Unit) does not engage in SST interpolation, i.e. infilling estimated anomalies into grid cells lacking sufficient sampling in a given month. From reading the documentation and from queries to Met Office, this is their procedure.

HadSST4 imports data from gridcells containing ocean, excluding land cells. From past records, they have calculated daily and monthly average readings for each grid cell for the period 1961 to 1990. Those temperatures form the baseline from which anomalies are calculated.

In a given month, each gridcell with sufficient sampling is averaged for the month and then the baseline value for that cell and that month is subtracted, resulting in the monthly anomaly for that cell. All cells with monthly anomalies are averaged to produce global, hemispheric and tropical anomalies for the month, based on the cells in those locations. For example, Tropics averages include ocean grid cells lying between latitudes 20N and 20S.

Gridcells lacking sufficient sampling that month are left out of the averaging, and the uncertainty from such missing data is estimated. IMO that is more reasonable than inventing data to infill. And it seems that the Global Drifter Array displayed in the top image is providing more uniform coverage of the oceans than in the past.

USS Pearl Harbor deploys Global Drifter Buoys in Pacific Ocean

Ocean Warms, Land Cools UAH Februaryย 2025

The post below updates the UAH record of air temperatures over land and ocean. Each month and year exposes again the growing disconnect between the real world and the Zero Carbon zealots.ย  It is as though the anti-hydrocarbon band wagon hopes to drown out the data contradicting their justification for the Great Energy Transition.ย  Yes, there was warming from an El Nino buildup coincidental with North Atlantic warming, but no basis to blame it on CO2.

From Science Matters

Byย Ron Clutz

The post below updates the UAH record of air temperatures over land and ocean. Each month and year exposes again the growing disconnect between the real world and the Zero Carbon zealots.  It is as though the anti-hydrocarbon band wagon hopes to drown out the data contradicting their justification for the Great Energy Transition.  Yes, there was warming from an El Nino buildup coincidental with North Atlantic warming, but no basis to blame it on CO2.

As an overview consider how recent rapid coolingย  completely overcame the warming from the last 3 El Ninos (1998, 2010 and 2016).ย  The UAH record shows that the effects of the last one were gone as of April 2021, again in November 2021, and in February and June 2022.ย  At year end 2022 and continuing into 2023 global temp anomaly matched or went lower than average since 1995, an ENSO neutral year. (UAH baseline is now 1991-2020). Now we have had an usual El Nino warming spike of uncertain cause, unrelated to steadily rising CO2 and now dropping steadily.

For reference I added an overlay of CO2 annual concentrations as measured at Mauna Loa.  While temperatures fluctuated up and down ending flat, CO2 went up steadily by ~60 ppm, a 15% increase.

Furthermore, going back to previous warmings prior to the satellite record shows that the entire rise of 0.8C since 1947 is due to oceanic, not human activity.

gmt-warming-events

The animation is an update of a previous analysis from Dr. Murry Salby.  These graphs use Hadcrut4 and include the 2016 El Nino warming event.  The exhibit shows since 1947 GMT warmed by 0.8 C, from 13.9 to 14.7, as estimated by Hadcrut4.  This resulted from three natural warming events involving ocean cycles. The most recent rise 2013-16 lifted temperatures by 0.2C.  Previously the 1997-98 El Nino produced a plateau increase of 0.4C.  Before that, a rise from 1977-81 added 0.2C to start the warming since 1947.

Importantly, the theory of human-caused global warming asserts that increasing CO2 in the atmosphere changes the baseline and causes systemic warming in our climate.  On the contrary, all of the warming since 1947 was episodic, coming from three brief events associated with oceanic cycles. And now in 2024 we have seen an amazing episode with a temperature spike driven by ocean air warming in all regions, along with rising NH land temperatures, now dropping below its peak.

Chris Schoeneveld has produced a similar graph to the animation above, with a temperature series combining HadCRUT4 and UAH6. H/T WUWT

See Also Worst Threat: Greenhouse Gas or Quiet Sun?

February 2025 Ocean Warms, Land Cools

With apologies to Paul Revere, this post is on the lookout for cooler weather with an eye on both the Land and the Sea.  While you heard a lot about 2020-21 temperatures matching 2016 as the highest ever, that spin ignores how fast the cooling set in.  The UAH data analyzed below shows that warming from the last El Nino had fully dissipated with chilly temperatures in all regions. After a warming blip in 2022, land and ocean temps dropped again with 2023 starting below the mean since 1995.  Spring and Summer 2023 saw a series of warmings, continuing into 2024 peaking in April, then cooling off to the present.

UAH has updated their TLT (temperatures in lower troposphere) dataset for February 2025. Due to one satellite drifting more than can be corrected, the dataset has been recalibrated and retitled as version 6.1 Graphs here contain this updated 6.1 data.  Posts on their reading of ocean air temps this month are ahead of the update from HadSST4.  I posted recently on SSTs January 2025 Oceans Still Cool. These posts have a separate graph of land air temps because the comparisons and contrasts are interesting as we contemplate possible cooling in coming months and years.

Sometimes air temps over land diverge from ocean air changes. In July 2024 all oceans were unchanged except for Tropical warming, while all land regions rose slightly. In August we saw a warming leap in SH land, slight Land cooling elsewhere, a dip in Tropical Ocean temp and slightly elsewhere.  September showed a dramatic drop in SH land, overcome by a greater NH land increase. This month has contrasting warming in ocean air anomalies, especially in SH, somewhat offset by land air cooling especially in NH.

Note:  UAH has shifted their baseline from 1981-2010 to 1991-2020 beginning with January 2021.   v6.1 data was recalibrated also starting with 2021. In the charts below, the trends and fluctuations remain the same but the anomaly values changed with the baseline reference shift.

Presently sea surface temperatures (SST) are the best available indicator of heat content gained or lost from earthโ€™s climate system.  Enthalpy is the thermodynamic term for total heat content in a system, and humidity differences in air parcels affect enthalpy.  Measuring water temperature directly avoids distorted impressions from air measurements.  In addition, ocean covers 71% of the planet surface and thus dominates surface temperature estimates.  Eventually we will likely have reliable means of recording water temperatures at depth.

Recently, Dr. Ole Humlum reported from his research thatย air temperatures lag 2-3 months behind changes in SST.ย  Thus, cooling oceans portend cooling land air temperatures to follow.ย  He also observed that changes in CO2 atmospheric concentrations lag behind SST by 11-12 months.ย  This latter point is addressed in a previous postย Who to Blame for Rising CO2?

After a change in priorities, updates are now exclusive to HadSST4.  For comparison we can also look at lower troposphere temperatures (TLT) from UAHv6.1 which are now posted for February 2025.  The temperature record is derived from microwave sounding units (MSU) on board satellites like the one pictured above. Recently there was a change in UAH processing of satellite drift corrections, including dropping one platform which can no longer be corrected. The graphs below are taken from the revised and current dataset.

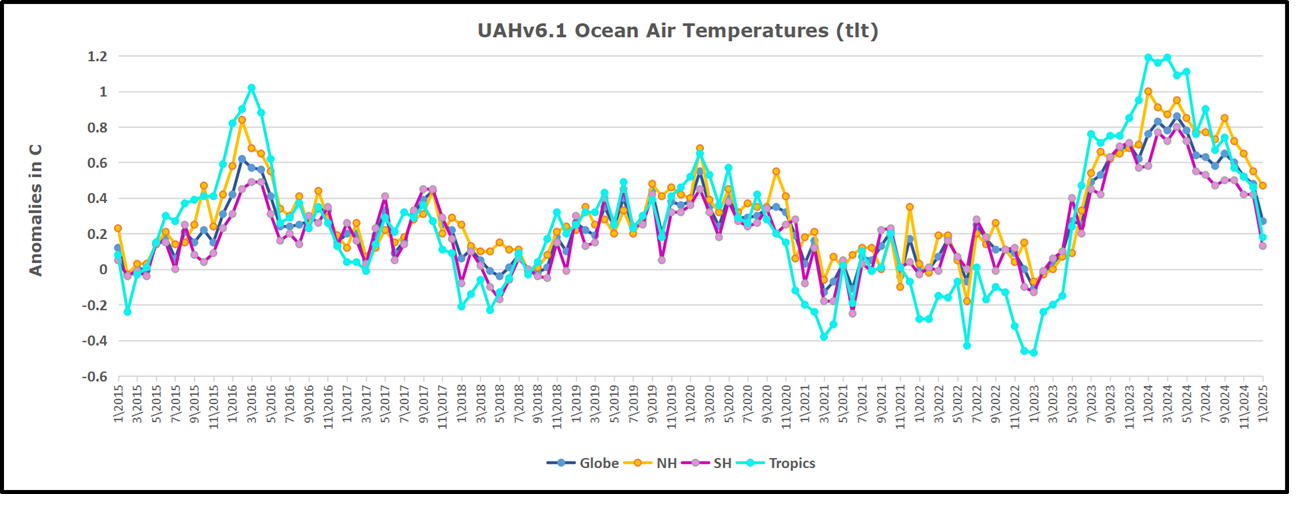
The UAH dataset includes temperature results for air above the oceans and thus should be most comparable to the SSTs. There is the additional feature that ocean air temps avoid Urban Heat Islands (UHI).ย  The graph below shows monthly anomalies for ocean air temps since January 2015.

In 2021-22, SH and NH showed spikes up and down while the Tropics cooled dramatically, with some ups and downs, but hitting a new low in January 2023. At that point all regions were more or less in negative territory.

After sharp cooling everywhere in January 2023, there was a remarkable spiking of Tropical Ocean temps from -0.5C up to + 1.2C in January 2024.ย  The rise was matched by other regions in 2024, such that the Global anomaly peaked at 0.86C in April. Since then, all regions have cooled down sharply.ย  In February 2025, SH rose from 0.1C to 0.4C pulling the Global Ocean air anomaly up from 0.3C to 0.5C.

Land Air Temperatures Tracking in Seesaw Pattern

We sometimes overlook that in climate temperature records, while the oceans are measured directly with SSTs, land temps are measured only indirectly.ย  The land temperature records at surface stations sample air temps at 2 meters above ground.ย  UAH gives TLT anomalies for air over land separately from ocean air temps.ย  The graph updated for February is below.

Here we have fresh evidence of the greater volatility of the Land temperatures, along with extraordinary departures by SH land.ย  The seesaw pattern in Land temps is similar to ocean temps 2021-22, except that SH is the outlier, hitting bottom in January 2023. Then exceptionally SH goes from -0.6C up to 1.4C in September 2023 and 1.8C in August 2024, with a large drop in between.ย  In November, SH and the Tropics pulled the Global Land anomaly further down despite a bump in NH land temps. February showed a sharp drop in NH land air temps from 1.07C down to 0.56C, pulling the Global land anomaly downward from 0.9C to 0.6C.

The Bigger Picture UAH Global Since 1980

The chart shows monthly Global Land and Ocean anomalies starting 01/1980 to present.  The average monthly anomaly is -0.03, for this period of more than four decades.  The graph shows the 1998 El Nino after which the mean resumed, and again after the smaller 2010 event. The 2016 El Nino matched 1998 peak and in addition NH after effects lasted longer, followed by the NH warming 2019-20.   An upward bump in 2021 was reversed with temps having returned close to the mean as of 2/2022.  March and April brought warmer Global temps, later reversed

With the sharp drops in Nov., Dec. and January 2023 temps, there was no increase over 1980. Then in 2023 the buildup to the October/November peak exceeded the sharp April peak of the El Nino 1998 event. It also surpassed the February peak in 2016. In 2024 March and April took the Global anomaly to a new peak of 0.94C.ย  The cool down started with May dropping to 0.9C, and in June a further decline to 0.8C.ย  October went down to 0.7C, November and December dropped to 0.6C. February is down to 0.5C.

The graph reminds of another chart showing the abrupt ejection of humid air from Hunga Tonga eruption.

TLTs include mixing above the oceans and probably some influence from nearby more volatile land temps.ย  Clearly NH and Global land temps have been dropping in a seesaw pattern, nearly 1C lower than the 2016 peak.ย  Since the ocean has 1000 times the heat capacity as the atmosphere, that cooling is a significant driving force.ย  TLT measures started the recent cooling later than SSTs from HadSST4 but are now showing the same pattern. Despite the three El Ninos, their warming had not persisted prior to 2023, and without them it would probably have cooled since 1995.ย  Of course, the future has not yet been written.

Cyclone Alfred: Climate Disaster or Inadequate Flood Control?

Cyclone Alfred, Australiaโ€™s big East Coast cyclone was until recently hyped as a symptom of the climate apocalypse. But doomsayers are facing another disappointment from nature.

From Watts Up With That?

Essay by Eric Worrall

Cyclone Alfred, Australiaโ€™s big East Coast cyclone was until recently hyped as a symptom of the climate apocalypse. But doomsayers are facing another disappointment from nature.

Is climate change supercharging Tropical Cyclone Alfred as it powers towards Australia?

Cyclone Alfred formed in the Coral Sea towards the end of February when sea surface temperatures were almost 1C hotter than usual

Tropical Cyclone Alfred is due to hit south-east Queensland some time on Saturday morning, bringing the risk of destructive winds, extreme flooding and storm surges to millions of people around Brisbane, the Gold Coast and northern New South Wales.

After last year was recorded as the hottest on record around the world, and the hottest for Australiaโ€™s oceans, what role could the climate crisis be playing in Tropical Cyclone Alfred and its impacts?

โ€ฆRead more: 

https://www.theguardian.com/australia-news/2025/mar/06/is-climate-change-supercharging-tropical-cyclone-alfred-as-it-powers-towards-australia

Fortunately Cyclone Alfred is turning into a fizzle. A powerful storm which will bring lots of rain and flooding, but no longer a catastrophic cyclone.

AS IT HAPPENED: Cyclone Alfred downgraded as it nears coast, expected to cross between Maroochydore and Brisbane; Albanese scraps plan for April election; โ€˜Dangerous times aheadโ€™ as wind, rain hammer millions

By Adam Vidler Daniel Jeffrey Emily Bennett Yashee Sharma 12:30am Mar 8, 2025

Tropical Cyclone Alfred downgraded

By Karishma Sarkari07 Mar 2025 23:25

Cyclone Alfred has been downgraded to a category 1 storm in the latest advice issued by the Bureau of Meteorology.

The system is moving north-west at 9km/h, pushing back the timing itโ€™s forecast to cross the coast.

Alfred is still on track to cross over the Moreton Bay Islands early on Saturday morning before crossing the mainland coast between Brisband and Maroochydore later in the day.

The cyclone is forecast to weaken as it moves inland late Saturday and Sunday.

While damaging wind gusts up to 120km/h and heavy to intense rainfall is still forecast, bringing the possibility of life-threatening flash flooding, the weather bureau says destructive wind gusts are no longer expected.

โ€ฆRead more: 

https://www.9news.com.au/national/tropical-cyclone-alfred-live-updates-tracker-queensland-power-outages-evacuations-latest-news-headlines/13081401-e614-459c-b757-a972f4037c5d#post=6854bfed-e01d-443d-b2c2-874df6f99ceb

Are Aussie cyclones becoming more frequent?

The following is a rather confused statement from the Australian CSIRO, Australiaโ€™s peak scientific body. Cyclone frequency is declining, but their broken theories suggest cyclone frequency should be rising.

3. Has the frequency of tropical cyclones changed?

Research has shown a statistically-significant downward trend in the annual number of tropical cyclones in the Australian region over the period extending from 1981/82 to 2017/18, during the period of satellite images. The reasons for this downward trend are still being determined but are likely to be due to a combination of both natural variability and longer-term climate change. Additional non-satellite observations suggest there has also been a longer-term reduction in the number of tropical cyclones since 1900.

The Bureau of Meteorologyโ€™s satellite record is relatively short and there have been changes in the historical methods of analysis. Combined with the high variability in tropical cyclone numbers and influences of natural variability such as the El Niรฑo-Southern Oscillation, it makes it difficult to attribute trends to any single factor.

However, it is clear that sea surface temperatures off the northern Australian coast have increased โ€“ part of a significant warming of the oceans that has been observed in the past 50 years due to increases in greenhouse gases. Warmer oceans tend to increase the amount of moisture that gets transported from the ocean to the atmosphere, and a warmer atmosphere can hold more moisture and so there is a greater potential for intense rainfall events with tropical cyclones.

โ€ฆRead more: 

https://www.csiro.au/en/news/All/Articles/2025/March/things-to-know-about-tropical-cyclones

Obviously, the risk of damaging floods is still a serious concern, and the remnants of the cyclone may dump a lot of water into Brisbaneโ€™s rivers or other low laying areas. But there may be another explanation for why that flood risk in Brisbane is so severe.

From a few days ago;

โ€ฆ

โ€˜Anxiously watchingโ€™: Huge Cyclone call made 

Even though South East Queenslandโ€™s dams are almost full, not a single litre of water will be released until Alfredโ€™s predicted 600mm of rain starts to fall. 

โ€œWe donโ€™t always know when and where rain will fall,โ€ a Seqwater spokesperson told The Courier-Mail. 

โ€œOur 24/7 Flood Operations Centre is mobilised and โ€“ pending rainfall โ€“ is prepared to make controlled, gated releases later this week if required.โ€

โ€ฆRead more:ย 

https://www.goldcoastbulletin.com.au/technology/environment/no-south-east-queensland-dam-releases-until-rain-from-cyclone-alfred-begins/news-story/be556f1df0aaa66a41bbd3fac8549fda

Why are dam operators being ordered to cling on to every drop of water until the last possible moment? The reason of course, is not enough dam capacity. As Brisbane and other Queensland city populations have boomed, there has been little interest in providing water resources to match the growing population. The result is dam operators have to hang on to every drop of water, and only release that water when they are certain incoming storms will hit their catchment area โ€“ even when the incoming storm is a cyclone.

SEQ does not have enough drinking water for booming population

By Felicity Caldwell
August 19, 2021 โ€” 8.00pm

South-east Queensland will not have enough drinking water to support its rapidly growing population amid fears the regionโ€™s dams will struggle to supply millions of extra residents.

The revelation comes as residents could be forced to endure mandatory water restrictions in less than four months.

A stark warning about the need for new water sources โ€“ such as a dam or desalination plant โ€“ was emailed to Water Minister Glenn Butcherโ€™s office in December, with a report revealing demand for water would increase as the south-east Queensland population grew by more than two million people over the next 25 years.

โ€ฆRead more:ย 

https://www.brisbanetimes.com.au/politics/queensland/seq-does-not-have-enough-drinking-water-for-booming-population-20210818-p58jqd.html

If the dams had greater capacity, there would be much less risk of flooding โ€“ dam operators could confidently run their dams down in the face of rainfall threats, without fear of water shortages if the rain misses. The spare dam capacity could be used to soak up floodwater in the catchment area which feeds the dam.

The picture at the top of the article shows the potential consequences of failing to release dam water until the last minute.

In 2013 Brisbane was impacted by Cyclone Oswald, and suffered a severe rainfall and flooding event.

Then as now, dam operators were ordered to delay release until the last moment. The result was catastrophic โ€“ when 3ft+ of rain abruptly dumped into the catchment area of the Wivenhoe Dam, dam operators were forced to open the floodgates to save the dam, raising the Brisbane River well above normal height. The torrential dam outflow collided with the cyclonic low pressure storm surge rushing in from the sea in Brisbaneโ€™s most expensive business and residential district.

Colleges Crossing, pictured at the top of this article, is the main outflow of the Wivenhoe Dam, the water reservoir which supplies the state capital Brisbane. The water which passes through Colleges Crossing feeds into the Brisbane River, which in 2013 was a major contributor to inner city flooding. My home at the time became an island as spillway water flooded across the lowlands, cutting all the roads, and bringing misery to riverside property owners downstream of the dam.

My point is flood disasters in Brisbane have nothing to do with climate change. I doubt flood risk could ever be completely eliminated in a subtropical location like Brisbane, but floods could be mitigated by better flood control, including enlarging existing dams or building new dams. Larger dam capacity would give dam operators the confidence to run down water levels in the face of a dangerous rainfall event, even if they were not sure if the rain would hit the dam catchment, instead of clinging on to water until the last minute, then flooding the city of Brisbane with an emergency release to save the dam from catastrophic failure.


Update (EW): Brisbane might get lucky this time, the heaviest rain appears to be slightly to the South East of the Wivenhoe catchment, though since this rain is expected to last a few days there may still be a risk. It is likely just the rain over Brisbane could create at least minor flooding.

Rain in Brisbane 8am local time 09 March 2025. Source Australian BOM

Update (EW): h/t Rick Will โ€“ Wivenhoe has a webcam โ€“ https://widget.coastalcoms.com/video/ccef2b42-a849-435e-8dbd-6fef8731c6b9

Update (EW): Looks like Brisbane is having problems with flash flooding.

January 2025 Oceans Stillย Cool

The climatists have seized on this unusual warming as proof their Zero Carbon agenda is needed, without addressing how impossible it would be for CO2 warming the air to raise ocean temperatures.ย  It is the ocean that warms the air, not the other way around.ย 

From Science Matters

Byย Ron Clutz

The best context for understanding decadal temperature changes comes from the worldโ€™s sea surface temperatures (SST), for several reasons:

  • The ocean covers 71% of the globe and drives average temperatures;
  • SSTs have a constant water content, (unlike air temperatures), so give a better reading of heat content variations;
  • A major El Nino was the dominant climate feature in recent years.

HadSST is generally regarded as the best of the global SST data sets, and so the temperature story here comes from that source. Previously I used HadSST3 for these reports, but Hadley Centre has made HadSST4 the priority, and v.3 will no longer be updated.  HadSST4 is the same as v.3, except that the older data from ship water intake was re-estimated to be generally lower temperatures than shown in v.3.  The effect is that v.4 has lower average anomalies for the baseline period 1961-1990, thereby showing higher current anomalies than v.3. This analysis concerns more recent time periods and depends on very similar differentials as those from v.3 despite higher absolute anomaly values in v.4.  More on what distinguishes HadSST3 and 4 from other SST products at the end. The user guide for HadSST4 is here.

Note:  When doing monthly updates of HadSST4, itโ€™s typical that values for the previous month or two will appear with slight adjustments.  However this time there were scores of changed values scattered throughout the set and all values since 1979.  Strangely, the new values were in text format, so I needed to convert them to values in the spreadsheets.  Comparing the new and old datasets showed that the changes were mostly in the third decimal, and mostly negative (i.e. the adjusted value lower than the previous one.)  Overall, the global average anomaly since 1980 was lower by 0.01C.  The charts and analysis below is produced from the current data.

The Current Context

The chart below shows SST monthly anomalies as reported in HadSST3 starting in 2015 through January 2025. A global cooling pattern is seen clearly in the Tropics since its peak in 2016, joined by NH and SH cycling downward since 2016, followed by rising temperatures in 2023 and 2024.

Note that in 2015-2016 the Tropics and SH peaked in between two summer NH spikes.  That pattern repeated in 2019-2020 with a lesser Tropics peak and SH bump, but with higher NH spikes. By end of 2020, cooler SSTs in all regions took the Global anomaly well below the mean for this period.  A small warming was driven by NH summer peaks in 2021-22, but offset by cooling in SH and the tropics, By January 2023 the global anomaly was again below the mean.

Now in 2023-24 came an event resembling 2015-16 with a Tropical spike and two NH spikes alongside, all higher than 2015-16. There was also a coinciding rise in SH, and the Global anomaly was pulled up to 1.1ยฐC last year, ~0.3ยฐ higher than the 2015 peak.  Then NH started down autumn 2023, followed by Tropics and SH descending 2024 to the present. After 10 months of cooling in SH and the Tropics, the Global anomaly came back down, led by NH cooling the last 4 months from its peak in August. Itโ€™s now about 0.1C higher than the average for this period. Note that the Tropical anomaly has cooled from 1.28C in 2024/01 to 0.63C as of 2025/1.

Comment:

The climatists have seized on this unusual warming as proof their Zero Carbon agenda is needed, without addressing how impossible it would be for CO2 warming the air to raise ocean temperatures.  It is the ocean that warms the air, not the other way around.  Recently Steven Koonin had this to say about the phonomenon confirmed in the graph above:

El Nino is a phenomenon in the climate system that happens once every four or five years.  Heat builds up in the equatorial Pacific to the west of Indonesia and so on.  Then when enough of it builds up it surges across the Pacific and changes the currents and the winds.  As it surges toward South America it was discovered and named in the 19th century  It iswell understood at this point that the phenomenon has nothing to do with CO2.

Now people talk about changes in that phenomenon as a result of CO2 but itโ€™s there in the climate system already and when it happens it influences weather all over the world.ย  ย We feel it when it gets rainier in Southern California for example.ย  So, for the last 3 years we have been in the opposite of an El Nino, a La Nina, part of the reason people think the West Coast has been in drought.

It has now shifted in the last months to an El Nino condition that warms the globe and is thought to contribute to this Spike we have seen. But there are other contributions as well.  One of the most surprising ones is that back in January of 2022 an enormous underwater volcano went off in Tonga and it put up a lot of water vapor into the upper atmosphere. It increased the upper atmosphere of water vapor by about 10 percent, and thatโ€™s a warming effect, and it may be that is contributing to why the spike is so high.

A longer view of SSTs

The graph below is noisy, but the density is needed to see the seasonal patterns in the oceanic fluctuations.ย  Previous posts focused on the rise and fall of the last El Nino starting in 2015.ย  This post adds a longer view, encompassing the significant 1998 El Nino and since.ย  The color schemes are retained for Global, Tropics, NH and SH anomalies.ย  Despite the longer time frame, I have kept the monthly data (rather than yearly averages) because of interesting shifts between January and July.

The graph above is noisy, but the density is needed to see the seasonal patterns in the oceanic fluctuations.  Previous posts focused on the rise and fall of the last El Nino starting in 2015.  This post adds a longer view, encompassing the significant 1998 El Nino and since.  The color schemes are retained for Global, Tropics, NH and SH anomalies.  Despite the longer time frame, I have kept the monthly data (rather than yearly averages) because of interesting shifts between January and July. 1995 is a reasonable (ENSO neutral) starting point prior to the first El Nino.

The sharp Tropical rise peaking in 1998 is dominant in the record, starting Jan. โ€™97 to pull up SSTs uniformly before returning to the same level Jan. โ€™99. There were strong cool periods before and after the 1998 El Nino event. Then SSTs in all regions returned to the mean in 2001-2.

SSTS fluctuate around the mean until 2007, when another, smaller ENSO event occurs. There is cooling 2007-8, a lower peak warming in 2009-10, following by cooling in 2011-12.ย  Again, SSTs are average 2013-14.

Now a different pattern appears.  The Tropics cooled sharply to Jan 11, then rise steadily for 4 years to Jan 15, at which point the most recent major El Nino takes off.  But this time in contrast to โ€™97-โ€™99, the Northern Hemisphere produces peaks every summer pulling up the Global average.  In fact, these NH peaks appear every July starting in 2003, growing stronger to produce 3 massive highs in 2014, 15 and 16.  NH July 2017 was only slightly lower, and a fifth NH peak still lower in Sept. 2018.

The highest summer NH peaks came in 2019 and 2020, only this time the Tropics and SH were offsetting rather adding to the warming. (Note: these are high anomalies on top of the highest absolute temps in the NH.)  Since 2014 SH has played a moderating role, offsetting the NH warming pulses. After September 2020 temps dropped off down until February 2021.  In 2021-22 there were again summer NH spikes, but in 2022 moderated first by cooling Tropics and SH SSTs, then in October to January 2023 by deeper cooling in NH and Tropics.

Then in 2023 the Tropics flipped from below to well above average, while NH produced a summer peak extending into September higher than any previous year.  Despite El Nino driving the Tropics January 2024 anomaly higher than 1998 and 2016 peaks, following months cooled in all regions, and the Tropics continued cooling in April, May and June along with SH dropping.  After July and August NH warming again pulled the global anomaly higher, September and October resumed cooling in all regions.

What to make of all this? The patterns suggest that in addition to El Ninos in the Pacific driving the Tropic SSTs, something else is going on in the NH.  The obvious culprit is the North Atlantic, since I have seen this sort of pulsing before.  After reading some papers by David Dilley, I confirmed his observation of Atlantic pulses into the Arctic every 8 to 10 years.

Contemporary AMO Observations

Through January 2023 I depended on the Kaplan AMO Index (not smoothed, not detrended) for N. Atlantic observations. But it is no longer being updated, and NOAA says they donโ€™t know its future.ย  So, I find that ERSSTv5 AMO dataset has current data.ย  It differs from Kaplan, which reported average absolute temps measured in N. Atlantic.ย  โ€œERSST5 AMO follows Trenberth and Shea (2006) proposal to use the NA region EQ-60ยฐN, 0ยฐ-80ยฐW and subtract the global rise of SST 60ยฐS-60ยฐN to obtain a measure of the internal variability, arguing that the effect of external forcing on the North Atlantic should be similar to the effect on the other oceans.โ€ย  So, the values represent SST anomaly differences between the N. Atlantic and the Global Ocean.

The chart above confirms what Kaplan also showed.ย  As August is the hottest month for the N. Atlantic, its variability, high and low, drives the annual results for this basin.ย  Note also the peaks in 2010, lows after 2014, and a rise in 2021. Then in 2023 the peak was holding at 1.4C before declining.ย  An annual chart below is informative:

Note the difference between blue/green years, beige/brown, and purple/red years.ย  2010, 2021, 2022 all peaked strongly in August or September.ย  1998 and 2007 were mildly warm.ย  2016 and 2018 were matching or cooler than the global average.ย  2023 started out slightly warm, then rose steadily to an extraordinary peak in July.ย  August to October were only slightly lower, but by December cooled by ~0.4C.

Then in 2024 the AMO anomaly started higher than any previous year, then leveled off for two months declining slightly into April.  Remarkably, May showed an upward leap putting this on a higher track than 2023, and rising slightly higher in June.  In July, August and September 2024 the anomaly declined, and despite a small rise in October, ended close to where it began.  Now 2025 is starting lower than the previous year.

The pattern suggests the ocean may be demonstrating a stairstep pattern like that we have also seen in HadCRUT4.

The purple line is the average anomaly 1980-1996 inclusive, value 0.17.  The orange line the average 1980-2024, value 0.38, also for the period 1997-2012. The red line is 2013-2024, value 0.67. As noted above, these rising stages are driven by the combined warming in the Tropics and NH, including both Pacific and Atlantic basins.

Curiosity:  Solar Coincidence?

The news about our current solar cycle 25 is that the solar activity is hitting peak numbers now and higher  than expected 1-2 years in the future.  As livescience put it:  Solar maximum could hit us harder and sooner than we thought. How dangerous will the sunโ€™s chaotic peak be?  Some charts from spaceweatherlive look familar to these sea surface temperature charts.

Summary

The oceans are driving the warming this century.  SSTs took a step up with the 1998 El Nino and have stayed there with help from the North Atlantic, and more recently the Pacific northern โ€œBlob.โ€  The ocean surfaces are releasing a lot of energy, warming the air, but eventually will have a cooling effect.  The decline after 1937 was rapid by comparison, so one wonders: How long can the oceans keep this up? And is the sun adding forcing to this process?

Footnote: Why Rely on HadSST4

HadSST is distinguished from other SST products because HadCRU (Hadley Climatic Research Unit) does not engage in SST interpolation, i.e. infilling estimated anomalies into grid cells lacking sufficient sampling in a given month. From reading the documentation and from queries to Met Office, this is their procedure.

HadSST4 imports data from gridcells containing ocean, excluding land cells. From past records, they have calculated daily and monthly average readings for each grid cell for the period 1961 to 1990. Those temperatures form the baseline from which anomalies are calculated.

In a given month, each gridcell with sufficient sampling is averaged for the month and then the baseline value for that cell and that month is subtracted, resulting in the monthly anomaly for that cell. All cells with monthly anomalies are averaged to produce global, hemispheric and tropical anomalies for the month, based on the cells in those locations. For example, Tropics averages include ocean grid cells lying between latitudes 20N and 20S.

Gridcells lacking sufficient sampling that month are left out of the averaging, and the uncertainty from such missing data is estimated. IMO that is more reasonable than inventing data to infill. And it seems that the Global Drifter Array displayed in the top image is providing more uniform coverage of the oceans than in the past.

USS Pearl Harbor deploys Global Drifter Buoys in Pacific Ocean

Oceans Rapidly Cooling UAH Januaryย 2025

The post below updates the UAH record of air temperatures over land and ocean. Each month and year expose again the growing disconnect between the real world and the Zero Carbon zealots.ย  It is as though the anti-hydrocarbon band wagon hopes to drown out the data contradicting their justification for the Great Energy Transition.ย  Yes, there was warming from an El Nino buildup coincidental with North Atlantic warming, but no basis to blame it on CO2.ย ย 

From Science Matters

Byย Ron Clutz

The post below updates the UAH record of air temperatures over land and ocean. Each month and year expose again the growing disconnect between the real world and the Zero Carbon zealots.ย  It is as though the anti-hydrocarbon band wagon hopes to drown out the data contradicting their justification for the Great Energy Transition.ย  Yes, there was warming from an El Nino buildup coincidental with North Atlantic warming, but no basis to blame it on CO2.ย ย 

As an overview consider how recent rapid cooling completely overcame the warming from the last 3 El Ninos (1998, 2010 and 2016).ย  The UAH record shows that the effects of the last one were gone as of April 2021, again in November 2021, and in February and June 2022.ย  At year end 2022 and continuing into 2023 global temp anomaly matched or went lower than average since 1995, an ENSO neutral year. (UAH baseline is now 1991-2020). Now we have had an usual El Nino warming spike of uncertain cause, unrelated to steadily rising CO2 and now dropping steadily.

For reference I added an overlay of CO2 annual concentrations as measured at Mauna Loa.  While temperatures fluctuated up and down ending flat, CO2 went up steadily by ~60 ppm, a 15% increase.

Furthermore, going back to previous warmings prior to the satellite record shows that the entire rise of 0.8C since 1947 is due to oceanic, not human activity.

gmt-warming-events

The animation is an update of a previous analysis from Dr. Murry Salby.  These graphs use Hadcrut4 and include the 2016 El Nino warming event.  The exhibit shows since 1947 GMT warmed by 0.8 C, from 13.9 to 14.7, as estimated by Hadcrut4.  This resulted from three natural warming events involving ocean cycles. The most recent rise 2013-16 lifted temperatures by 0.2C.  Previously the 1997-98 El Nino produced a plateau increase of 0.4C.  Before that, a rise from 1977-81 added 0.2C to start the warming since 1947.

Importantly, the theory of human-caused global warming asserts that increasing CO2 in the atmosphere changes the baseline and causes systemic warming in our climate.  On the contrary, all of the warming since 1947 was episodic, coming from three brief events associated with oceanic cycles. And now in 2024 we have seen an amazing episode with a temperature spike driven by ocean air warming in all regions, along with rising NH land temperatures, now dropping below its peak.

Chris Schoeneveld has produced a similar graph to the animation above, with a temperature series combining HadCRUT4 and UAH6. H/T WUWT

See Also Worst Threat: Greenhouse Gas or Quiet Sun?

January 2025 Ocean Leads Global Cooling

With apologies to Paul Revere, this post is on the lookout for cooler weather with an eye on both the Land and the Sea.  While you heard a lot about 2020-21 temperatures matching 2016 as the highest ever, that spin ignores how fast the cooling set in.  The UAH data analyzed below shows that warming from the last El Nino had fully dissipated with chilly temperatures in all regions. After a warming blip in 2022, land and ocean temps dropped again with 2023 starting below the mean since 1995.  Spring and Summer 2023 saw a series of warmings, continuing into October, followed by cooling in November and December.

UAH has updated their TLT (temperatures in lower troposphere) dataset for January 2025. Due to one satellite drifting more than can be corrected, the dataset has been recalibrated and retitled as version 6.1 Graphs here contain this updated 6.1 data.  Posts on their reading of ocean air temps this month are ahead of the update from HadSST4.  I posted recently on SSTs Ocean Even Cooler December 2024. These posts have a separate graph of land air temps because the comparisons and contrasts are interesting as we contemplate possible cooling in coming months and years.

Sometimes air temps over land diverge from ocean air changes. In July 2024 all oceans were unchanged except for Tropical warming, while all land regions rose slightly. In August we saw a warming leap in SH land, slight Land cooling elsewhere, a dip in Tropical Ocean temp and slightly elsewhere.  September showed a dramatic drop in SH land, overcome by a greater NH land increase. In October, ocean and land temps in both NH and Tropics dropped, pulling the global anomaly down. As was the case in November and December, now in January there was cooling everywhere, strongest in all ocean anomalies.

Note:ย  UAH has shifted their baseline from 1981-2010 to 1991-2020 beginning with January 2021.ย  ย v6.1 data was recalibrated also starting with 2021. In the charts below, the trends and fluctuations remain the same, but the anomaly values changed with the baseline reference shift.

Presently sea surface temperatures (SST) are the best available indicator of heat content gained or lost from earthโ€™s climate system.  Enthalpy is the thermodynamic term for total heat content in a system, and humidity differences in air parcels affect enthalpy.  Measuring water temperature directly avoids distorted impressions from air measurements.  In addition, ocean covers 71% of the planet surface and thus dominates surface temperature estimates.  Eventually we will likely have reliable means of recording water temperatures at depth.

Recently, Dr. Ole Humlum reported from his research that air temperatures lag 2-3 months behind changes in SST.  Thus cooling oceans portend cooling land air temperatures to follow.  He also observed that changes in CO2 atmospheric concentrations lag behind SST by 11-12 months.  This latter point is addressed in a previous post Who to Blame for Rising CO2?

After a change in priorities, updates are now exclusive to HadSST4.  For comparison we can also look at lower troposphere temperatures (TLT) from UAHv6.1 which are now posted for January 2025.  The temperature record is derived from microwave sounding units (MSU) on board satellites like the one pictured above. Recently there was a change in UAH processing of satellite drift corrections, including dropping one platform which can no longer be corrected. The graphs below are taken from the revised and current dataset.

The UAH dataset includes temperature results for air above the oceans, and thus should be most comparable to the SSTs. There is the additional feature that ocean air temps avoid Urban Heat Islands (UHI).  The graph below shows monthly anomalies for ocean air temps since January 2015.

In 2021-22, SH and NH showed spikes up and down while the Tropics cooled dramatically, with some ups and downs, but hitting a new low in January 2023. At that point all regions were more or less in negative territory. 

After sharp cooling everywhere in January 2023, there was a remarkable spiking of Tropical ocean temps from -0.5C up to + 1.2C in January 2024.ย  The rise was matched by other regions in 2024, such that the Global anomaly peaked at 0.95C in May. Since then, all regions have cooled down sharply, Global anomaly dropping in January to 0.3C, as well as SH dropping down to 0.1C in January.

Land Air Temperatures Tracking in Seesaw Pattern

We sometimes overlook that in climate temperature records, while the oceans are measured directly with SSTs, land temps are measured only indirectly.  The land temperature records at surface stations sample air temps at 2 meters above ground.  UAH gives tlt anomalies for air over land separately from ocean air temps.  The graph updated for January is below.

Here we have fresh evidence of the greater volatility of the Land temperatures, along with extraordinary departures by SH land.  The seesaw pattern in Land temps is similar to ocean temps 2021-22, except that SH is the outlier, hitting bottom in January 2023. Then exceptionally SH goes from -0.6C up to 1.4C in September 2023 and 1.8C in  August 2024, with a large drop in between.  In November, SH and the Tropics pulled the Global Land anomaly further down despite a bump in NH land temps. December showed an upward rebound in SH and Tropics land temps, now offset by a dropping temps everywhere, pulling the Global land anomaly downward slightly.

The Bigger Picture UAH Global Since 1980

The chart shows monthly Global Land and Ocean anomalies starting 01/1980 to present.  The average monthly anomaly is -0.03, for this period of more than four decades.  The graph shows the 1998 El Nino after which the mean resumed, and again after the smaller 2010 event. The 2016 El Nino matched 1998 peak and in addition NH after effects lasted longer, followed by the NH warming 2019-20.   An upward bump in 2021 was reversed with temps having returned close to the mean as of 2/2022.  March and April brought warmer Global temps, later reversed

With the sharp drops in Nov., Dec. and January 2023 temps, there was no increase over 1980. Then in 2023 the buildup to the October/November peak exceeded the sharp April peak of the El Nino 1998 event. It also surpassed the February peak in 2016. In 2024 March and April took the Global anomaly to a new peak of 0.94C.  The cool down started with May dropping to 0.9C, and in June a further decline to 0.8C.  October went down to 0.7C,  November and December dropped to 0.6C. January down to 0.46C.

The graph reminds of another chart showing the abrupt ejection of humid air from Hunga Tonga eruption.

TLTs include mixing above the oceans and probably some influence from nearby more volatile land temps.ย  Clearly NH and Global land temps have been dropping in a seesaw pattern, nearly 1C lower than the 2016 peak.ย  Since the ocean has 1000 times the heat capacity as the atmosphere, that cooling is a significant driving force.ย  TLT measures started the recent cooling later than SSTs from HadSST4, but are now showing the same pattern. Despite the three El Ninos, their warming had not persisted prior to 2023, and without them it would probably have cooled since 1995.ย  Of course, the future has not yet been written.

Ocean Remains Cooler Novemberย 2024

Note that in 2015-2016 the Tropics and SH peaked in between two summer NH spikes.ย  That pattern repeated in 2019-2020 with a lesser Tropics peak and SH bump, but with higher NH spikes. By end of 2020, cooler SSTs in all regions took the Global anomaly well below the mean for this period.ย  A small warming was driven by NH summer peaks in 2021-22, but offset by cooling in SH and the tropics, By January 2023 the global anomaly was again below the mean.

From Science Matters

Byย Ron Clutz

The best context for understanding decadal temperature changes comes from the worldโ€™s sea surface temperatures (SST), for several reasons:

  • The ocean covers 71% of the globe and drives average temperatures.
  • SSTs have a constant water content, (unlike air temperatures), so give a better reading of heat content variations.
  • Major El Ninos have been the dominant climate feature in recent years.

HadSST is generally regarded as the best of the global SST data sets, and so the temperature story here comes from that source. Previously I used HadSST3 for these reports, but Hadley Centre has made HadSST4 the priority, and v.3 will no longer be updated.  HadSST4 is the same as v.3, except that the older data from ship water intake was re-estimated to be generally lower temperatures than shown in v.3.  The effect is that v.4 has lower average anomalies for the baseline period 1961-1990, thereby showing higher current anomalies than v.3. This analysis concerns more recent time periods and depends on very similar differentials as those from v.3 despite higher absolute anomaly values in v.4.  More on what distinguishes HadSST3 and 4 from other SST products at the end. The user guide for HadSST4 is here.

The Current Context

The chart below shows SST monthly anomalies as reported in HadSST4 starting in 2015 through November 2024.ย  A global cooling pattern is seen clearly in the Tropics since its peak in 2016, joined by NH and SH cycling downward since 2016, followed by rising temperatures in 2023 and 2024.

Note that in 2015-2016 the Tropics and SH peaked in between two summer NH spikes.  That pattern repeated in 2019-2020 with a lesser Tropics peak and SH bump, but with higher NH spikes. By end of 2020, cooler SSTs in all regions took the Global anomaly well below the mean for this period.  A small warming was driven by NH summer peaks in 2021-22, but offset by cooling in SH and the tropics, By January 2023 the global anomaly was again below the mean.

Now in 2023-24 came an event resembling 2015-16 with a Tropical spike and two NH spikes alongside, all higher than 2015-16. There was also a coinciding rise in SH, and the Global anomaly was pulled up to 1.1ยฐC last year, ~0.3ยฐ higher than the 2015 peak.  Then NH started down autumn 2023, followed by Tropics and SH descending 2024 to the present. After 10 months of cooling in SH and the Tropics, the Global anomaly was back down, led by NH cooling the last 3 months from its peak in August.

Comment:

The climatists have seized on this unusual warming as proof their Zero Carbon agenda is needed, without addressing how impossible it would be for CO2 warming the air to raise ocean temperatures.  It is the ocean that warms the air, not the other way around.  Recently Steven Koonin had this to say about the phonomenon confirmed in the graph above:

El Nino is a phenomenon in the climate system that happens once every four or five years.  Heat builds up in the equatorial Pacific to the west of Indonesia and so on.  Then when enough of it builds up it surges across the Pacific and changes the currents and the winds.  As it surges toward South America it was discovered and named in the 19th century  It iswell understood at this point that the phenomenon has nothing to do with CO2.

Now people talk about changes in that phenomena as a result of CO2 but itโ€™s there in the climate system already and when it happens it influences weather all over the world.   We feel it when it gets rainier in Southern California for example.  So for the last 3 years we have been in the opposite of an El Nino, a La Nina, part of the reason people think the West Coast has been in drought.

It has now shifted in the last months to an El Nino condition that warms the globe and is thought to contribute to this Spike we have seen. But there are other contributions as well.  One of the most surprising ones is that back in January of 2022 an enormous underwater volcano went off in Tonga and it put up a lot of water vapor into the upper atmosphere. It increased the upper atmosphere of water vapor by about 10 percent, and thatโ€™s a warming effect, and it may be that is contributing to why the spike is so high.

A longer view of SSTs

Open image in new tab to enlarge.

The graph above is noisy, but the density is needed to see the seasonal patterns in the oceanic fluctuations.  Previous posts focused on the rise and fall of the last El Nino starting in 2015.  This post adds a longer view, encompassing the significant 1998 El Nino and since.  The color schemes are retained for Global, Tropics, NH and SH anomalies.  Despite the longer time frame, I have kept the monthly data (rather than yearly averages) because of interesting shifts between January and July. 1995 is a reasonable (ENSO neutral) starting point prior to the first El Nino. 

The sharp Tropical rise peaking in 1998 is dominant in the record, starting Jan. โ€™97 to pull up SSTs uniformly before returning to the same level Jan. โ€™99. There were strong cool periods before and after the 1998 El Nino event. Then SSTs in all regions returned to the mean in 2001-2. 

SSTS fluctuate around the mean until 2007, when another, smaller ENSO event occurs. There is cooling 2007-8,  a lower peak warming in 2009-10, following by cooling in 2011-12.  Again SSTs are average 2013-14.

Now a different pattern appears.  The Tropics cooled sharply to Jan 11, then rise steadily for 4 years to Jan 15, at which point the most recent major El Nino takes off.  But this time in contrast to โ€™97-โ€™99, the Northern Hemisphere produces peaks every summer pulling up the Global average.  In fact, these NH peaks appear every July starting in 2003, growing stronger to produce 3 massive highs in 2014, 15 and 16.  NH July 2017 was only slightly lower, and a fifth NH peak still lower in Sept. 2018.

The highest summer NH peaks came in 2019 and 2020, only this time the Tropics and SH were offsetting rather adding to the warming. (Note: these are high anomalies on top of the highest absolute temps in the NH.)  Since 2014 SH has played a moderating role, offsetting the NH warming pulses. After September 2020 temps dropped off down until February 2021.  In 2021-22 there were again summer NH spikes, but in 2022 moderated first by cooling Tropics and SH SSTs, then in October to January 2023 by deeper cooling in NH and Tropics.  

Then in 2023 the Tropics flipped from below to well above average, while NH produced a summer peak extending into September higher than any previous year.  Despite El Nino driving the Tropics January 2024 anomaly higher than 1998 and 2016 peaks, following months cooled in all regions, and the Tropics continued cooling in April, May and June along with SH dropping.  After July and August NH warming again pulled the global anomaly higher, September and October resumed cooling in all regions.

What to make of all this? The patterns suggest that in addition to El Ninos in the Pacific driving the Tropic SSTs, something else is going on in the NH.  The obvious culprit is the North Atlantic, since I have seen this sort of pulsing before.  After reading some papers by David Dilley, I confirmed his observation of Atlantic pulses into the Arctic every 8 to 10 years.

Contemporary AMO Observations

Through January 2023 I depended on the Kaplan AMO Index (not smoothed, not detrended) for N. Atlantic observations. But it is no longer being updated, and NOAA says they donโ€™t know its future.  So I find that ERSSTv5 AMO dataset has current data.  It differs from Kaplan, which reported average absolute temps measured in N. Atlantic.  โ€œERSST5 AMO  follows Trenberth and Shea (2006) proposal to use the NA region EQ-60ยฐN, 0ยฐ-80ยฐW and subtract the global rise of SST 60ยฐS-60ยฐN to obtain a measure of the internal variability, arguing that the effect of external forcing on the North Atlantic should be similar to the effect on the other oceans.โ€  So the values represent sst anomaly differences between the N. Atlantic and the Global ocean.

The chart above confirms what Kaplan also showed.ย  As August is the hottest month for the N. Atlantic, its variability, high and low, drives the annual results for this basin.ย  Note also the peaks in 2010, lows after 2014, and a rise in 2021. Then in 2023 the peak was holding at 1.4C before declining.ย  An annual chart below is informative:

Note the difference between blue/green years, beige/brown, and purple/red years.  2010, 2021, 2022 all peaked strongly in August or September.  1998 and 2007 were mildly warm.  2016 and 2018 were matching or cooler than the global average.  2023 started out slightly warm, then rose steadily to an  extraordinary peak in July.  August to October were only slightly lower, but by December cooled by ~0.4C.

Then in 2024 the AMO anomaly started higher than any previous year, then leveled off for two months declining slightly into April.  Remarkably, May showed an upward leap putting this on a higher track than 2023, and rising slightly higher in June.  In July, August and September 2024 the anomaly declined, and despite a small rise in October, is now lower than the peak reached in 2023.

The pattern suggests the ocean may be demonstrating a stairstep pattern like that we have also seen in HadCRUT4.ย 

The purple line is the average anomaly 1980-1996 inclusive, value 0.18.  The orange line the average 1980-202404, value 0.39, also for the period 1997-2012. The red line is 2013-202409, value 0.69. As noted above, these rising stages are driven by the combined warming in the Tropics and NH, including both Pacific and Atlantic basins.

See Also:

Curiosity:  Solar Coincidence?

The news about our current solar cycle 25 is that the solar activity is hitting peak numbers now and higher than expected 1-2 years in the future.ย  As livescience put it:ย ย Solar maximum could hit us harder and sooner than we thought. How dangerous will the sunโ€™s chaotic peak be?ย ย Some charts fromย spaceweatherliveย look familar to these sea surface temperature charts.

Summary

The oceans are driving the warming this century.  SSTs took a step up with the 1998 El Nino and have stayed there with help from the North Atlantic, and more recently the Pacific northern โ€œBlob.โ€  The ocean surfaces are releasing a lot of energy, warming the air, but eventually will have a cooling effect.  The decline after 1937 was rapid by comparison, so one wonders: How long can the oceans keep this up? And is the sun adding forcing to this process?

Space weather impacts the ionosphere in this animation. Credits: NASA/GSFC/CIL/Krystofer Kim

Footnote: Why Rely on HadSST4

HadSST is distinguished from other SST products because HadCRU (Hadley Climatic Research Unit) does not engage in SST interpolation, i.e. infilling estimated anomalies into grid cells lacking sufficient sampling in a given month. From reading the documentation and from queries to Met Office, this is their procedure.

HadSST4 imports data from gridcells containing ocean, excluding land cells. From past records, they have calculated daily and monthly average readings for each grid cell for the period 1961 to 1990. Those temperatures form the baseline from which anomalies are calculated.

In a given month, each gridcell with sufficient sampling is averaged for the month and then the baseline value for that cell and that month is subtracted, resulting in the monthly anomaly for that cell. All cells with monthly anomalies are averaged to produce global, hemispheric and tropical anomalies for the month, based on the cells in those locations. For example, Tropics averages include ocean grid cells lying between latitudes 20N and 20S.

Gridcells lacking sufficient sampling that month are left out of the averaging, and the uncertainty from such missing data is estimated. IMO that is more reasonable than inventing data to infill. And it seems that the Global Drifter Array displayed in the top image is providing more uniform coverage of the oceans than in the past.

USS Pearl Harbor deploys Global Drifter Buoys in Pacific Ocean

Ocean Temperatures and Climate Hysteria: A Lesson in Perspective

For the past two years, headlines, policy statements, and social media feeds have been flooded with dire warnings about rising ocean temperatures. Every uptick in the graphs was treated as irrefutable proof of humanityโ€™s march toward ecological collapse. The news cycle offered little room for nuance, and as usual, the loudest voices declared the end was nigh. But a recent tweet from Javier Viรฑos, supported by a graph of global sea surface temperatures (SST), reminds us how quickly climate โ€œemergenciesโ€ dissolve when confronted with even the faintest hint of natural variability.

From Watts Up With That?

By Charles Rotter

For the past two years, headlines, policy statements, and social media feeds have been flooded with dire warnings about rising ocean temperatures. Every uptick in the graphs was treated as irrefutable proof of humanityโ€™s march toward ecological collapse. The news cycle offered little room for nuance, and as usual, the loudest voices declared the end was nigh. But a recent tweet from Javier Viรฑos, supported by a graph of global sea surface temperatures (SST), reminds us how quickly climate โ€œemergenciesโ€ dissolve when confronted with even the faintest hint of natural variability.

https://x.com/JVinos_Climate/status/1869655299923337341

Viรฑosโ€™s tweet is remarkable in its simplicity and restraint. For the first time in 21 months, global ocean temperatures have returned to levels seen in December 2015โ€”nine years ago. Let that sink in for a moment. After two years of being bombarded with claims that the Earthโ€™s oceans were on an unstoppable trajectory of warming, we find ourselvesโ€ฆ back where we were nearly a decade ago. The graph he shared makes this clear, showing the average SST dipping out of the โ€œanomalousโ€ zone, contradicting two yearsโ€™ worth of sensational headlines.

What the Data Shows

The chart, which aggregates SST data from NOAA and the University of Maineโ€™s Climate Change Institute, plots daily SST readings from 60ยฐS to 60ยฐN, covering a broad swath of the Earthโ€™s oceans. The most striking feature is the orange 2023 line that shows pronounced warmthโ€”well above the 1991โ€“2020 baseline averageโ€”before gradually declining. The 2024 data (dark red) follow suit, steadily falling back to levels not seen since 2015.

Viรฑos describes this trend as part of โ€œpoorly understood natural climate variability,โ€ a phrase that should be plastered across every climate model and policymakerโ€™s desk. The graph itself illustrates this beautifully: the chaotic, squiggling lines of each year reveal the natural ups and downs of ocean temperatures, starkly contrasting the prevailing narrative that climate change operates on a simple linear trajectory of doom.

The Last Two Years of Hyperbole

In 2023, the narrative around ocean temperatures reached fever pitch. Every spike in temperature was portrayed as an existential crisis. Headlines screamed about unprecedented oceanic heatwaves, ecosystems pushed to the brink, and melting polar ice accelerating sea-level rise. Phrases like โ€œoff the chartsโ€ and โ€œnew normalโ€ were thrown around with reckless abandon.

Yet here we are, with the average SST plummeting back to levels seen nearly a decade ago. What does this tell us? That ocean temperatures fluctuate. That long-term trends are more complicated than the alarmists would have you believe. And perhaps most importantly, that the overconfidence in computer models and the myopic focus on short-term anomalies is profoundly misplaced.

Misunderstanding Natural Variability

Viรฑosโ€™s choice of wordsโ€”โ€œpoorly understood natural climate variabilityโ€โ€”cuts to the heart of the issue. Despite decades of research and countless billions of dollars spent, the science of climate variability remains riddled with uncertainties. Climate models struggle to replicate observed phenomena like the Pacific Decadal Oscillation (PDO), Atlantic Multidecadal Oscillation (AMO), and El Niรฑo-Southern Oscillation (ENSO).

Take 2023โ€™s anomalous warmth, for example. It coincided with a strong El Niรฑo event, which naturally warms surface waters in the Pacific and influences global weather patterns. While the media pounced on this as evidence of human-caused warming, a significant portion of it was likely due to this entirely natural phenomenon.

Moreover, the complexities of ocean-atmosphere interactions, deep-sea currents, and solar variability are still poorly understood. As a result, the idea that we can attribute every blip on the graph to anthropogenic CO2 emissions is not just simplisticโ€”itโ€™s scientifically irresponsible.

The Danger of Overreaction

The problem with climate hyperbole is not just that itโ€™s wrong, but that it leads to bad policy. Over the past two years, nations have doubled down on costly decarbonization efforts, citing โ€œunprecedentedโ€ ocean temperatures as justification. Policies like Net Zero, which aim to eliminate fossil fuel use entirely, have disrupted energy markets, driven inflation, and plunged millions into energy povertyโ€”all in the name of โ€œsaving the planet.โ€

But what if this episode of warming was primarily natural in origin? What if the 2023 temperature spike was just another bump in the chaotic rhythm of natural variability? The billions spent on โ€œfixingโ€ the climate would then amount to a colossal waste, solving a problem that doesnโ€™t exist or was never fully understood in the first place.

Lessons for the Future

Viรฑosโ€™s tweet and the accompanying data highlight the need for humility in climate science and policymaking. The complex interplay of factors that influence ocean temperatures defies simplistic explanations and linear trends. Instead of rushing to declare every fluctuation a crisis, we should acknowledge the vast uncertainties that still exist and adopt a more measured approach to both science and policy.

Policymakers would do well to remember the following:

  1. Natural variability is not a bug; itโ€™s a featureย of the Earthโ€™s climate system.
  2. Short-term trends do not equal long-term trajectories.ย Two years of anomalous temperatures do not prove climate catastrophe, just as this return to 2015 levels doesnโ€™t disprove it.
  3. Correlation is not causation.ย Just because temperatures are higher doesnโ€™t mean human activity is the soleโ€”or even primaryโ€”cause.
  4. Precautionary policies are not free.ย When governments pursue drastic measures like Net Zero without understanding the full picture, the economic and social consequences can be severe.

Conclusion

The graph shared by Javier Viรฑos should serve as a wake-up call for anyone whoโ€™s been swept up in the climate hysteria of the past two years. While itโ€™s tempting to view every uptick in temperature as evidence of impending doom, the reality is far more nuanced. Ocean temperatures are now back to levels seen in 2015, a stark reminder of the chaotic, unpredictable nature of the climate system.

In the end, the greatest threat to rational policy isnโ€™t rising temperaturesโ€”itโ€™s the unrelenting tide of hyperbole that drowns out careful analysis and critical thinking. If we truly want to address environment challenges, we must first learn to distinguish between signal and noise. And as this latest data shows, thereโ€™s a lot more noise out there than weโ€™ve been led to believe.

Ocean Cools Further Octoberย 2024

The climatists have seized on this unusual warming as proof their Zero Carbon agenda is needed, without addressing how impossible it would be for CO2 warming the air to raise ocean temperatures.ย  It is the ocean that warms the air, not the other way around.

From Science Matters

Byย Ron Clutz

The best context for understanding decadal temperature changes comes from the worldโ€™s sea surface temperatures (SST), for several reasons:

  • The ocean covers 71% of the globe and drives average temperatures;
  • SSTs have a constant water content, (unlike air temperatures), so give a better reading of heat content variations;
  • Major El Ninos have been the dominant climate feature in recent years.

HadSST is generally regarded as the best of the global SST data sets, and so the temperature story here comes from that source. Previously I used HadSST3 for these reports, but Hadley Centre has made HadSST4 the priority, and v.3 will no longer be updated.  HadSST4 is the same as v.3, except that the older data from ship water intake was re-estimated to be generally lower temperatures than shown in v.3.  The effect is that v.4 has lower average anomalies for the baseline period 1961-1990, thereby showing higher current anomalies than v.3. This analysis concerns more recent time periods and depends on very similar differentials as those from v.3 despite higher absolute anomaly values in v.4.  More on what distinguishes HadSST3 and 4 from other SST products at the end. The user guide for HadSST4 is here.

The Current Context

The chart below shows SST monthly anomalies as reported in HadSST4 starting in 2015 through October 2024.  A global cooling pattern is seen clearly in the Tropics since its peak in 2016, joined by NH and SH cycling downward since 2016, followed by rising temperatures in 2023 and 2024.

Note that in 2015-2016 the Tropics and SH peaked in between two summer NH spikes.  That pattern repeated in 2019-2020 with a lesser Tropics peak and SH bump, but with higher NH spikes. By end of 2020, cooler SSTs in all regions took the Global anomaly well below the mean for this period.  A small warming was driven by NH summer peaks in 2021-22, but offset by cooling in SH and the tropics, By January 2023 the global anomaly was again below the mean.

Now in 2023-24 came an event resembling 2015-16 with a Tropical spike and two NH spikes alongside, all higher than 2015-16. There was also a coinciding rise in SH, and the Global anomaly was pulled up to 1.1ยฐC last year, ~0.3ยฐ higher than the 2015 peak.  Then NH started down autumn 2023, followed by Tropics and SH descending 2024 to the present. After 10 months of cooling in SH and the Tropics, the Global anomaly is back down, after a small bump from NH summer warming.

Comment:

The climatists have seized on this unusual warming as proof their Zero Carbon agenda is needed, without addressing how impossible it would be for CO2 warming the air to raise ocean temperatures.  It is the ocean that warms the air, not the other way around.  Recently Steven Koonin had this to say about the phonomenon confirmed in the graph above:

El Nino is a phenomenon in the climate system that happens once every four or five years.  Heat builds up in the equatorial Pacific to the west of Indonesia and so on.  Then when enough of it builds up it surges across the Pacific and changes the currents and the winds.  As it surges toward South America it was discovered and named in the 19th century  It iswell understood at this point that the phenomenon has nothing to do with CO2.

Now people talk about changes in that phenomena as a result of CO2 but itโ€™s there in the climate system already and when it happens it influences weather all over the world.   We feel it when it gets rainier in Southern California for example.  So for the last 3 years we have been in the opposite of an El Nino, a La Nina, part of the reason people think the West Coast has been in drought.

It has now shifted in the last months to an El Nino condition that warms the globe and is thought to contribute to this Spike we have seen. But there are other contributions as well.  One of the most surprising ones is that back in January of 2022 an enormous underwater volcano went off in Tonga and it put up a lot of water vapor into the upper atmosphere. It increased the upper atmosphere of water vapor by about 10 percent, and thatโ€™s a warming effect, and it may be that is contributing to why the spike is so high.

A longer view of SSTs

Open image in new tab to enlarge.

The graph above is noisy, but the density is needed to see the seasonal patterns in the oceanic fluctuations.  Previous posts focused on the rise and fall of the last El Nino starting in 2015.  This post adds a longer view, encompassing the significant 1998 El Nino and since.  The color schemes are retained for Global, Tropics, NH and SH anomalies.  Despite the longer time frame, I have kept the monthly data (rather than yearly averages) because of interesting shifts between January and July. 1995 is a reasonable (ENSO neutral) starting point prior to the first El Nino. 

The sharp Tropical rise peaking in 1998 is dominant in the record, starting Jan. โ€™97 to pull up SSTs uniformly before returning to the same level Jan. โ€™99. There were strong cool periods before and after the 1998 El Nino event. Then SSTs in all regions returned to the mean in 2001-2. 

SSTS fluctuate around the mean until 2007, when another, smaller ENSO event occurs. There is cooling 2007-8,  a lower peak warming in 2009-10, following by cooling in 2011-12.  Again SSTs are average 2013-14.

Now a different pattern appears.  The Tropics cooled sharply to Jan 11, then rise steadily for 4 years to Jan 15, at which point the most recent major El Nino takes off.  But this time in contrast to โ€™97-โ€™99, the Northern Hemisphere produces peaks every summer pulling up the Global average.  In fact, these NH peaks appear every July starting in 2003, growing stronger to produce 3 massive highs in 2014, 15 and 16.  NH July 2017 was only slightly lower, and a fifth NH peak still lower in Sept. 2018.

The highest summer NH peaks came in 2019 and 2020, only this time the Tropics and SH were offsetting rather adding to the warming. (Note: these are high anomalies on top of the highest absolute temps in the NH.)  Since 2014 SH has played a moderating role, offsetting the NH warming pulses. After September 2020 temps dropped off down until February 2021.  In 2021-22 there were again summer NH spikes, but in 2022 moderated first by cooling Tropics and SH SSTs, then in October to January 2023 by deeper cooling in NH and Tropics.  

Then in 2023 the Tropics flipped from below to well above average, while NH produced a summer peak extending into September higher than any previous year.  Despite El Nino driving the Tropics January 2024 anomaly higher than 1998 and 2016 peaks, following months cooled in all regions, and the Tropics continued cooling in April, May and June along with SH dropping.  After July and August NH warming again pulled the global anomaly higher, September resumed cooling in all regions.

What to make of all this? The patterns suggest that in addition to El Ninos in the Pacific driving the Tropic SSTs, something else is going on in the NH.  The obvious culprit is the North Atlantic, since I have seen this sort of pulsing before.  After reading some papers by David Dilley, I confirmed his observation of Atlantic pulses into the Arctic every 8 to 10 years.

Contemporary AMO Observations

Through January 2023 I depended on the Kaplan AMO Index (not smoothed, not detrended) for N. Atlantic observations. But it is no longer being updated, and NOAA says they donโ€™t know its future.  So I find that ERSSTv5 AMO dataset has current data.  It differs from Kaplan, which reported average absolute temps measured in N. Atlantic.  โ€œERSST5 AMO  follows Trenberth and Shea (2006) proposal to use the NA region EQ-60ยฐN, 0ยฐ-80ยฐW and subtract the global rise of SST 60ยฐS-60ยฐN to obtain a measure of the internal variability, arguing that the effect of external forcing on the North Atlantic should be similar to the effect on the other oceans.โ€  So the values represent sst anomaly differences between the N. Atlantic and the Global ocean.

The chart above confirms what Kaplan also showed.ย  As August is the hottest month for the N. Atlantic, its variability, high and low, drives the annual results for this basin.ย  Note also the peaks in 2010, lows after 2014, and a rise in 2021. Then in 2023 the peak was holding at 1.4C before declining.ย  An annual chart below is informative:

Note the difference between blue/green years, beige/brown, and purple/red years.  2010, 2021, 2022 all peaked strongly in August or September.  1998 and 2007 were mildly warm.  2016 and 2018 were matching or cooler than the global average.  2023 started out slightly warm, then rose steadily to an  extraordinary peak in July.  August to October were only slightly lower, but by December cooled by ~0.4C.

Then in 2024 the AMO anomaly started higher than any previous year, then leveled off for two months declining slightly into April.  Remarkably, May showed an upward leap putting this on a higher track than 2023, and rising slightly higher in June.  In July, August and September 2024 the anomaly declined, and despite a small rise in October, is now lower than the peak reached in 2023.

The pattern suggests the ocean may be demonstrating a stairstep pattern like that we have also seen in HadCRUT4. 

The purple line is the average anomaly 1980-1996 inclusive, value 0.18.  The orange line the average 1980-202404, value 0.39, also for the period 1997-2012. The red line is 2013-202409, value 0.69. As noted above, these rising stages are driven by the combined warming in the Tropics and NH, including both Pacific and Atlantic basins.

See Also:
Curiosity:  Solar Coincidence?

The news about our current solar cycle 25 is that the solar activity is hitting peak numbers now and higher  than expected 1-2 years in the future.  As livescience put it:  Solar maximum could hit us harder and sooner than we thought. How dangerous will the sunโ€™s chaotic peak be?  Some charts from spaceweatherlive look familar to these sea surface temperature charts.

Summary

The oceans are driving the warming this century.  SSTs took a step up with the 1998 El Nino and have stayed there with help from the North Atlantic, and more recently the Pacific northern โ€œBlob.โ€  The ocean surfaces are releasing a lot of energy, warming the air, but eventually will have a cooling effect.  The decline after 1937 was rapid by comparison, so one wonders: How long can the oceans keep this up? And is the sun adding forcing to this process?

Space weather impacts the ionosphere in this animation. Credits: NASA/GSFC/CIL/Krystofer Kim

Footnote: Why Rely on HadSST4

HadSST is distinguished from other SST products because HadCRU (Hadley Climatic Research Unit) does not engage in SST interpolation, i.e. infilling estimated anomalies into grid cells lacking sufficient sampling in a given month. From reading the documentation and from queries to Met Office, this is their procedure.

HadSST4 imports data from gridcells containing ocean, excluding land cells. From past records, they have calculated daily and monthly average readings for each grid cell for the period 1961 to 1990. Those temperatures form the baseline from which anomalies are calculated.

In a given month, each gridcell with sufficient sampling is averaged for the month and then the baseline value for that cell and that month is subtracted, resulting in the monthly anomaly for that cell. All cells with monthly anomalies are averaged to produce global, hemispheric and tropical anomalies for the month, based on the cells in those locations. For example, Tropics averages include ocean grid cells lying between latitudes 20N and 20S.

Gridcells lacking sufficient sampling that month are left out of the averaging, and the uncertainty from such missing data is estimated. IMO that is more reasonable than inventing data to infill. And it seems that the Global Drifter Array displayed in the top image is providing more uniform coverage of the oceans than in the past.

USS Pearl Harbor deploys Global Drifter Buoys in Pacific Ocean

Ocean Cooling Resumes Septemberย 2024

The best context for understanding decadal temperature changes comes from the worldโ€™s sea surface temperatures (SST), for several reasons:

The ocean covers 71% of the globe and drives average temperatures;
SSTs have a constant water content, (unlike air temperatures), so give a better reading of heat content variations;
Major El Ninos have been the dominant climate feature in recent years.

From Science Matters

Byย Ron Clutz

The best context for understanding decadal temperature changes comes from the worldโ€™s sea surface temperatures (SST), for several reasons:

  • The ocean covers 71% of the globe and drives average temperatures;
  • SSTs have a constant water content, (unlike air temperatures), so give a better reading of heat content variations;
  • Major El Ninos have been the dominant climate feature in recent years.

HadSST is generally regarded as the best of the global SST data sets, and so the temperature story here comes from that source. Previously I used HadSST3 for these reports, but Hadley Centre has made HadSST4 the priority, and v.3 will no longer be updated.  HadSST4 is the same as v.3, except that the older data from ship water intake was re-estimated to be generally lower temperatures than shown in v.3.  The effect is that v.4 has lower average anomalies for the baseline period 1961-1990, thereby showing higher current anomalies than v.3. This analysis concerns more recent time periods and depends on very similar differentials as those from v.3 despite higher absolute anomaly values in v.4.  More on what distinguishes HadSST3 and 4 from other SST products at the end. The user guide for HadSST4 is here.

The Current Context

The chart below shows SST monthly anomalies as reported in HadSST4 starting in 2015 through September 2024.  A global cooling pattern is seen clearly in the Tropics since its peak in 2016, joined by NH and SH cycling downward since 2016, followed by rising temperatures in 2023 and 2024.

Note that in 2015-2016 the Tropics and SH peaked in between two summer NH spikes.  That pattern repeated in 2019-2020 with a lesser Tropics peak and SH bump, but with higher NH spikes. By end of 2020, cooler SSTs in all regions took the Global anomaly well below the mean for this period.  A small warming was driven by NH summer peaks in 2021-22, but offset by cooling in SH and the tropics, By January 2023 the global anomaly was again below the mean.

Now in 2023-24 comes an event resembling 2015-16 with a Tropical spike and two NH spikes alongside. There was also a coinciding rise in SH, and the Global anomaly was pulled up to 1.1ยฐC last year, ~0.3ยฐC higher than the 2015 peak. After several months of cooling in SH and the Tropics, now NH and the Global anomaly resume starting down.

Comment:

The climatists have seized on this unusual warming as proof their Zero Carbon agenda is needed, without addressing how impossible it would be for CO2 warming the air to raise ocean temperatures.  It is the ocean that warms the air, not the other way around.  Recently Steven Koonin had this to say about the phonomenon confirmed in the graph above:

El Nino is a phenomenon in the climate system that happens once every four or five years.  Heat builds up in the equatorial Pacific to the west of Indonesia and so on.  Then when enough of it builds up it surges across the Pacific and changes the currents and the winds.  As it surges toward South America it was discovered and named in the 19th century  It iswell understood at this point that the phenomenon has nothing to do with CO2.

Now people talk about changes in that phenomena as a result of CO2 but itโ€™s there in the climate system already and when it happens it influences weather all over the world.   We feel it when it gets rainier in Southern California for example.  So for the last 3 years we have been in the opposite of an El Nino, a La Nina, part of the reason people think the West Coast has been in drought.

It has now shifted in the last months to an El Nino condition that warms the globe and is thought to contribute to this Spike we have seen. But there are other contributions as well.ย  One of the most surprising ones is that back in January of 2022 an enormous underwater volcano went off in Tonga and it put up a lot of water vapor into the upper atmosphere. It increased the upper atmosphere of water vapor by about 10 percent, and thatโ€™s a warming effect, and it may be that is contributing to why the spike is so high.

A longer view of SSTs

The graph above is noisy, but the density is needed to see the seasonal patterns in the oceanic fluctuations.  Previous posts focused on the rise and fall of the last El Nino starting in 2015.  This post adds a longer view, encompassing the significant 1998 El Nino and since.  The color schemes are retained for Global, Tropics, NH and SH anomalies.  Despite the longer time frame, I have kept the monthly data (rather than yearly averages) because of interesting shifts between January and July. 1995 is a reasonable (ENSO neutral) starting point prior to the first El Nino. 

The sharp Tropical rise peaking in 1998 is dominant in the record, starting Jan. โ€™97 to pull up SSTs uniformly before returning to the same level Jan. โ€™99. There were strong cool periods before and after the 1998 El Nino event. Then SSTs in all regions returned to the mean in 2001-2. 

SSTS fluctuate around the mean until 2007, when another, smaller ENSO event occurs. There is cooling 2007-8,  a lower peak warming in 2009-10, following by cooling in 2011-12.  Again SSTs are average 2013-14.

Now a different pattern appears.  The Tropics cooled sharply to Jan 11, then rise steadily for 4 years to Jan 15, at which point the most recent major El Nino takes off.  But this time in contrast to โ€™97-โ€™99, the Northern Hemisphere produces peaks every summer pulling up the Global average.  In fact, these NH peaks appear every July starting in 2003, growing stronger to produce 3 massive highs in 2014, 15 and 16.  NH July 2017 was only slightly lower, and a fifth NH peak still lower in Sept. 2018.

The highest summer NH peaks came in 2019 and 2020, only this time the Tropics and SH were offsetting rather adding to the warming. (Note: these are high anomalies on top of the highest absolute temps in the NH.)  Since 2014 SH has played a moderating role, offsetting the NH warming pulses. After September 2020 temps dropped off down until February 2021.  In 2021-22 there were again summer NH spikes, but in 2022 moderated first by cooling Tropics and SH SSTs, then in October to January 2023 by deeper cooling in NH and Tropics.  

Then in 2023 the Tropics flipped from below to well above average, while NH produced a summer peak extending into September higher than any previous year.  Despite El Nino driving the Tropics January 2024 anomaly higher than 1998 and 2016 peaks, following months cooled in all regions, and the Tropics continued cooling in April, May and June along with SH dropping.  After July and August NH warming again pulled the global anomaly higher, September resumed cooling in all regions.

What to make of all this? The patterns suggest that in addition to El Ninos in the Pacific driving the Tropic SSTs, something else is going on in the NH.  The obvious culprit is the North Atlantic, since I have seen this sort of pulsing before.  After reading some papers by David Dilley, I confirmed his observation of Atlantic pulses into the Arctic every 8 to 10 years.

Contemporary AMO Observations

Through January 2023 I depended on the Kaplan AMO Index (not smoothed, not detrended) for N. Atlantic observations. But it is no longer being updated, and NOAA says they donโ€™t know its future.  So I find that ERSSTv5 AMO dataset has current data.  It differs from Kaplan, which reported average absolute temps measured in N. Atlantic.  โ€œERSST5 AMO  follows Trenberth and Shea (2006) proposal to use the NA region EQ-60ยฐN, 0ยฐ-80ยฐW and subtract the global rise of SST 60ยฐS-60ยฐN to obtain a measure of the internal variability, arguing that the effect of external forcing on the North Atlantic should be similar to the effect on the other oceans.โ€  So the values represent sst anomaly differences between the N. Atlantic and the Global ocean.

The chart above confirms what Kaplan also showed.ย  As August is the hottest month for the N. Atlantic, its variability, high and low, drives the annual results for this basin.ย  Note also the peaks in 2010, lows after 2014, and a rise in 2021. Then in 2023 the peak was holding at 1.4C before declining.ย  An annual chart below is informative:

Note the difference between blue/green years, beige/brown, and purple/red years.  2010, 2021, 2022 all peaked strongly in August or September.  1998 and 2007 were mildly warm.  2016 and 2018 were matching or cooler than the global average.  2023 started out slightly warm, then rose steadily to an  extraordinary peak in July.  August to October were only slightly lower, but by December cooled by ~0.4C.

Now in 2024 the AMO anomaly started higher than any previous year, then leveled off for two months declining slightly into April.  Remarkably, May showed an upward leap putting this on a higher track than 2023, and rising slightly higher in June.  In July, August and September 2024 the anomaly declined and is now lower than the peak reached in 2023.

The pattern suggests the ocean may be demonstrating a stairstep pattern like that we have also seen in HadCRUT4.ย 

The purple line is the average anomaly 1980-1996 inclusive, value 0.18.  The orange line the average 1980-202404, value 0.39, also for the period 1997-2012. The red line is 2013-202409, value 0.69. As noted above, these rising stages are driven by the combined warming in the Tropics and NH, including both Pacific and Atlantic basins.

See Also:

Curiosity:  Solar Coincidence?

The news about our current solar cycle 25 is that the solar activity is hitting peak numbers now and higher  than expected 1-2 years in the future.  As livescience put it:  Solar maximum could hit us harder and sooner than we thought. How dangerous will the sunโ€™s chaotic peak be?  Some charts from spaceweatherlive look familar to these sea surface temperature charts.

Summary

The oceans are driving the warming this century.  SSTs took a step up with the 1998 El Nino and have stayed there with help from the North Atlantic, and more recently the Pacific northern โ€œBlob.โ€  The ocean surfaces are releasing a lot of energy, warming the air, but eventually will have a cooling effect.  The decline after 1937 was rapid by comparison, so one wonders: How long can the oceans keep this up? And is the sun adding forcing to this process?

Space weather impacts the ionosphere in this animation. Credits: NASA/GSFC/CIL/Krystofer Kim

Footnote: Why Rely on HadSST4

HadSST is distinguished from other SST products because HadCRU (Hadley Climatic Research Unit) does not engage in SST interpolation, i.e. infilling estimated anomalies into grid cells lacking sufficient sampling in a given month. From reading the documentation and from queries to Met Office, this is their procedure.

HadSST4 imports data from gridcells containing ocean, excluding land cells. From past records, they have calculated daily and monthly average readings for each grid cell for the period 1961 to 1990. Those temperatures form the baseline from which anomalies are calculated.

In a given month, each gridcell with sufficient sampling is averaged for the month and then the baseline value for that cell and that month is subtracted, resulting in the monthly anomaly for that cell. All cells with monthly anomalies are averaged to produce global, hemispheric and tropical anomalies for the month, based on the cells in those locations. For example, Tropics averages include ocean grid cells lying between latitudes 20N and 20S.

Gridcells lacking sufficient sampling that month are left out of the averaging, and the uncertainty from such missing data is estimated. IMO that is more reasonable than inventing data to infill. And it seems that the Global Drifter Array displayed in the top image is providing more uniform coverage of the oceans than in the past.

USS Pearl Harbor deploys Global Drifter Buoys in Pacific Ocean

UAH August 2024: Most Regions Cooler, Offset by SH Landย Spike

The post below updates the UAH record of air temperatures over land and ocean. Each month and year exposes again the growing disconnect between the real world and the Zero Carbon zealots.ย  It is as though the anti-hydrocarbon band wagon hopes to drown out the data contradicting their justification for the Great Energy Transition.ย  Yes, there has been warming from an El Nino buildup coincidental with North Atlantic warming, but no basis to blame it on CO2.ย ย 

From Science Matters

Byย Ron Clutz

The post below updates the UAH record of air temperatures over land and ocean. Each month and year exposes again the growing disconnect between the real world and the Zero Carbon zealots.  It is as though the anti-hydrocarbon band wagon hopes to drown out the data contradicting their justification for the Great Energy Transition.  Yes, there has been warming from an El Nino buildup coincidental with North Atlantic warming, but no basis to blame it on CO2.  

As an overview consider how recent rapid cooling  completely overcame the warming from the last 3 El Ninos (1998, 2010 and 2016).  The UAH record shows that the effects of the last one were gone as of April 2021, again in November 2021, and in February and June 2022  At year end 2022 and continuing into 2023 global temp anomaly matched or went lower than average since 1995, an ENSO neutral year. (UAH baseline is now 1991-2020). Now we have an usual El Nino warming spike of uncertain cause, unrelated to steadily rising CO2 and now moderating.

For reference I added an overlay of CO2 annual concentrations as measured at Mauna Loa.  While temperatures fluctuated up and down ending flat, CO2 went up steadily by ~60 ppm, a 15% increase.

Furthermore, going back to previous warmings prior to the satellite record shows that the entire rise of 0.8C since 1947 is due to oceanic, not human activity.

gmt-warming-events

The animation is an update of a previous analysis from Dr. Murry Salby.  These graphs use Hadcrut4 and include the 2016 El Nino warming event.  The exhibit shows since 1947 GMT warmed by 0.8 C, from 13.9 to 14.7, as estimated by Hadcrut4.  This resulted from three natural warming events involving ocean cycles. The most recent rise 2013-16 lifted temperatures by 0.2C.  Previously the 1997-98 El Nino produced a plateau increase of 0.4C.  Before that, a rise from 1977-81 added 0.2C to start the warming since 1947.

Importantly, the theory of human-caused global warming asserts that increasing CO2 in the atmosphere changes the baseline and causes systemic warming in our climate.  On the contrary, all of the warming since 1947 was episodic, coming from three brief events associated with oceanic cycles. And now in 2024 we have seen an amazing episode with a temperature spike driven by ocean air warming in all regions, along with rising NH land temperatures, now receding from its peak.

Chris Schoeneveld has produced a similar graph to the animation above, with a temperature series combining HadCRUT4 and UAH6. H/T WUWT

See Also Worst Threat: Greenhouse Gas or Quiet Sun?

August 2024 Most Regions Cooler Offset by SH Land Spike

With apologies to Paul Revere, this post is on the lookout for cooler weather with an eye on both the Land and the Sea.  While you heard a lot about 2020-21 temperatures matching 2016 as the highest ever, that spin ignores how fast the cooling set in.  The UAH data analyzed below shows that warming from the last El Nino had fully dissipated with chilly temperatures in all regions. After a warming blip in 2022, land and ocean temps dropped again with 2023 starting below the mean since 1995.  Spring and Summer 2023 saw a series of warmings, continuing into October, followed by cooling. 

UAH has updated their tlt (temperatures in lower troposphere) dataset for August 2024. Posts on their reading of ocean air temps this month are ahead of the update from HadSST4.  I posted last month on SSTs using HadSST4 Oceans Warming Uptick July 2024. These posts have a separate graph of land air temps because the comparisons and contrasts are interesting as we contemplate possible cooling in coming months and years.

Sometimes air temps over land diverge from ocean air changes. Last February 2024, both ocean and land air temps went higher driven by SH, while NH and the Tropics cooled slightly, resulting in Global anomaly matching October 2023 peak. Then in March Ocean anomalies cooled while Land anomalies rose everywhere. After a mixed pattern in April, the May anomalies were back down led by a large drop in NH land, and a smaller ocean decline in all regions. In June all Ocean regions dropped down, as well as dips in SH and Tropical land temps. In July all Oceans were unchanged except for Tropical warming, while all land regions rose slightly. Now in August we see a warming leap in SH land, slight Land cooling elsewhere, a dip in Tropical Ocean temp and slightly elswhere. End result is a small upward bump.

Note:  UAH has shifted their baseline from 1981-2010 to 1991-2020 beginning with January 2021.  In the charts below, the trends and fluctuations remain the same but the anomaly values changed with the baseline reference shift.

Presently sea surface temperatures (SST) are the best available indicator of heat content gained or lost from earthโ€™s climate system.  Enthalpy is the thermodynamic term for total heat content in a system, and humidity differences in air parcels affect enthalpy.  Measuring water temperature directly avoids distorted impressions from air measurements.  In addition, ocean covers 71% of the planet surface and thus dominates surface temperature estimates.  Eventually we will likely have reliable means of recording water temperatures at depth.

Recently, Dr. Ole Humlum reported from his research that air temperatures lag 2-3 months behind changes in SST.  Thus cooling oceans portend cooling land air temperatures to follow.  He also observed that changes in CO2 atmospheric concentrations lag behind SST by 11-12 months.  This latter point is addressed in a previous post Who to Blame for Rising CO2?

After a change in priorities, updates are now exclusive to HadSST4.  For comparison we can also look at lower troposphere temperatures (TLT) from UAHv6 which are now posted for August.  The temperature record is derived from microwave sounding units (MSU) on board satellites like the one pictured above. Recently there was a change in UAH processing of satellite drift corrections, including dropping one platform which can no longer be corrected. The graphs below are taken from the revised and current dataset.

The UAH dataset includes temperature results for air above the oceans, and thus should be most comparable to the SSTs. There is the additional feature that ocean air temps avoid Urban Heat Islands (UHI).  The graph below shows monthly anomalies for ocean air temps since January 2015.

Note 2020 was warmed mainly by a spike in February in all regions, and secondarily by an October spike in NH alone. In 2021, SH and the Tropics both pulled the Global anomaly down to a new low in April. Then SH and Tropics upward spikes, along with NH warming brought Global temps to a peak in October.  That warmth was gone as November 2021 ocean temps plummeted everywhere. After an upward bump 01/2022 temps reversed and plunged downward in June.  After an upward spike in July, ocean air everywhere cooled in August and also in September.   

After sharp cooling everywhere in January 2023, all regions were into negative territory. Note the Tropics matched the lowest value, but since have spiked sharply upward +1.7C, with the largest increases in April to July, and continuing through adding to a new high of 1.3C January to March 2024.  In April and May that started dropping in all regions.   June showed a sharp decline everywhere, led by the Tropics down 0.5C. The Global anomaly fell to nearly match the September 2023 value. In July, the Tropics rose slightly while SH, NH and the Global Anomaly were unchanged. Now in August a drop in the Tropics, with little NH cooling and Global Ocean anomaly slightly lower.

Land Air Temperatures Tracking in Seesaw Pattern

We sometimes overlook that in climate temperature records, while the oceans are measured directly with SSTs, land temps are measured only indirectly.  The land temperature records at surface stations sample air temps at 2 meters above ground.  UAH gives tlt anomalies for air over land separately from ocean air temps.  The graph updated for August is below.

Here we have fresh evidence of the greater volatility of the Land temperatures, along with extraordinary departures by SH land.  Land temps are dominated by NH with a 2021 spike in January,  then dropping before rising in the summer to peak in October 2021. As with the ocean air temps, all that was erased in November with a sharp cooling everywhere.  After a summer 2022 NH spike, land temps dropped everywhere, and in January, further cooling in SH and Tropics offset by an uptick in NH. 

Remarkably, in 2023, SH land air anomaly shot up 2.1C, from  -0.6C in January to +1.5 in September, then dropped sharply to 0.6 in January 2024, matching the SH peak in 2016. Then in February and March SH anomaly jumped up nearly 0.7C, and Tropics went up to a new high of 1.5C, pulling up the Global land anomaly to match 10/2023. In April SH dropped sharply back to 0.6C, Tropics cooled very slightly, but NH land jumped up to a new high of 1.5C, pulling up Global land anomaly to its new high of 1.24C.

In May that NH spike started to reverse.  Despite warming in Tropics and SH, the much larger NH land mass pulled the Global land anomaly back down to the February value. In June, sharp drops in SH and Tropics land temps overcame an upward bump in NH, pulling Global land anomaly down to match last December. In July, all land regions rose slightly, and now in August a record spike up to 1.87 and pulling the Global land anomaly up by 0.17ยฐC. Despite this land warming, the Global land and ocean combined anomaly rose only 0.03ยฐC.

The Bigger Picture UAH Global Since 1980

The chart shows monthly Global anomalies starting 01/1980 to present.  The average monthly anomaly is -0.04, for this period of more than four decades.  The graph shows the 1998 El Nino after which the mean resumed, and again after the smaller 2010 event. The 2016 El Nino matched 1998 peak and in addition NH after effects lasted longer, followed by the NH warming 2019-20.   An upward bump in 2021 was reversed with temps having returned close to the mean as of 2/2022.  March and April brought warmer Global temps, later reversed
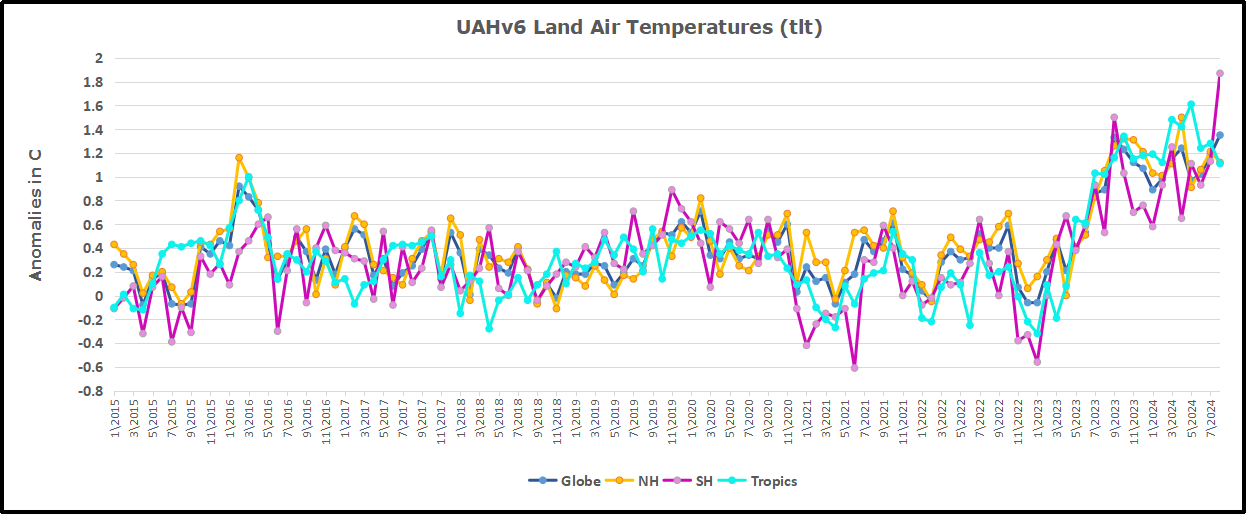
With the sharp drops in Nov., Dec. and January 2023 temps, there was no increase over 1980. Then in 2023 the buildup to the October/November peak exceeded the sharp April peak of the El Nino 1998 event. It also surpassed the February peak in 2016. After March and April took the Global anomaly to a new peak of 1.05C.  The cool down started with May dropping to 0.90C, and in June a further decline to 0.80C.  Despite an uptick to 0.85 in July,   it remains to be seen whether El Nino will weaken or gain strength, and it whether we are past the recent peak.

The graph reminds of another chart showing the abrupt ejection of humid air from Hunga Tonga eruption.

TLTs include mixing above the oceans and probably some influence from nearby more volatile land temps.ย  Clearly NH and Global land temps have been dropping in a seesaw pattern, nearly 1C lower than the 2016 peak.ย  Since the ocean has 1000 times the heat capacity as the atmosphere, that cooling is a significant driving force.ย  TLT measures started the recent cooling later than SSTs from HadSST4, but are now showing the same pattern. Despite the three El Ninos, their warming has not persisted prior to 2023, and without them it would probably have cooled since 1995.ย  Of course, the future has not yet been written.