Global warming, climate change, all these things are just a dream come true for politicians. I deal with evidence and not with frightening computer models because the seeker after truth does not put his faith in any consensus. The road to the truth is long and hard, but this is the road we must follow. People who describe the unprecedented comfort and ease of modern life as a climate disaster, in my opinion have no idea what a real problem is.
Post breakthrough: How AI can lift climate research out of the lab and into the real world
May 29, 2024
Technological innovation is needed if the world is to avert the most dangerous climate change scenarios.
Innovation begins with research and development (R&D) but does not end there. AI can catalyze innovation by translating R&D into climate action.
Generative AI’s capabilities for natural language processing, data synthesis and down-scaling and product prototyping can deliver practical tools to climate leaders.
The world is making big bets on technology’s role in the climate crisis. Across the globe, scientists and technologists are pushing for the next wave of breakthroughs in climate adaptation and mitigation. And there is reason for optimism: recent years have seen meaningful progress, from weather forecasting to industrial decarbonization.
…
AI and climate change
The debut of Generative AI (GenAI) expanded the collective imagination of what AI can do. We already know that AI can drive scientific breakthroughsbut can it go further? Leaders should explore how AI can act as a downstream catalyst in the innovation cycle, driving adoption of the latest tools and awareness of the latest science. Here are three places to start:
1. Organizing unstructured Earth data and down-scaling models to local levels
Earth science has been seen as “data messy” due to complex Earth systems and unstructured environmental data from observational methods. Recently, the volume of such data has exploded, with over 100 terabytes of satellite imagery collected daily. Yet, this doesn’t simplify the data’s unstructured nature. AI is key to organizing and down-scaling this vast data for local applications.
…
2. Building a ‘GPT’ interface to translate climate models into simple language
…
GenAI could simplify this by providing a GPT-like interface enabling users of all backgrounds to interact with climate data relevant to their needs, such as monitoring local sea-level changes. This approach could make climate models more accessible and build trust in climate projections.
3. Accelerating the prototyping phase of technology development
…
Leaders must, therefore, step up to build ecosystems for AI and climate change. The World Economic Forum’s Tech for Climate Adaptation Initiativehelps enable this necessary environment by convening players from big technology, startups, academia, government and other stakeholders.
Maybe I’m being too harsh about this latest WEF brainstorm.
Generative AI has a known tendency to lie and make things up (technically known as “hallucinations” in the AI industry), but Google recommends one way to combat hallucinations is to limit the range of possible responses.
There is an obvious output limitation would protect the reputation of the proposed climate chatbot.
If climate ChatGPT had a limitation of only discussing climate disasters which would occur at least 50 years in the future, and ignoring or deflecting dangerous questions like “where are today’s climate disasters?”, there would be no chance the climate chatbot’s “hallucinations” would ever be discovered. 50 years from now, who would remember what a chatbot said today?
ClimateData.ca is a climate data portal supported financially by Environment and Climate Change Canada (ECCC) and allegedly produced by Canada’s “leading climate organizations”. The stated goal of the portal is to “support decision makers across a broad spectrum of sectors and locations by providing the most up-to-date climate data in easy to use formats and visualizations.”
ClimateData.ca is a climate data portal supported financially by Environment and Climate Change Canada (ECCC) and allegedly produced by Canada’s “leading climate organizations”. The stated goal of the portal is to “support decision makers across a broad spectrum of sectors and locations by providing the most up-to-date climate data in easy to use formats and visualizations.”
The unsuspecting reader might think that the portal focuses its reporting on the past and current changes in Canada’s temperatures, weather and climate. That would be factual reporting. Instead, if you open the portal for the city in which you live, as I did for Ottawa, you mostly find a set of alarming projections about what the area’s temperatures and precipitation will be for the 2021-2050, 2051-2080 and 2070-2100 time periods. In other words, it is a set of forecasts based upon computer modelling and using scenarios developed for the Intergovernmental Panel on Climate Change (IPCC).
The purpose of this note is to explain why those projections may seriously mislead any person really interested in understanding what the future may hold. No one, of course, knows that. To project it first requires a fair-minded and accurate establishment of the “base case” – in other words, an understanding of what has happened to climate in the past and what the continuation of past trends would indicate. Then, one has to imagine and quantify what will happen in future.
All attempts to predict the future are laden with uncertainties and often tainted by the political agendas of the forecasters. The best that anyone can do is to assemble what the best current studies show are the relationships between natural and human influences on the climate; the comparative influences of different economic, scientific and population trends; and the range of possibilities about how these things may change in future. Part of this guessing process is to experiment with different possibilities, packaged together as “scenarios”.
Understanding the Past
Estimates of historical temperatures up until a century ago are based on “proxy” estimates, as there were no direct measurements. The only direct and reliable measures of global average temperatures are those provided since satellites began providing data in 1979, so any claims to precision before that time are false. There, however, is a general consensus that, to the extent it is possible to measure “average global temperature”, it has risen about 1.1 degree Celsius over the period 1870 to 2020. Temperatures were as warm or warmer in the Minoan Period 3,000 years ago, the Roman Period 2000 years ago and the Medieval Warm Period 1,000 years ago as they are today.
It is especially difficult to determine what has changed temperatures in the past, and especially in the period since the mid-nineteenth century. Climate and temperatures are affected by many influences, including notably solar activity, the oceans and other natural cycles plus the effects of human activities. The earth is still warming as a result of the transition since the Little Ice Age in the seventeenth century. The measurement of changes in temperatures is greatly complicated by the urban heat island effect, which contaminates the instrument temperature records, and the decline in operating stations (the number of stations dropped from 6000 globally in the 1970s to 2600 by 1997). A study by McKitrick and Michaels in 2007 showed that over half of the warming over land since 1980 in instrument data sets is due to the urban heat island effect.
Modelling
An understanding of the past is important to assess the relationship between increases in the concentration of greenhouse gases (measured in terms of carbon dioxide equivalent) in the atmosphere and changes in global temperatures, if any. These are inputs into economic computer programs called integrated assessment models (IAM), of which the most commonly used are called PAGE, DICE and FUND. The IAM links projections (i.e. educated guesses) of future population, technology, economics with emissions scenarios. Most of the public reporting that people see is based on the DICE and PAGE models. The FUND model, however, is arguably superior because the other two do not take into account the significant benefits to the world of carbon dioxide fertilization of crops and forests.
The IAM attempts to estimate the Equilibrium Climate Sensitivity (ECS), which is the global average surface temperature change due to a doubling of carbon dioxide concentrations. This will occur after the oceans reach a temperature equilibrium, which takes about 1500 years.
The IPCC, in its AR5 report, estimated that the ECS is 3.0, meaning that the effect of doubling CO2 concentrations by about the year 2100 would be an increase average global temperatures of 3.0 degrees C. , with an uncertainty range of 1.5 degrees C to 4.5 degrees C. Actual temperature changes could be higher or lower than that due to the effects of natural cycles.
Climatologists Nicholas Lewis and Dr. Judith Curry published a paper in 2018 that used an observationally-based energy balance method to estimate the ECS. They estimated that the ECS was 1.50. More recent analyses, taking into account natural warming and the effects of urban heat islands, have lowered the estimated ECS to 1.04. How to determine the most likely ECS remains one of the central controversies in the climate change debate.
Scenarios
During the preparation of its Fifth Assessment Report in 2014, the Intergovernmental Panel on Climate Change (IPCC) decided to use four “Representative Concentration Pathways” (RCPs), meaning scenarios developed by modelers regarding carbon dioxide-equivalent concentrations in the earth’s atmosphere. The pathways were labelled RCP2.6, RCP 4.5. RCP6 and RCP8.5. They correspond to estimates of the ECS of 2.6, 4.5, 6.0 and 8.5, generally far above the climate sensitivity estimates from recent academic research. They were initially developed with the understanding that the scenarios, and the models that used them, were simply scientific tools aimed at exploring a variety of conditions as a way to test hypotheses and researchers’ understanding of the climate system.
The IPCC, however, associated the RCP scenarios with likelihoods of happening when it labeled the scenario leading to the largest amount of climate change, RCP8.5, as the single “business-as-usual” scenario of the set. As Roger Pielke has observed, “In so doing, the IPCC identified RCP8.5 as the most likely future in the absence of further policy intervention, which gave it special status among not only the RCPs but among the hundreds of baseline scenarios of the broader IPCC scenario database.”
The RCP 8.5 scenario was very different from the others. It was perceived as depicting the situation that might prevail “without climate policy”; in other words, if the countries of the world took no measures to reduce GHG emissions beyond those in place in 2014. RCP8.5 has annual carbon dioxide emissions more than tripling by century’s end, the concentration of carbon dioxide in the atmosphere soaring to more than 900 parts per million, and the radiative forcing (i.e. a scientific concept used to quantify and compare the external drivers of change to Earth’s energy balance) more than triple what it is today.
Some of the most prestigious experts, such as Dr. Judith Curry, have characterized RCP8.5 as clearly “implausible” implying that it has less than a 2% chance of occurring. It was undoubtedly intended by the modelers to be a “worst case”.
Without the attention and credibility given to RCP8.5, it is doubtful that a persuasive case could be made for high carbon dioxide taxes or “net-zero by 2050” policies.
RCP8.5 is a perverse corruption of climate science and an extraordinarily damaging propaganda tool used by climate campaigners. It does not even remotely provide a credible basis for projecting the future; its probability ranges between the implausible and the impossible. However, by the magic of misrepresentation and skillful public relations, the worst case became in the public’s mind the “most likely” case.
IPCC Modelling Performance
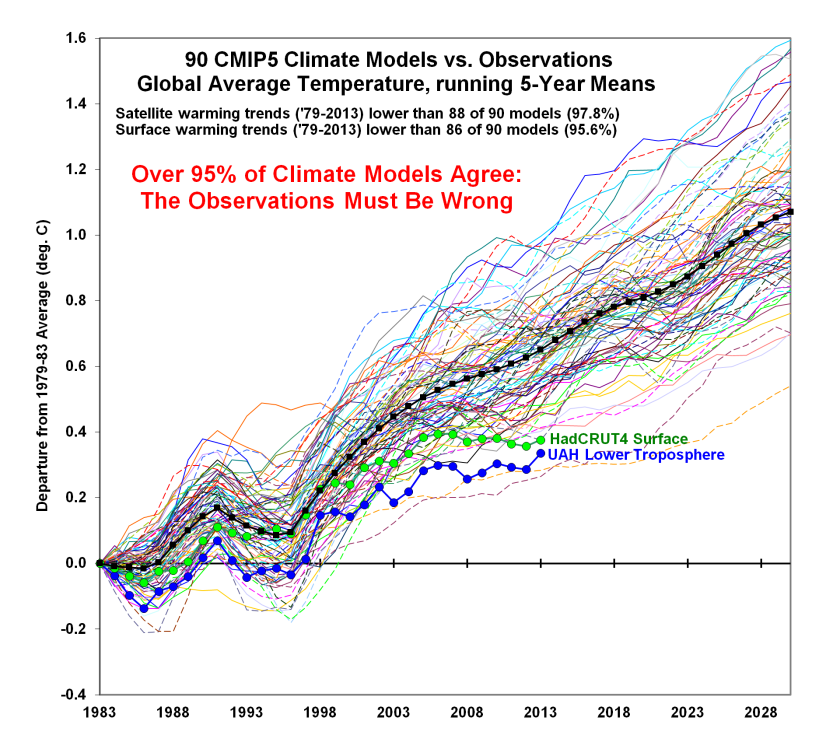
The climate models used by the IPCC have failed even to model accurately the temperature changes that have occurred since 1990. The IPCC models are “running too hot”. The average modelled global lower troposphere temperature trend from 1979 is 200% of the measured trends. The troposphere is the lowest part of the atmosphere where we live.
Nowhere in any of the IPCC science reports will you find a claim that the world is facing a climate catastrophe or that humanity’s future is in peril.
What ClimateData.ca Does
ClimateData.ca explicitly relies upon the IPCC’s modelling and scenarios. Indeed, it specifically quotes RCP8.5 as the basis for its projections. In other words, it perpetuates the myth that the worst case is the most likely case.
In the case of Ottawa, it notes that for the 1971-2000 period, the annual average temperature was 6.0 degrees C. and the average annual precipitation was 933 mm.
It then warns that under a high emissions scenario (i.e. RCP 8.5):
Annual average temperatures will be 8.7 degrees C in the 2021-2050 period (i.e. 42% higher)
Annual average temperatures will be 10.8 degrees C. in the 2051-2080 period (i.e. 60% higher)
Annual average temperatures will be 12.6 degrees C. for the last 30 years of the century (i.e. 110% higher)
Average annual precipitation will be 13% higher for the 2051-2080 period
Average annual precipitation will ne 17% higher for the last 30 years of the century.
This is not data reporting. It is propaganda intended to serve a political purpose.
NOAA’s Storm Prediction Center (SPC) has now published the full data for US tornadoes last year.
First a recap though. Over the years, the ability to observe and measure tornadoes has increased out of all proportion to the situation 50 or so years ago. This is what NOAA said in 2015:
Historical Records and Trends
One of the main difficulties with tornado records is that a tornado, or evidence of a tornado must have been observed. Unlike rainfall or temperature, which may be measured by a fixed instrument, tornadoes are short-lived and very unpredictable. If a tornado occurs in a place with few or no people, it is not likely to be documented. Many significant tornadoes may not make it into the historical record since Tornado Alley was very sparsely populated during the 20th century.
Much early work on tornado climatology in the United States was done by John Park Finley in his book Tornadoes, published in 1887. While some of Finley’s safety guidelines have since been refuted as dangerous practices, the book remains a seminal work in tornado research. The University of Oklahoma created a PDF copy of the book and made it accessible at John Finley’s Tornadoes.
Today, nearly all of the United States is reasonably well populated, or at least covered by NOAA’s Doppler weather radars. Even if a tornado is not actually observed, modern damage assessments by National Weather Service personnel can discern if a tornado caused the damage, and if so, how strong the tornado may have been. This disparity between tornado records of the past and current records contributes a great deal of uncertainty regarding questions about the long-term behavior or patterns of tornado occurrence. Improved tornado observation practices have led to an increase in the number of reported weaker tornadoes, and in recent years EF-0 tornadoes have become more prevelant in the total number of reported tornadoes. In addition, even today many smaller tornadoes still may go undocumented in places with low populations or inconsistent communication facilities.
With increased National Doppler radar coverage, increasing population, and greater attention to tornado reporting, there has been an increase in the number of tornado reports over the past several decades. This can create a misleading appearance of an increasing trend in tornado frequency. To better understand the variability and trend in tornado frequency in the United States, the total number of EF-1 and stronger, as well as strong to violent tornadoes (EF-3 to EF-5 category on the Enhanced Fujita scale) can be analyzed. These tornadoes would have likely been reported even during the decades before Doppler radar use became widespread and practices resulted in increasing tornado reports. The bar charts below indicate there has been little trend in the frequency of the stronger tornadoes over the past 55 years.
NOAA have now deleted this highly inconvenient document, and instead publish this highly misleading graph every year, implying that tornadoes are more frequent than in the past:
As the 2015 document shows though, the total of EF-1s and over has changed little over the years. More significantly though the number of strong to violent tornadoes has fallen sharply over time.
Although NOAA stopped updating those two graphs after 2014, the SPC data confirms this trend has continued since:
There have been no EF-5 tornadoes at all for ten years now, since the Moore tornado in 2013; this is the longest period on record.
There is also a strong argument that many EF-1 tornadoes were also missed prior to the roll out of Doppler. As the chart below shows, Ef-1s now account for around 75% of all tornadoes (excl EF-0s), up from 60% or so:




You must be logged in to post a comment.