


From NoTricksZone
By Kenneth Richard on 27. November 2023

Variations in the greenhouse effect are predominantly modulated by water vapor and cloud cover. CO2’s role in the greenhouse effect is so minor it cannot be discerned.

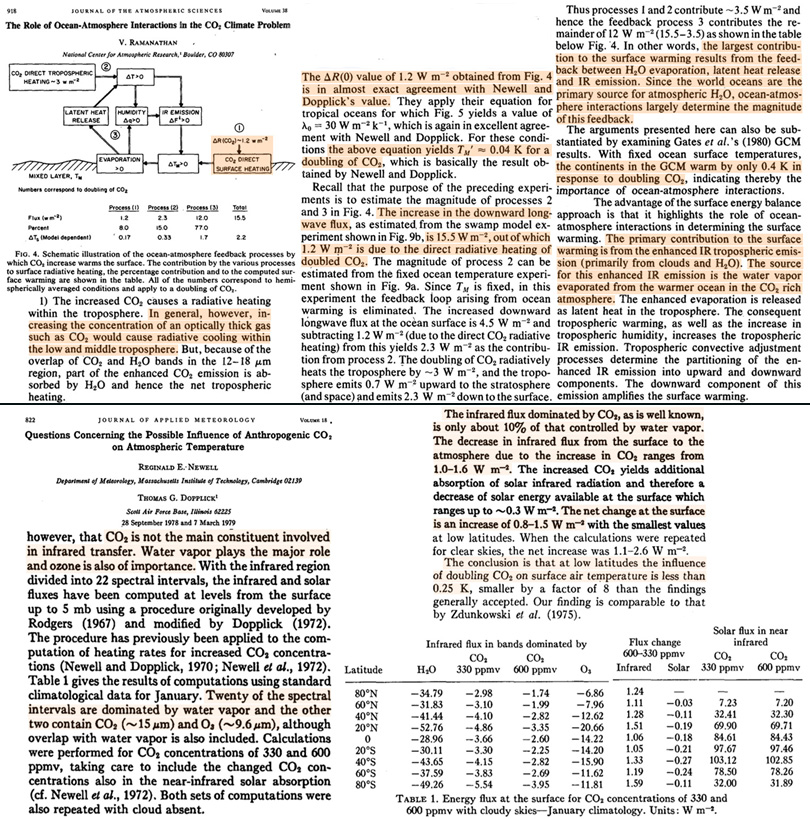
For decades scientists have reported that a CO2 concentration of about 300 ppm can only increase the downwelling longwave radiation (DLWR), or greenhouse effect, by about 1.5 W/m² at the surface. See, for example, the complementary studies by Ramanathan (1981) and Newell and Dopplick (1979).
“The infrared flux dominated by CO₂, as is well known, is only about 10% of that controlled by water vapor. The decrease in infrared flux from the surface to the atmosphere due to the increase in CO₂ ranges from 1.0 – 1.6 W/m².” – Newell and Dopplick, 1979
With the total DLWR value assessed as ~330 W/m² , this means that CO2’s 300 ppm (~1.5 W/m²) impact can only enhance the greenhouse effect by around 0.5%. Nearly all the rest is dominated by water vapor (and cloud).
“Carbon dioxide…increasing downwelling LW radiation by ~1.5 W/m². It is about 0.5% of the 327 W/m² of overall downwelling radiation that warms the Earth’s surface. The vast majority of that warming is contributed by water vapor. Together with cloud, it accounts for 98% of the greenhouse effect.” – Physics of the Atmosphere and Climate (textbook)

New research (Koutsoyiannis and Vournas, 2023) published in the Hydrological Sciences Journal serves to further affirm the minor, even non-discernible role of CO2 within the greenhouse effect.
Using DLWR data from 71 globally distributed sites, these scientists assesses the post-1900 increase in the CO2 concentration (from 300 ppm to 420 ppm) “has not altered, in a discernible manner, the greenhouse effect.”
.
If CO2 concentration increases were to enhance the greenhouse effect – and thus be considered the driver of modern warming – there should be a change in data point distribution (displacement) in alignment with CO2 increases along the equality line as shown in the DLWR data set chart (Figure 2). This has not occurred.
.
“An enhancement of the greenhouse effect, due to increasing CO2 concentration, through the years would be seen as a gradual displacement of the points from left to right with the progression of time. However, the alignment of the points of the different data sets does not show a gradual displacement from left to right. This means that the effect of the direct CO2 emission at the surface is smaller than the side effects…causing the variability in Figure 2, and thus it is impossible to discern.”

In fact, the opposite of what should happen with an enhanced greenhouse effect has been slightly more discernible in data sets. All-sky (clouds included) DLWR trends at the top of atmosphere (TOA) have actually been shown to be declining in 21st century CERES observations, as they are “slightly negative for all-sky.” In other words, the 2000-present greenhouse effect has been weakening despite increasing CO2 concentrations.

The declining greenhouse effect observed in recent decades has been reported by many other scientists.
“…the negative trend of G [greenhouse effect anomalies] indicates that the atmospheric greenhouse effect is temporarily [1985-1999] decreasing, despite the fact that greenhouse gasses are increasing.” – Cess and Udelhofen, 2003
If the greenhouse effect has not been enhanced since the 1980s, it cannot be responsible for modern warming.


 Tom Nelson
You must be logged in to post a comment.