Global warming, climate change, all these things are just a dream come true for politicians. I deal with evidence and not with frightening computer models because the seeker after truth does not put his faith in any consensus. The road to the truth is long and hard, but this is the road we must follow. People who describe the unprecedented comfort and ease of modern life as a climate disaster, in my opinion have no idea what a real problem is.
Climate alarmists, the press/media, and politicians say we must achieve net zero CO2 by 2050 to avoid catastrophic global warming. In reality, all humanity and all life on Earth benefit from the increased atmospheric CO2 and the slight temperature increase.
THE BENEFITS OF CO2 – PART 2: CO2 does not cause global warming
Abstract: Climate alarmists, the press/media, and politicians say we must achieve net zero CO2 by 2050 to avoid catastrophic global warming. In reality, all humanity and all life on Earth benefit from the increased atmospheric CO2 and the slight temperature increase. In Part 1, we presented scientific arguments to show how increased CO2, and warmer temperatures benefit humanity and all life on Earth. In Part 2, we discuss why a growing number of independent scientists and engineers argue that CO2 does not cause any measurable global warming. Part 3 will present how and why increased CO2 does not cause extreme climate/weather conditions. in the concluding Part 4 we present recommendations for policymakers.
Introduction: In this study, we set out facts and scientific principles consistent with established laws of physics, chemistry, and thermodynamics to state that greenhouse gases (GHGs) and the greenhouse effect (GHE) do not measurably warm the Earth. The concept that it does is at best a 100-year-old myth. The absorption and re-emission of longwave infrared radiation from the Earth’s surface does not cause any measurable warming of the Earth. It also raises the particular concern that the UN IPCC and NASA/NOAA do not address all of the sources of heat that warm the Earth. Nor consider the many natural forces and cycles that cause weather and climate variations that operate at the Astronomical, Endo-Earth, and Bio-Earth levels. Their well-published and promoted Earth Energy Budget needs serious revisions or to be discarded. Two main concepts describe atmospheric physics and thermodynamics, and each plays a vital role in understanding how the Sun warms the Earth and how the Earth cools. The first is the Radiative Transfer Concept (RTC) and the second is the Heat Transport Concept (HTC). They are both important and both need to be studied to fully understand our weather and climate systems. RTC needs an understanding of quantum physics, radiation, photons, absorption/emissions, etc. HTC needs an understanding of the more mundane science of atmospheric thermodynamics, convection, latent heat, conduction, evaporation-condensation, air and ocean circulations, etc.
Radiation Transfer Concept-RTC. The Sun provides most of the energyneeded to warm the Earth to a comfortable and sustainable level for all life. Solar radiation (photons) readily crosses the vacuum of space and arrives at Earth’s Top Of Atmosphere (TOA) at the speed of light. We see a simplified conceptual model of this radiation in Figure 1, showing the wavelength/ frequency, amplitude, and direction of propagation. These electromagnetic energy rays are emitted over a broad set of vibrational frequencies, spanning 20 orders of magnitude, called the spectrum. This radiant energy arrives at TOA at 1,366 W/m 2 with an average of 340 Watts per square meter (W/m 2) when averaged over the spherical world.About 30% of the 340 W/m 2 is reflected to space leaving 240 W/m 2 for the Earth. There one-third is absorbed by the atmosphere and two-thirds by the surface (oceans + lands). The high-energy UV radiation warms the air mostly by photodissociation and photoionization. In this process, the solar radian electromagnetic energy is converted to kinetic energy, and then to physical heat through collisions with air molecules. At the surface, about 67% warms and then cools by local physical heat processes like conduction, convection, and latent heat and 33% by radiation. Most of this radiation exits directly to space through an “atmospheric window” at frequencies that are not absorbable by GHGs. It’s estimated that only about 0.09 W of the solar energy absorbed by the surface is radiated through CO2 the non-water vapor greenhouse gasses (GHGs), a trivially small amount.
In essence, the IPCC claims that these greenhouse gasses already contribute about 33 degrees C of temperature to the average global temperature, and it will continue to increase with increased quantities of human-made CO2 /GHGs. In Summary, the IPCC claim is based on three false assumptions:
1) When a photon’s electromagnetic energy is absorbed by CO2 it warms the CO2 molecule with physical heat. This heat is then shared with other air molecules and the atmosphere warms. The energized CO2 molecule will then re-emit a comparable photon, and the process is repeated hundreds/thousands of times before its heat/energy finally exits into space.
2) Half of all the re-emitted photons go upward as described in 1). But half are radiated downward and are re-absorbed by the surface and warm it.
3) The Sun provides Earth with only enough energy to give the planet an average global temperature of -18°C. But measurements tell us that the average global temperature is about 15°C, therefore they claim that CO2 and the GHE provide the missing 33°C heat.
Together these concepts allegedly warm the Earth by first converting the photon’s Electromagnetic Energy (EMI) into physical heat, and secondly, this process delays the release of the original photon energy into space allowing heat to accumulate and delaying its exit to space. The details of their false science and the errors in their explanation are provided in this article Revised Why all the fuss with CO2 and the Greenhouse effect
Heat Transport Concept, or HTC is the second step towards what happens to the EMI energy of these photons as they approach the surface. Some will be reflected to space, for example, in Antarctica, nearly 100% is reflected to space by the ice and snow. Some will be scattered in the atmosphere and cause no measurable warming of anything. Most of these photons are visible light and Infrared and are not readily absorbed by the air. Nearly all of these photons are absorbed by the surface, the dense solid matter and liquid part, and warms it. This process of photon absorption by the surface and warming is called thermalization and we now discuss the Heat Transport Concept, or HTC. In general, the atmosphere does not warm the surface because the air is normally cooler than the surface. We know this based on the established atmospheric Temperature Lapse Rates. For example, the dry air lapse rate is 9.8°C per Km of altitude. This means that the atmospheric temperature cools by 9.8°C for each kilometre of altitude up to the top of the troposphere. According to the Second Law of thermodynamics heat can only flow from a warmer object to a colder object, never the other way around. The RTC espoused by the UN IPCC violates this Second Law, thereby falsifying their point 2) above. Nitrogen, Oxygen, argon, and water vapor make up more than 99% of the atmosphere. The optical depth, or transparency of the air close to the surface is very opaque. This ensures that almost 100% of resonant Longwave Infrared Radiation (LWIR) photons emitted by the surface will be absorbed by GHGs and immediately thermalized within the first several millimetres of altitude. This means that the resonant photon will be immediately absorbed by a CO2 molecule and become energized. An energized CO2 molecule could spontaneously re-emit the absorbed photon in about half a second as described by the UN IPCC theory. In reality, however, within a millionth/billionth of a second that energised CO2 molecule will physically collide with a non-GHG molecule. The impact of the collision will heat the non-GHG molecule and de-energize the CO2 molecule. So that initial photon has disappeared, and its electromagnetic energy is changed to physical heat and is dispersed throughout the atmosphere adding a tiny bit of warmth to the air. The detailed process is described in Part 2, pages 5-6 of the paper linked above.
Conclusion. This CO2 photon absorption and immediate collision-thermalization process dominates throughout the troposphere. This means that the CO2 resonant LWIR radiation energy radiating from the surface is saturated to extinction by an overabundance of CO2/GHG molecules. There are no resonant photons left in the troposphere for the CO2 molecule to absorb. This is readily visible in Figure 2 by the presence of the CO2 notch, the top red arrow. In the stratosphere and mesosphere where the molecules are few and far apart, we see an increase in the CO2 spontaneous re-emissions implying a reverse- thermalization and the re-emitted photons exit to space. The UN IPCC claim that CO2/GHGs is the major cause of global warming is thus falsified by the above explanation that is consistent with established laws of science, combined with the absence of any scientific test data.
This makes two powerful cases: First, we can safely abandon the goal and costs of Net Zero and Carbon Capture and Sequestration. Even in the extreme case that atmospheric CO2 doubles or quadruples there is no risk of a catastrophic, run-away global warming threat. Second, the press/media, politicians, and compromised scientists will also say that we should reduce and remove CO2 from the air just to be sure. But, there’s a fact, that there is about 50 times more CO2 dissolved in the oceans than in the air. Henry’s Law tells us nature apportions how much CO2 goes into the air and how much goes into the oceans based only on the temperature of the water’s surface. During a hot sunny day, more CO 2 flows from the oceans to the air. And in cold winters more CO 2 will flow from the air into the oceans and all water on Earth. Imagine the silliness of spending $ billions/trillions to remove CO2 from the air and then have the oceans immediately replace it.
In summary, we find out that CO2/GHG absorption of LWIR energy emitted by the surface provides a negligible amount of physical heat in the troposphere. Consequently, the GHG/GHE provides near zero of the missing heat that the IPCC attributes to the GHGs and the GHE.
Background Paper with complete discussion
Missing Link in the GHE, Greenhouse Effect, by Thomas Shula – Markus Ott, USA – Germany 2024. From allaboutenergy.net
An error or fault resulting from defective judgment, deficient knowledge, or carelessness.
A misconception or misunderstanding.
Five Major IPCC Science Mistakes
♦ Surface stations records have warmed mostly from urban heat sources, not IR-active gases.
♦ Solar climate forcing varies more than IPCC admits.
♦ Experiments show more CO2 does not make air warmer.
♦ On all time scales temperature changes lead and CO2 changes follow.
♦ IPCC climate models exclude natural climate factors to blame all warming on GHGs.
Mistakes on Temperature Records and Solar Forcing
The first two misconceptions are described in a recent paper by CERES (Center for Environmental Research and Earth Sciences). My post below provides the details.
Overview of CERES Study
Our review suggests that the IPCC reports have inadequately accounted for two major scientific concerns when they were evaluating the causes of global warming since the 1850s:
1. The global temperature estimates used in the IPCC reports are contaminated by urban warming biases. 2. The estimates of solar activity changes since the 1850s considered by the IPCC substantially downplayed a possible large role for the Sun.
We conclude that it is not scientifically valid for the IPCC to rule out the possibility that global warming might be mostly natural.
Fatal Flaw Discredits IPCC Science
By way of John Ray comes this Spectator Australia article A basic flaw in IPCC science. Excerpts in italics with my bolds and added images.
Detailed research is underway that threatens to undermine the foundations of the climate science promoted by the IPCC since its First Assessment Report in 1992. The research is re-examining the rural and urban temperature records in the Northern Hemisphere that are the foundation for the IPCC’s estimates of global warming since 1850. The research team has been led by Dr Willie Soon (a Malaysian solar astrophysicist associated with the Smithsonian Institute for many years) and two highly qualified Irish academics – Dr Michael Connolly and his son Dr Ronan Connolly. They have formed a climate research group CERES-SCIENCE. Their detailed research will be a challenge for the IPCC 7th Assessment Report due to be released in 2029 as their research results challenge the very foundations of IPCC science.
The climate warming trend published by the IPCC is a continually updated graph based on the temperature records of Northern Hemisphere land surface temperature stations dating from the mid 19th Century. The latest IPCC 2021 report uses data for the period 1850-2018. The IPCC’s selection of Northern Hemisphere land surface temperature records is not in question and is justifiable. The Northern Hemisphere records provide the best database for this period. The Southern Hemisphere land temperature records are not that extensive and are sparse for the 19th and early 20th Century. It is generally agreed that the urban temperature data is significantly warmer than the rural data in the same region because of an urban warming bias. This bias is due to night-time surface radiation of the daytime solar radiation absorbed by concrete and bitumen. Such radiation leads to higher urban night-time temperatures than say in the nearby countryside. The IPCC acknowledges such a warming bias but allegesthe increased effect is only 10 per cent and therefore does not significantly distort its published global warming trend lines.
Since 2018, Dr Soon and his partners have analysed the data from rural and urban temperature recording stations in China, the USA, the Arctic, and Ireland. The number of stations with reliable temperature records in these areas increased from very few in the mid-19th Century to around 4,000 in the 1970s before decreasing to around 2,000 by the 1990s. The rural temperature recording stations with good records peaked at 400 and are presently around 200.
Their analysis of individual stations needs to account for any variation in their exposure to the Sun due to changes in their location, OR shadowing due to the construction of nearby buildings, OR nearby vegetation growth. The analysis of rural temperature stations is further complicated as over time many are encroached by nearby cities. Consequently, the data from such stations needs to be shifted at certain dates from the rural temperature database to either an intermediate database or to a full urban database. Consequently, an accurate analysis of the temperature records of each recording station is a time-consuming task.
This new analysis of 4,000 temperature recording stations in China, the USA, the Arctic, and Ireland shows a warming trend of 0.89ºC per century in the urban stations that is 1.61 times higher that a warming trend of 0.55ºC per century in the rural stations. This difference is far more significant than the 10 per cent divergence between urban and rural stations alleged in the IPCC reports; a divergence explained by a potential flaw in the IPCC’s methodology. The IPCC uses a technique called homogenisation that averages the rural and urban temperatures in a particular region. This method distorts the rural temperature records as over 75 per cent of the temperature records used in this homogenisation methodology are urban stations. So, a methodology that attempts to statistically identify and correct some biases that may be in the raw data, in effect, leads to an urban blending of the rural dataset. This result is biased as it downgrades the actual values of each rural temperature station. In contrast, Dr Soon and his coworkers avoided homogenisation so the temperature trends they identify for each rural region are accurate as the rural data are not distorted by the readings from nearby urban stations.
The rural temperature trend measured by this new research is 0.55ºC per century and it indicates the Earth has warmed 0.9ºC since 1850. In contrast, the urban temperature trend measured by this new research is 0.89ºC per century and indicates a much higher warming of 1.5ºC since 1850. Consequently, a distorted urban warming trend has been used by the IPCC to quantify the warming of the whole of the Earth since 1850. The exaggeration is significant as the urban temperature record database used by the IPCC only represents the temperatures on 3-4 per cent of the Earth’s land surface area; an area less than 2 per cent of the Earth’s total surface area. During the next few years, Dr Willie Soon and his research team are currently analysing the meta-history of 800 European temperature recording stations. When this is done their research will be based on very significant database of Northern Hemisphere rural and urban temperature records from China, the USA, the Arctic, Ireland, and Europe.
This new research has unveiled another flaw in the IPCC‘s temperature narrative as trend lines in its revised temperature datasets are different from those published by the IPCC. For example, the rural records now show a marked warming trend in the 1930s and 1940s while there is only a slight warming trend in the IPCC dataset. The most significant difference is the existence of a marked cooling period in the rural dataset for the 1960s and 1970s that is almost absent in the IPCC’s urban dataset. This later divergence upsets the common narrative that rising carbon dioxide levels control modern warming trends. For, if carbon dioxide levels are the driver of modern warming, how can a higher rate of increasing carbon dioxide levels exist within a cooling period in the 1960s and 1970s while a lower increasing rate of carbon dioxide levels coincides with an earlier warming interval in the 1930s and 1940s? Or, in other words, how can carbon dioxide levels increasing at 1.7 parts per million per decade cause a distinct warming period in the 1930s and 1940s while a larger increasing rate of 10.63 parts per million per decade is associated with a distinct cooling period in the 1960s and 1970s! Consequently, the research of Willie Soon and his coworkers is discrediting, not only the higher rate of global warming trends specified in IPCC Reports, but also the theory that rising carbon dioxide levels explain modern warming trends; a lynchpin of IPCC science for the last 25 years.
Willie Soon and his coworkers maintain that climate scientists need to consider other possible explanations for recent global warming. Willie Soon and his coworkers point to the Sun, but the IPCC maintains that variations in Total Solar Irradiance (TSI) are over eons and not over shorter periods such as the last few centuries. For that reason, the IPCC point to changes in greenhouse gases as the most obvious explanation for global warming since 1850. In contrast, Willie Soon and his coworkers maintain there can be short-term changes in solar activity and, for example, refer to a period of no sunspot activity that coincided with the Little Ice Age in the 17th Century. They also point out there is still no agreed average figure for Total Solar Irradiance (TSI) despite 30 years of measurements taken by various satellites. Consequently, they contend research in this area is not settled.
The CERES-SCIENCE research project pioneered by Dr Willie Soon and the father-son Connolly team has questioned the validity of the high global warming trends for the 1850-present period that have been published by the IPCC since its first report in 1992. The research also queries the IPCC narrative that rising greenhouse gas concentrations, particularly carbon dioxide, are the primary driver of global warming since 1850. That narrative has been the foundation of IPCC climate science for the last 40 years. It will be interesting to see how the IPCC’s 7th Assessment Report in 2029 treats this new research that questions the very basis of IPCC’s climate science.
A statistical analysis was applied to Northern Hemisphere land surface temperatures (1850–2018) to try to identify the main drivers of the observed warming since the mid-19th century. Two different temperature estimates were considered—a rural and urban blend (that matches almost exactly with most current estimates) and a rural-only estimate. The rural and urban blend indicates a long-term warming of 0.89 °C/century since 1850, while the rural-only indicates 0.55 °C/century. This contradicts a common assumption that current thermometer-based global temperature indices are relatively unaffected by urban warming biases.
Three main climatic drivers were considered, following the approaches adopted by the Intergovernmental Panel on Climate Change (IPCC)’s recent 6th Assessment Report (AR6): two natural forcings (solar and volcanic) and the composite “all anthropogenic forcings combined” time series recommended by IPCC AR6. The volcanic time series was that recommended by IPCC AR6. Two alternative solar forcing datasets were contrasted. One was the Total Solar Irradiance (TSI) time series that was recommended by IPCC AR6. The other TSI time series was apparently overlooked by IPCC AR6. It was found that altering the temperature estimate and/or the choice of solar forcing dataset resulted in very different conclusions as to the primary drivers of the observed warming.
Our analysis focused on the Northern Hemispheric land component of global surface temperatures since this is the most data-rich component. It reveals that important challenges remain for the broader detection and attribution problem of global warming: (1) urbanization bias remains a substantial problem for the global land temperature data; (2) it is still unclear which (if any) of the many TSI time series in the literature are accurate estimates of past TSI; (3) the scientific community is not yet in a position to confidently establish whether the warming since 1850 is mostly human-caused, mostly natural, or some combination. Suggestions for how these scientific challenges might be resolved are offered.
Mistake on CO2 Warming Effect
Thomas Allmendinger is a Swiss physicist educated at Zurich ETH whose practical experience is in the fields of radiology and elemental particles physics. His complete biography is here.
His independent research and experimental analyses of greenhouse gas (GHG) theory over the last decade led to several published studies, including the latest summation The Real Origin of Climate Change and the Feasibilities of Its Mitigation, 2023, at Atmospheric and Climate Sciences journal. The paper is a thorough and detailed discussion of which I provide here the abstract and the excerpt describing the experiment. Excerpts are in italics with my bolds and added images. Full post is Experimental Proof Nil Warming from GHGs.
Abstract
The actual treatise represents a synopsis of six important previous contributions of the author, concerning atmospheric physics and climate change. Since this issue is influenced by politics like no other, and since the greenhouse-doctrine with CO2 as the culprit in climate change is predominant, the respective theory has to be outlined, revealing its flaws and inconsistencies.
But beyond that, the author’s own contributions are focused and deeply discussed. The most eminent one concerns the discovery of the absorption of thermal radiation by gases, leading to warming-up, and implying a thermal radiation of gases which depends on their pressure. This delivers the final evidence that trace gases such as CO2 don’t have any influence on the behaviour of the atmosphere, and thus on climate.
But the most useful contribution concerns the method which enables to determine the solar absorption coefficient βs of coloured opaque plates. It delivers the foundations for modifying materials with respect to their capability of climate mitigation. Thereby, the main influence is due to the colouring, in particular of roofs which should be painted, preferably light-brown (not white, from aesthetic reasons).
It must be clear that such a drive for brightening-up the World would be the only chance of mitigating the climate, whereas the greenhouse doctrine, related to CO2, has to be abandoned. However, a global climate model with forecasts cannot be aspired to since this problem is too complex, and since several climate zones exist.
4. Thermal Gas Absorption Measurements
If the warming-up behaviour of gases has to be determined by temperature measurements, interference by the walls of the gas vessel should be regarded since they exhibit a significantly higher heat capacity than the gas does, which implicates a slower warming-up rate. Since solid materials absorb thermal radiation stronger than gases do, the risk exists that the walls of the vessel are directly warmed up by the radiation, and that they subsequently transfer the heat to the gas. And finally, even the thin glass-walls of the thermometers may disturb the measurements by absorbing thermal radiation.
By these reasons, quadratic tubes with a relatively large profile (20 cm) were used which consisted of 3 cm thick plates from Styrofoam, and which were covered at the ends by thin plastic foils. In order to measure the temperature course along the tube, mercury-thermometers were mounted at three positions (beneath, in the middle, and atop) whose tips were covered with aluminum foils. The test gases were supplied from steel cylinders being equipped with reducing valves. They were introduced by a connecter during approx. one hour, because the tube was not gastight and not enough consistent for an evacuation. The filling process was monitored by means of a hygrometer since the air, which had to be replaced, was slightly humid. Afterwards, the tube was optimized by attaching adhesive foils and thin aluminum foils (see Figure 13). The equipment and the results are reported in [21].
Figure 13. Solar-tube, adjustable to the sun [21].
The initial measurements were made outdoor with twin-tubes in the presence of solar light.One tube was filled with air, and the other one with carbon-dioxide. Thereby, the temperature increased within a few minutes by approx. ten degrees till constant limiting temperatures were attained, namely simultaneously at all positions. Surprisingly, this was the case in both tubes, thus also in the tube which was filled with ambient air. Already this result delivered the proof that the greenhouse theory cannot be true. Moreover, it gave rise to investigate the phenomenon more thoroughly by means of artificial, better defined light.
Figure 14. Heat-radiation tube with IR-spot [21].
Accordingly, the subsequent experiments were made using IR-spots with wattages of 50 W, 100 W and 150W which are normally employed for terraria (Figure 14). Particularly the IR-spot with 150 W lead to a considerably higher temperature increase of the included gas than it was the case when sunlight was applied, since its ratio of thermal radiation was higher. Thereby, variable impacts such as the nature of the gas could be evaluated.
Due to the results with IR-spots at different gases (air, carbon-dioxide, the noble gases argon, neon and helium), essential knowledge could be gained. In each case, the irradiated gas warmed up until a stable limiting temperature was attained. Analogously to the case of irradiated coloured solid plates, the temperature increased until the equilibrium state was attained where the heat absorption rate was identically equal with the heat emission rate.
Figure 15. Time/temperature-curves for different gases [21] (150 W-spot, medium thermometer-position).
As evident from the diagram in Figure 15, the initial observation made with sunlight was approved that pure carbon-dioxide was warmed up almost to the same degree as air does (whereby ambient air only scarcely differed from a 4:1 mixture between nitrogen and oxygen). Moreover, noble gases absorb thermal radiation, too. As subsequently outlined, a theoretical explanation could be found thereto.
Conclusion
Finally, the theoretically suggested dependency of the atmospheric thermal radiation intensity on the atmospheric pressure could be empirically verified by measurements at different altitudes, namely in Glattbrugg (430 m above sea level and on the top of the Furka-pass (2430 m above sea level), both in Switzerland, delivering a so-called atmospheric emission constant A ≈ 22 W·m−2•bar−1•K−0.5. It explained the altitude-paradox of the atmospheric temperature and delivered the definitive evidence that the atmospheric behavior, and thus the climate, does not depend on trace gases such as CO2. However, the atmosphere thermally reradiates indeed, leading to something similar to a Greenhouse effect. But this effect is solely due to the atmospheric pressure.
Mistake on Warming Prior to CO2 Rising
Changes in CO2 follow changes in global temperatures on all time scales, from last month’s observations to ice core datasets spanning millennia. Since CO2 is the lagging variable, it cannot logically be the cause of temperature, the leading variable. It is folly to imagine that by reducing human emissions of CO2, we can change global temperatures, which are obviously driven by other factors. Most recent post on this:
In 2009, the iconic email from the Climategate leak included a comment by Phil Jones about the “trick” used by Michael Mann to “hide the decline,” in his Hockey Stick graph, referring to tree proxy temperatures cooling rather than warming in modern times. Now we have an important paper demonstrating that climate models insist on man-made global warming only by hiding the incline of natural warming in Pre-Industrial times. The paper is From Behavioral Climate Models and Millennial Data to AGW Reassessment by Philippe de Larminat. H/T No Tricks Zone. Excerpts in italics with my bolds.
Abstract
Context. The so called AGW (Anthropogenic Global Warming), is based on thousands of climate simulations indicating that human activity is virtually solely responsible for the recent global warming. The climate models used are derived from the meteorological models used for short-term predictions. They are based on the fundamental and empirical physical laws that govern the myriad of atmospheric and oceanic cells integrated by the finite element technique. Numerical approximations, empiricism and the inherent chaos in fluid circulations make these models questionable for validating the anthropogenic principle, given the accuracy required (better than one per thousand) in determining the Earth energy balance.
Aims and methods. The purpose is to quantify and simulate behavioral models of weak complexity, without referring to predefined parameters of the underlying physical laws, but relying exclusively on generally accepted historical and paleoclimate series.
Results. These models perform global temperature simulations that are consistent with those from the more complex physical models. However, the repartition of contributions in the present warming depends strongly on the retained temperature reconstructions, in particular the magnitudes of the Medieval Warm Period and the Little Ice Age. It also depends on the level of the solar activity series. It results from these observations and climate reconstructions that the anthropogenic principle only holds for climate profiles assuming almost no PCA neither significant variations in solar activity. Otherwise, it reduces to a weak principle where global warming is not only the result of human activity, but is largely due to solar activity. Full post is here:
“I gave up on Judith Curry a while ago. I don’t know what she thinks she’s doing, but it’s not helping the cause, or her professional credibility.” (- Michael Mann, below)
“I gave up on Judith Curry a while ago. I don’t know what she thinks she’s doing, but it’s not helping the cause, or her professional credibility.” (- Michael Mann, below)
The futile, wasteful anti-CO2 crusade is in its 37th year, dating from the hot, dry summer of 1988 when NASA scientist James Hansen sounded the alarm before U.S. lawmakers, led by Al Gore.
Last week, the United Nations Conference of Parties (COP) ended with acrimony over an unenforceable agreement pledging to transfer wealth to developing (Statist) countries for “clean” energy development.
CO2 emissions cuts? With almost all major emitters well beyond the targets set in the 2015 Paris Accord, the (also) unenforceable agreement is losing more and more every day as self-interest swamps aspirations. The recipient welfare states described COP29 as “chaotic,” “complete failure,” “optical illusion,” “stage managed,” and “paltry.” Big Green recognized the international effort as more greenwashing than progress, not unlike prior COP results. Mainstream media has tried to paint a happy face on the walking dead.
COP29’s failure should not be surprising? Stated James Hansen.
[The Paris agreement] is a fraud really, a fake. It’s just bullshit for them to say: ‘We’ll have a 2C warming target and then try to do a little better every five years.’ It’s just worthless words. There is no action, just promises. As long as fossil fuels appear to be the cheapest fuels out there, they will be continued to be burned.
But it all begins with the physical science, and the science of climate alarmism has really never recovered from its PR disaster 15 years ago: Climategate. No amount of whitewashing can erase the words, sentences, and paragraphs of one of the greatest scientific scandals of our time. Four categories are mentioned below:
Man-Made Warming Controversy
“I know there is pressure to present a nice tidy story as regards ‘apparent unprecedented warming in a thousand years or more in the proxy data’ but in reality the situation is not quite so simple.”
—Dr. Keith Briffa, Climatic Research Unit, disclosed Climategate e-mail, Sep. 22, 1999.
“Keith’s [Briffa] series…differs in large part in exactly the opposite direction that Phil’s [Jones] does from ours. This is the problem we all picked up on (everyone in the room at IPCC was in agreement that this was a problem and a potential distraction/detraction from the reasonably consensus viewpoint we’d like to show w/ the Jones et al and Mann et al series).”
—Dr. Michael Mann, IPCC Lead Author, disclosed Climategate e-mail, Sep. 22, 1999.
“…it would be nice to try to ‘contain’ the putative ‘MWP’ [Medieval Warm Period]…”
—Dr. Michael Mann, IPCC Lead Author, disclosed Climategate e-mail, June 4, 2003
“By the way, when is Tom C [Crowley] going to formally publish his roughly 1500 year reconstruction??? It would help the cause to be able to refer to that reconstruction as confirming Mann and Jones, etc.”
—Dr. Michael Mann, IPCC Lead Author, disclosed Climategate e-mail, Aug. 3, 2004.
“I gave up on Judith Curry a while ago. I don’t know what she thinks she’s doing, but it’s not helping the cause, or her professional credibility.”
—Dr. Michael Mann, IPCC Lead Author, disclosed Climategate e-mail, May 30, 2008
“Well, I have my own article on where the heck is global warming… The fact is that we can’t account for the lack of warming at the moment and it is a travesty that we can’t.”
—Dr. Kevin Trenberth, IPCC Lead Author, disclosed Climategate e-mail, Oct. 12, 2009.
Manipulating Temperature Data
“I’ve just completed Mike’s [Mann] Nature trick of adding in the real temps to each series for the last 20 years (i.e. from 1981 onwards) and from 1961 for Keith’s [Briffa] to hide the decline.
—Dr. Phil Jones, Director of the Climatic Research Unit, disclosed Climategate e-mail, Nov. 16, 1999
“Also we have applied a completely artificial adjustment to the data after 1960, so they look closer to observed temperatures than the tree-ring data actually were….
—Dr. Tim Osborn, Climatic Research Unit, disclosed Climategate e-mail, Dec. 20, 2006.
“If you look at the attached plot you will see that the land also shows the 1940s warming blip (as I’m sure you know). So, if we could reduce the ocean blip by, say 0.15 deg C, then this would be significant for the global mean—but we’d still have to explain the land blip….”
—Dr. Tom Wigley, University Corporation for Atmospheric Research, on adjusting global temperature data, disclosed Climategate e-mail to Phil Jones, Sep. 28, 2008.
“We, therefore, do not hold the original raw data but only the value-added (i.e. quality controlled and homogenized) data.”
—Climatic Research Unit web site, the world’s leading provider of global temperature data, admitting that it can’t produce the original thermometer data, 2011.
Data Suppression; Freedom of Information (FOI) Avoidance
“We have 25 or so years invested in the work. Why should I make the data available to you, when your aim is to try to find something wrong with it.”
—Dr. Phil Jones, Director of the Climate Research Unit at East Anglia University, email to Warwick Hughes, 2004.
“I’m getting hassled by a couple of people to release the CRU station temperature data. Don’t any of you three tell anybody that the UK has a Freedom of Information Act.”
—Dr. Phil Jones, Director of the Climatic Research Unit, disclosed Climategate e-mail, Feb. 21, 2005.
“Mike [Mann], can you delete any e-mails you may have had with Keith [Trenberth] re AR4? Keith will do likewise…. Can you also e-mail Gene and get him to do the same? I don’t have his e-mail address…. We will be getting Caspar to do likewise.”
—Dr. Phil Jones, Director of the Climatic Research Unit, disclosed Climategate e-mail, May 29, 2008.
“You might want to check with the IPCC Bureau. I’ve been told that IPCC is above national FOI Acts. One way to cover yourself and all those working in AR5 [the upcoming IPCC Fifth Assessment Report] would be to delete all e-mails at the end of the process. Hard to do, as not everybody will remember it.”
—Dr. Phil Jones, Director of the Climatic Research Unit, on avoiding Freedom of Information requirements, disclosed Climategate e-mail, May 12, 2009.
Subverting the Peer-Review Process
“I can’t see either of these papers being in the next IPCC report. Kevin [Trenberth] and I will keep them out somehow, even if we have to redefine what the peer-review literature is!”
—Phil Jones, Director of the Climatic Research Unit, disclosed Climategate e-mail, July 8, 2004.
Implications
The establishment whitewashed and then pretended that the episode was over. Mr. Climategate himself, Michael Mann, called the episode “pathetic” and “shameless”. [1] “After three inquiries, thousands of column inches and several death threats,” Dave Reay wrote in Nature, “the ‘Climategate’ affair is now subsiding into the long grass of conspiracy blogs.” [2]
Nope. Climategate is nary forgotten as a blatant case of professional misconduct and a classic case of ‘Busted!”. It lives in infamy.
————————-
[1] Mann added:
As for emails that in some way involve me, I hardly see anything damning at all, despite these snippets all being taken out of context. I guess they had very little left to work with, having culled in the first round the emails that could most easily be taken out of context to try to make me look bad…. Agents doing the dirty bidding of the fossil fuel industry know they can’t contest the fundamental science of human-caused climate change. So they have instead turned to smear, innuendo, criminal hacking of websites, and leaking out-of-context snippets of personal emails in their effort to try to confuse the public about the science and thereby forestall any action to combat this critical threat.”
[2] Better reactions were made by Derek Lowe in Science who stated, “what I feel needs to be looked at is the scientific conduct. I’m no climatologist, but I am an experienced working scientist – so, is there a problem here?”
I’ll give you the short answer: yes. I have to say that there appears to be several, as shown by many troubling features in the documents that have come out. The first one is the apparent attempts to evade the UK’s Freedom of Information Act. I don’t see how these messages can be interpreted in any other way as an attempt to break the law, and I don’t see how they can be defended…. A second issue is a concerted effort to shape what sorts of papers get into the scientific literature. Again, this does not seem to be a matter of interpretation; such messages as this, this, and this spell out exactly what’s going on. You have talk of getting journal editors fired…. A third issue I want to comment on are the problems with the data and its analysis…. No matter what you think about climate change, if you respect the scientific endeavor, this is very bad news. Respect has to be earned. And it can be lost.
Fundamental components of the anthropogenic global warming (AGW) paradigm fail molecular chemistry.
According to a new study, the notion that we can and must reduce atmospheric CO2 so as to avoid climate catastrophe (e.g., runaway global warming or ocean acidification) does not withstand probing academic scrutiny.
Carbon Capture and Storage (CCS) is a mitigation strategy proposing to sequester CO2 underground to reduce emissions to “net zero” by 2050. The practice is poised to cost tens of trillions of dollars over the coming decades. New analysis suggests high or ambitious CCS scenarios are presumed to mitigate about half of today’s emissions by 2050. But these economically draconian CCS scenarios are projected to cost US$30 trillion more than those that only mitigate about one-tenth of today’s emissions. Either way, the costs of CCS are astronomical.
But can CCS actually do what is intended and reduce atmospheric CO2 concentrations? Chemistry says no, CCS “will not reduce the atmospheric concentration of CO2 at all.”
“The crux of the issue is that, unlike photosynthesis by plants, perfect sequestration of CO2 will no magically release the O2 that has effectively been ‘sequestered’ in the CO2 and H2O molecules produced by combustion.”
“If the fuel was made of pure carbon, then the net result in the composition of the atmosphere would be a slight reduction in the O2 concentration…and a slight concomitant increase in the CO2 concentration due to the slight shrinking of the denominator.”
Regarding the alarmist “ocean acidification” narrative, the modern trend of rising atmospheric CO2 is assumed to be driving changes in pH levels. However, the chemical basis for this narrative is dubious.
Using the stoichiometric combustion equation, we learn that for every 1 ppm of CO2 increase due to burning fossil fuels, the O2 concentrations decrease by about 2.15 ppm. (For example, over a 20-year period, CO2 increases by 50 ppm as the O2 declines by ~130 ppm.) But this conceptualization engenders fundamental questions for the paradigm that says humans drive changes in the oceans’ pH levels.
“If the reduction in the atmospheric O2 concentration is directly related to the increase of CO2 in the atmosphere, then how can there be enough absorption of CO2 by the oceans to cause ocean acidification, especially since the oceans are highly buffered chemically?”
“If the observed reduction in the atmospheric O2 is accounted for by the observed increase in the atmospheric CO2 concentration, as expected as a result of combustion, then where does the extra CO2 come from that can cause ocean acidification?”
These are just a few of the many other chemistry-based challenges to the AGW narrative described in the paper. It is well worth a read.
From the University of Oxford and the Wellll….duhhhh! department comes this exercise in peer-reviewed futility.
In a new study, led by the University of Oxford’s Department of Physics and published November 18 in Nature, an international group of authors who developed the science behind net zero demonstrate that relying on ‘natural carbon sinks’ like forests and oceans to offset ongoing CO2 emissions from fossil fuel use will not actually stop global warming.
Natural sinks play a vital role to moderate the impact of current emissions and draw down atmospheric CO2 concentrations after the date of net zero, stabilizing global temperatures. Yet governments and corporations are increasingly turning to them to offset emissions, rather than reducing fossil fuel use or developing more permanent CO2 disposal options. Emissions accounting rules encourage this by creating an apparent equivalence between fossil fuel emissions and drawdown of CO2 by some natural carbon sinks, meaning a country could appear to have ‘achieved net zero’ whilst still contributing to ongoing warming.
The authors call on governments and corporations to clarify how much they are counting on natural carbon sinks to meet their climate goals, as well as recognising the need for Geological Net Zero.
Geological Net Zero means balancing flows of carbon into and out of the solid Earth, with one tonne of CO2 committed to geological storage for every tonne still generated by any continued fossil fuel use. Given the cost and challenges of permanent geological CO2 storage, achieving Geological Net Zero will require a substantial reduction in fossil fuel use.
The authors stress the importance of protecting and maintaining natural carbon sinks while accepting that doing so cannot compensate for ongoing fossil fuel use. Total historical CO2 emissions determine how much a country or company has contributed to the global need for ongoing natural carbon sinks. A country like the UK, with large historical emissions and limited natural sinks, has implicitly committed other countries to maintain natural sinks for decades after UK emissions reach net zero. This is not currently addressed in climate talks.
Professor Myles Allen, of the University of Oxford’s Department of Physics, who led the study, summarises: “We are already counting on forests and oceans to mop up our past emissions, most of which came from burning stuff we dug out of the ground. We can’t expect them to compensate for future emissions as well. By mid-century, any carbon that still comes out of the ground will have to go back down, to permanent storage. That’s Geological Net Zero.”
Dr Glen Peters, of the CICERO Center for International Climate Research in Oslo, Norway, a study co-author, says “Countries report both emissions and removals, but using all removals in climate targets is a recipe for continued warming. Natural carbon sinks currently clean up around half our annual emissions for free, but this ecosystem service must be kept separate from the fossil emissions driving climate change. Relabelling things will not stop global warming.”
Professor Kirsten Zickfeld of Simon Fraser University in British Columbia, Canada, co-author and leader of one of the other 2009 net zero papers, says “It is a common assumption that removing carbon from the atmosphere to offset burning of fossil fuels is as effective as not burning fossil fuels in the first place. It is not. Offsetting continued fossil fuel use with carbon removal will not be effective if the removal is already being counted on as part of the natural carbon cycle and if the carbon is not permanently stored. Unless we can increase transparency in national Greenhouse gas reporting and target setting, offsets will become part of the problem instead of part of the solution.”
Study co-author Professor Jo House of the University of Bristol UK says: “Land is limited, we rely on it for food, nature, biodiversity, leisure, water storage, and so on. It cannot offset more than a portion of fossil emissions even now, probably less in future with worsening pressures on the biosphere such as population increase, fires, and drought. Giving carbon credits for natural processes that are happening anyway undermines trust in the whole idea of offsetting. We have to urgently protect natural carbon sinks, but there are more scientifically credible and equitable ways of doing this than relying on carbon offset markets.”
CO₂ pricing typically focuses only on emissions during operation,
neglecting significant environmental and economic costs
incurred during other stages or by the entire system.
Dr. Lars Schernikau is an energy economist explaining why CO2 pricing (also falsely called “carbon pricing”) is a terrible idea fit only for discarding. His blog article is The Dilemma of Pricing CO2. Excerpts below in italics with my bolds and added images.
1.Understanding CO₂ pricing 2.Economic and environmental impact 3.Global economic impact 4.Alternative solutions 5.Conclusion 6.Additional comments and notes 7.References
Introduction
As an energy economist I am confronted daily with questions about the “energy transition” away from conventional fuels. As we know, the discussion about the “energy transition” stems from concerns about climatic changes.
The source of climatic changes is a widely discussed issue, with numerous policies and measures proposed to mitigate its impact. One such measure is the current and future pricing of carbon dioxide (CO₂) emissions. The logic followed is that if human CO₂ emissions are reduced, future global temperatures will be measurably lower, extreme weather events will be reduced, and sea-levels will rise less or stop rising all together.
Although intended to reduce greenhouse gases, this approach has sparked considerable debate. In this blog post I discuss the controversial topic of CO₂ pricing, examining its economic and environmental ramifications.
However, this article is not about the causes of climatic changes, nor is it about the negative or positive effects of a warming planet and higher atmospheric CO₂ concentrations. It is also not about the scientifically undisputed fact that we don’t know how much warming CO₂ causes (a list of recent academic research on CO₂’s climate sensitivity can be found at the end of this blog).
Nor do I unpack the undisputed and IPCC confirmed fact that each additional ton of CO₂ in the atmosphere has less warming effect than the previous ton as the climate sensitivity of CO₂ is a logarithmic function irrespective of us not knowing what that climate sensitivity is. I also don’t discuss the NASA satellite confirmed greening of the world over the past decades partially driven by higher atmopheric CO₂ concentrations (see sources inc Chen et al. 2024).
Instead, this blog post is about the environmental and economic “sense”, or lack thereof, of pricing CO₂ emissions as currently practiced in most OECD countries and increasingly seen in developing nations. It is about the “none-sense” of measuring practically all human activity with a “CO₂ footprint”, often mistakenly called “carbon footprint”, and having nearly every organization set claims for current or future “Net-Zero” (Figure 1).
1.Understanding CO₂ Pricing
CO₂ pricing aims to internalize the external costs of CO₂ emissions, thereby encouraging businesses and individuals to reduce their “carbon footprint”. The concept is straightforward: by assigning a cost to CO₂ emissions, it becomes financially advantageous to emit less CO₂.
However, this simplistic view overlooks significant complexities and unintended consequences.
Our entire existence is based on drawing from nature (“renewable” or not), so the “Net-Zero” discussion ignores a fundamental requirement for our survival. I agree that it should be our aim to reduce the environmental footprint as much as possible but only if our lives, health, and wealth don’t deteriorate as a result.
Now, I am sure, some readers and many “activists” may disagree, which I respect but, at a global level, find unrealistic. However, I would assume that most agree that no-one’s life ought to be harmed or shortened for the sake of reducing the environmental impact made. Otherwise, there is little room for a conversation.
BloombergNEFs “New Energy Outlook” from May 2024 should possibly be called “CO₂ Outlook”, as there is little to be found about energy and its economics but rather all about CO₂ emissions and the so called “Net-Zero” (Figure 1), which is in line with media, government, and educational focus on primarily carbon dioxide emissions.
2.Economic and Environmental Impacts
One of the primary criticisms of CO₂ pricing is that it addresses only one environmental externality while ignoring others. This narrow focus can lead to economic distortions, as it fails to account for the full spectrum of environmental and social impacts. For instance, while CO₂ pricing might reduce emissions, it can also drive-up energy costs, disproportionately affecting lower-income populations and hindering economic development in lesser developed countries.
It is by now undisputed amongst energy economists that, large-scale “Net-Zero” intermittent and unpredictable wind and solar power generation increases the total or “full” cost of electricity, primarily because of their low energy density, intermittency, inherent net energy and raw material inefficiency, mounting integration costs for power grids, and the need for a drastic overbuild installation system plus an overbuild backup/storage system because of their intermittency.
CO₂ pricing can also result in environmental trade-offs. For example, the shift towards “renewable” energy sources like wind and solar, incentivized by CO₂ pricing, has its own set of environmental impacts, including land use, resource extraction, energy footprint, and energy storage challenges.
When BloombergNEF (Figure 1) displays how clean power and electrification will directly reduce CO₂ emissions to zero, then they are clearly mistaken.
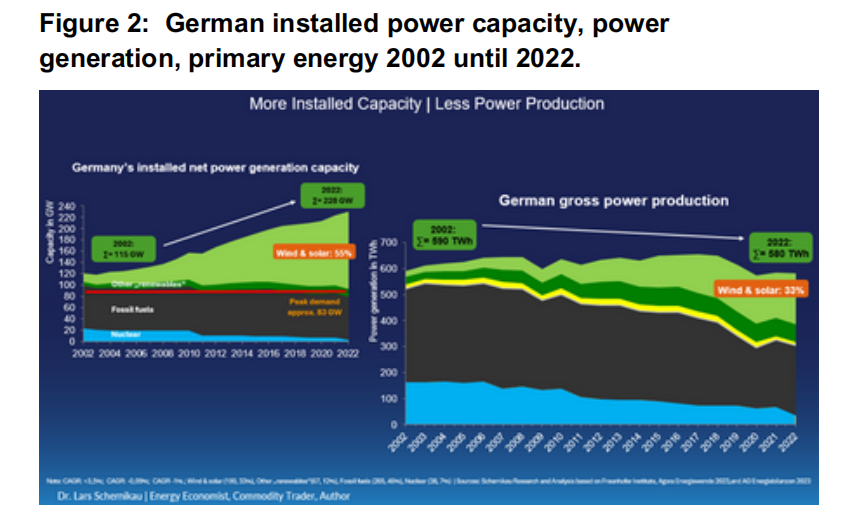
My native country Germany provides a notable example of the complexities involved in transitioning to “renewable” energy. The country has invested heavily in wind and solar power, leading to the highest electricity costs among larger nations. Germany’s installed wind and solar capacity is now twice the total peak power demand. This variable “renewable” wind and solar power capacity now produces about a third of the country’s electricity and contributes about 6% to Germany’s primary energy supply (Figure 2).
Higher energy costs, obviously and undisputedly, hurt less affluent people and stifles the development of poorer nations (Figure 3). Thus, a move to more expensive wind and solar energy has “human externalities”. The less fortunate will be “starved of” energy as they wouldn’t be able to afford it, leading to literal reduction in life expectancy.
Source: Eschenbach 2017; Figure 38 in Book “The Unpopular Truth… about Electricity and the Future of Energy”
CO₂ pricing typically focuses only on emissions during operation, neglecting significant environmental and economic costs incurred during other stages or by the entire system.
For instance, the production of solar panels involves substantial energy and raw material inputs. Today there is not one single solar panel that is produced without coal. Similarly, the manufacturing and transportation processes of wind turbines and electric vehicles are energy-intensive and environmentally impactful. These stages are rarely accounted for in CO₂ pricing schemes, leading to a distorted view of their true environmental footprint. Also not accounted for are:
a) the required overbuild, b) short and long duration energy storage, c) backup facilities, or d) larger network integration and transmission infrastructure.
Source: Schernikau, adapted from Figure 39 in Book “The Unpopular Truth… about Electricity and the Future of Energy“
Figure 4 illustrates how virtually all CO₂ pricing or taxation happens only at the stage of “operation” or combustion. How else could a “Net-Zero” label be assigned to a solar panel produced from coal and minerals extracted in Africa with diesel-run equipment, transported to China on a vessel powered by fuel-oil, and processed with heat and electricity from coal- or gas-fired power partially using forced labour? All this energy-intensive activity and not a single kilogram of CO₂ is taxed (see my recent article on this subject here) The same applies to wind turbines, hydro power, biofuel, or electric vehicles.
It turns out, CO₂ tax is basically just a means to redistribute wealth, with the collecting agency (government) deciding where the funds go. Yes, a CO₂ tax does incentivize industry to reduce CO₂ emissions at their taxed operations only, but this comes at a cost to economies, the environment, and often people. . . Any economist will confirm that pricing one externality but not others leads to economic distortions and, many would say, worse environmental impacts.
4.Alternative Approaches
Distortion, in this case, is just another word for unintended consequences to the environment, our economies, and the people. Pricing CO₂ only during combustion but failing to price methane, raw material and recycling, inefficiency, or embodied energy, or energy shortages, or land requirement, or greening from CO₂… will cause undesirable outcomes. The world will be worse off economically and environmentally.
Protest if you must, but let me offer a simple example. The leaders of the Western world seem to have united around abandoning coal immediately, because it is the highest CO₂ emitter during combustion (UN 2019). Instead, demanding reliable and affordable energy, Bangladesh, Pakistan, Germany, and so many more nations have embraced liquified natural gas (LNG) as a “bridge” fuel to replace coal. This “switch” is taking place despite questions about LNG’s impact on the environment, including the “climate”. This policy, supported by almost all large consultancies, indirectly caused blackouts affecting over 150 million people in Bangladesh in October 2022 (Reuters and Bloomberg).
So, the world is embarking on an expensive venture to replace as much coal as possible with more expensive liquified natural gas LNG.
On top of that, wind and solar are given preference. For example, the IEA recently confirmed that 2024 sparks the first year where investments in solar outstrip the combined investments in all other power generation technologies. As a result, energy costs go up,dependencies increase, lights go off, and, as per the UN’s IPCC, the “climate gets worse.”
Now imagine what would happen if we would truly take into account all environmental and human impacts, both negative and positive, along the entire value chain of energy production, transportation, processing, generation, consumption, and disposal… we would all be surprised! You would look at fossil fuels and certainly nuclear through different eyes. Instead we should simply incentivize resource and energy efficiency which will truly make a positive difference!
5.Conclusion
No matter what your view on climate change is, pricing CO₂ is harmful… why? Answer: … because pricing one externality but not others leads to economic and environmental distortions…causing human suffering.
That is why, even considering the entire value chain, I do not support any CO₂ pricing.. That is why I fight for environmental and economic justice so we can, by avoiding energy starvation and resulting poverty, make a truly positive difference not only for ourselves but also for future generations to come.. . We need INvestment in, not DIvestment from 80% of our energy supply to rationalize our energy systems and to allow people and the planet to flourish.
I strongly support increasing adaptation efforts, which have already been successful in drastically reducing the death rate and GDP adjusted financial damage from natural disasters during the past 100 years (OurWorldInData, Pielke 2022, Economist).


You must be logged in to post a comment.